Mis à jour
HeritEmpire PO3
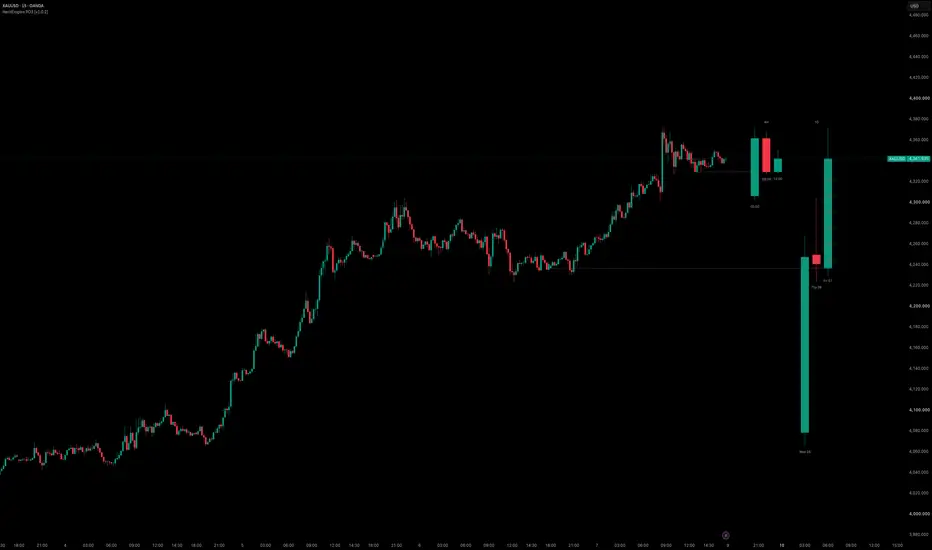
HeritEmpire PO3 — Higher-Timeframe Candle Projection
PO3 draws a compact mini-chart of higher-timeframe candles to the right of live price, so you can read HTF structure without leaving your current chart. Each higher timeframe is rendered as real candle shapes (body + wick), colored by direction, with the rightmost candle in every block being the current, still-developing HTF candle that updates as price moves.
What it does
For each enabled timeframe, the script requests OHLC data and keeps a rolling buffer of the most recently completed candles. On every new HTF period it captures the just-closed candle's final OHLC and appends it to the buffer, trimming to your chosen count. The block is then redrawn on the last bar: closed candles to the left, the live candle on the right. Because completed candles are only stored after they close, the closed portion of each block does not repaint; only the rightmost (live) candle changes intrabar, exactly as it would on the native chart.
How it works
How to use
Add it to any intraday chart. Read each block like a normal candlestick chart to judge higher-timeframe trend, momentum, and where current price sits relative to recent HTF opens and closes. Useful for keeping multi-timeframe context (for example 1H, 4H and Daily) visible while you work on a lower timeframe.
Settings
Notes
This is a visualization tool, not a signal or strategy. It does not generate buy/sell alerts and makes no performance claims — it simply mirrors higher-timeframe candles next to your chart for context.
PO3 draws a compact mini-chart of higher-timeframe candles to the right of live price, so you can read HTF structure without leaving your current chart. Each higher timeframe is rendered as real candle shapes (body + wick), colored by direction, with the rightmost candle in every block being the current, still-developing HTF candle that updates as price moves.
What it does
For each enabled timeframe, the script requests OHLC data and keeps a rolling buffer of the most recently completed candles. On every new HTF period it captures the just-closed candle's final OHLC and appends it to the buffer, trimming to your chosen count. The block is then redrawn on the last bar: closed candles to the left, the live candle on the right. Because completed candles are only stored after they close, the closed portion of each block does not repaint; only the rightmost (live) candle changes intrabar, exactly as it would on the native chart.
How it works
- Candle bodies are drawn as boxes between open and close; wicks are lines from low to high.
- Data is pulled with request.security using lookahead_off, so no future information is used.
- Up to three independent timeframes can be projected side by side, each as its own block.
How to use
Add it to any intraday chart. Read each block like a normal candlestick chart to judge higher-timeframe trend, momentum, and where current price sits relative to recent HTF opens and closes. Useful for keeping multi-timeframe context (for example 1H, 4H and Daily) visible while you work on a lower timeframe.
Settings
- Timeframes — Three independent slots (TF 1 / TF 2 / TF 3), each with its own on/off toggle and timeframe. Defaults: 1H (off), 4H (on), Daily (off).
- Candles to Show — Number of candles per block, from 1 to 10 (default 3 = 2 closed + 1 live).
- Offset (bars right) — Distance between live price and the first block.
- Gap Between Candles — Spacing between candles inside a block.
- Gap Between TF Blocks — Spacing between each timeframe block.
- Show TF Label — Displays the timeframe name above each block.
- Show Open Line — Extends each live candle's open across the chart as a reference level.
- Colors — Separate bullish/bearish colors for body, borders, and wicks.
Notes
This is a visualization tool, not a signal or strategy. It does not generate buy/sell alerts and makes no performance claims — it simply mirrors higher-timeframe candles next to your chart for context.
Notes de version
Here's what changedEach timeframe row now has its own "Candles" count input
Notes de version
What's changed:Open Line
- Now anchored to the bar where each timeframe's candle opened, so the line length reflects its own period instead of running across the whole chart.
- Uses a single configurable color.
Notes de version
What's changed:Added open time to each projected candle
Notes de version
What's changed:Optimised settings

Clause de non-responsabilité
Les informations et publications ne sont pas destinées à être, et ne constituent pas, des conseils ou recommandations financiers, d'investissement, de trading ou autres fournis ou approuvés par TradingView. Pour en savoir plus, consultez les Conditions d'utilisation.
Clause de non-responsabilité
Les informations et publications ne sont pas destinées à être, et ne constituent pas, des conseils ou recommandations financiers, d'investissement, de trading ou autres fournis ou approuvés par TradingView. Pour en savoir plus, consultez les Conditions d'utilisation.