[DAOL] Range Escape Quality
⏺️ What is it?
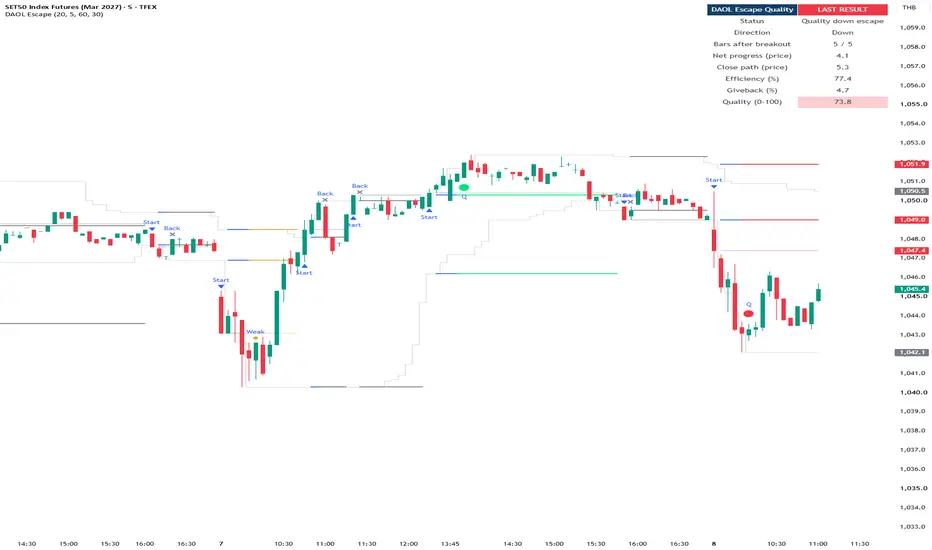
[DAOL] Range Escape Quality evaluates price movement after a confirmed breakout from a prior high–low range.
It combines directional efficiency and retracement to distinguish efficient follow-through from movement that stays outside the range but makes little progress.
🔹 Frozen Range — the prior range captured at the breakout
🔹 Directional Efficiency — forward progress relative to cumulative close-to-close movement
🔹 Giveback — how much of the best post-breakout progress has been lost
🔹 Quality Score — efficiency adjusted for giveback, ranging from 0 to 100
The score describes observed price movement. It is not a win probability or an automatic trading recommendation.
⏺️ Indicator นี้คืออะไร?
[DAOL] Range Escape Quality ประเมิน คุณภาพการเดินหน้าของราคาหลังปิดหลุดกรอบ โดยดูทั้งประสิทธิภาพการเคลื่อนที่และระยะที่คืนกลับ
ช่วยแยกระหว่าง “หลุดแล้วเดินหน้าต่อ” กับ “ยังอยู่นอกกรอบ แต่แกว่งมากและคืบหน้าน้อย”
🔹 Frozen Range — กรอบราคาเดิมที่ตรึงไว้เมื่อเกิด Breakout
🔹 Directional Efficiency — ระยะเดินหน้าสุทธิเทียบกับระยะเคลื่อนไหวสะสมของราคาปิด
🔹 Giveback — สัดส่วนระยะที่คืนกลับจากจุดที่เดินหน้าได้ไกลที่สุด
🔹 Quality Score — คะแนนประสิทธิภาพหลังหักการคืนระยะ อยู่ระหว่าง 0–100
คะแนนใช้บรรยายการเคลื่อนไหวที่เกิดขึ้น ไม่ใช่เปอร์เซ็นต์โอกาสชนะหรือคำแนะนำซื้อขายโดยอัตโนมัติ
⏺️ Why use it?
🔹 Evaluates follow-through after a breakout
🔹 Distinguishes directional progress from repeated back-and-forth movement
🔹 Keeps the original range fixed during each event
🔹 Measures how much progress remains after retracement
🔹 Provides a consistent observation window for comparing events
⏺️ ทำไมต้องใช้?
🔹 อ่านคุณภาพการเคลื่อนที่หลัง Breakout
🔹 แยกการเดินหน้าตามทิศทางออกจากการแกว่งไปมา
🔹 ตรึงกรอบเดิมตลอดเหตุการณ์ เพื่อให้ระดับอ้างอิงคงที่
🔹 ดูว่าราคายังรักษาระยะที่เดินหน้าไว้ได้มากแค่ไหน
🔹 ใช้ช่วงติดตามที่กำหนดชัดเจนเพื่อเปรียบเทียบแต่ละเหตุการณ์
⏺️ How does it work?
Build a range from the highs and lows of the preceding 20 bars, excluding the current bar.
Start an event when the current bar closes outside that range and the preceding close is within the same range.
Freeze the range boundaries and use the breakout close as the measurement origin.
Observe the next 5 closed bars by default.
Finish early if a close reaches or crosses back over the frozen breakout boundary.
Otherwise, classify the event when the observation window ends.
Only one event is tracked at a time. A new event cannot begin on the same bar that the previous event ends.
⏺️ ทำงานอย่างไร?
สร้างกรอบจากราคาสูงสุด–ต่ำสุดของ 20 แท่งก่อนหน้า โดยไม่รวมแท่งปัจจุบัน
เริ่มเหตุการณ์เมื่อราคาปิดหลุดกรอบ และราคาปิดแท่งก่อนหน้ายังอยู่ในกรอบเดียวกัน
ตรึงขอบกรอบ และใช้ราคาปิดแท่ง Breakout เป็นจุดเริ่มวัด
ติดตาม 5 แท่งปิดถัดไปตามค่าเริ่มต้น
จบก่อนกำหนดหากราคาปิดกลับถึงหรือข้ามขอบ Breakout เดิม
หากยังอยู่นอกกรอบ ให้ประเมินผลเมื่อครบช่วงติดตาม
ระบบติดตามครั้งละหนึ่งเหตุการณ์ และไม่เริ่มเหตุการณ์ใหม่ในแท่งเดียวกับที่เหตุการณ์เดิมจบ
ไม่นับแท่ง Breakout เป็นหนึ่งใน 5 แท่งติดตาม
⏺️ How is the score calculated?
Directional Efficiency compares positive net progress in the breakout direction with the sum of absolute close-to-close changes after the breakout close.
Giveback measures the fraction of peak forward progress that has been surrendered.
Quality Score = Directional Efficiency × (1 − Giveback / 100)
Example:
🔹 Cumulative close movement = 10 points
🔹 Net forward progress = 2 points
🔹 Directional Efficiency = 20%
🔹 Peak forward progress = 4 points
🔹 Giveback = 50%
🔹 Quality Score = 10
If price makes no positive forward progress, giveback is defined as 100%. If it returns across the breakout boundary, the final score is set to zero.
⏺️ คำนวณคะแนนอย่างไร?
Directional Efficiency เปรียบเทียบระยะเดินหน้าสุทธิในทิศทาง Breakout กับผลรวมระยะเปลี่ยนแปลงของราคาปิดหลังแท่ง Breakout โดยไม่นับระยะถอยเป็นความคืบหน้าบวก
Giveback วัดว่าราคาคืนระยะจากจุดที่เดินหน้าได้ไกลที่สุดไปแล้วกี่ส่วน
Quality Score = Directional Efficiency × (1 − Giveback / 100)
ตัวอย่าง:
🔹 ราคาปิดเคลื่อนที่สะสม 10 จุด
🔹 เดินหน้าสุทธิ 2 จุด
🔹 Directional Efficiency = 20%
🔹 เคยเดินหน้าได้ไกลที่สุด 4 จุด
🔹 Giveback = 50%
🔹 Quality Score = 10
หากไม่เคยเดินหน้าเป็นบวก กำหนด Giveback เป็น 100% หากราคาปิดกลับถึงหรือข้ามขอบ Breakout เดิม คะแนนสุดท้ายจะเป็นศูนย์
ระยะคืนกลับวัดจาก ราคาปิดแท่ง Breakout และจุดสุดขั้วของราคาปิดหลังจากนั้น ไม่ได้วัดจากไส้เทียน
⏺️ How to read the colors
🔹 Blue — an event is being tracked
🔹 Green — completed upward event meeting the quality thresholds
🔹 Red — completed downward event meeting the quality thresholds
🔹 Gold — completed event remaining outside the range with weak follow-through
🔹 Gray — returned across the breakout boundary, or no completed result
Default quality requirements:
🔹 Positive net progress in the breakout direction
🔹 Directional Efficiency ≥ 60%
🔹 Giveback ≤ 30%
Color classification uses these individual conditions, rather than a single Quality Score threshold.
⏺️ อ่านสีอย่างไร?
🔹 น้ำเงิน — กำลังติดตามเหตุการณ์
🔹 เขียว — Breakout ขึ้นที่ประเมินเสร็จและผ่านเกณฑ์คุณภาพ
🔹 แดง — Breakout ลงที่ประเมินเสร็จและผ่านเกณฑ์คุณภาพ
🔹 ทอง — ครบช่วงติดตามแล้วยังอยู่นอกกรอบ แต่การเดินหน้าไม่ผ่านเกณฑ์
🔹 เทา — ราคากลับถึงหรือข้ามขอบ Breakout เดิม หรือยังไม่มีผลประเมิน
เกณฑ์คุณภาพตามค่าเริ่มต้น:
🔹 เดินหน้าสุทธิในทิศทาง Breakout เป็นบวก
🔹 Directional Efficiency ≥ 60%
🔹 Giveback ≤ 30%
สีพิจารณาจากเงื่อนไขเหล่านี้แยกกัน ไม่ได้ใช้เกณฑ์คะแนนรวมเพียงตัวเดียว
สีแดงหมายถึงการเดินหน้าลงที่ผ่านเกณฑ์ ไม่ได้หมายถึงสัญญาณผิดพลาด
⏺️ How to use it
🔹 Watch the blue start marker to identify a new tracked event
🔹 Follow the frozen boundaries and breakout-close reference
🔹 Read the completed marker together with the dashboard
🔹 Compare efficiency and giveback across events using consistent settings
🔹 Combine the result with broader trend and price-structure analysis
The latest completed result remains visible until another event begins. It is a retained historical result, not a new signal on every subsequent bar.
⏺️ วิธีใช้งาน
🔹 ดูเครื่องหมาย Start สีน้ำเงินเพื่อระบุจุดเริ่มเหตุการณ์
🔹 ติดตามขอบกรอบที่ตรึงไว้และระดับราคาปิดแท่ง Breakout
🔹 อ่านเครื่องหมายผลประเมินร่วมกับ Dashboard
🔹 เปรียบเทียบประสิทธิภาพและระยะคืนกลับโดยใช้ค่าตั้งเดียวกัน
🔹 ใช้ประกอบการอ่านแนวโน้มและโครงสร้างราคา
ผลล่าสุดจะคงอยู่จนเริ่มเหตุการณ์ใหม่ จึงเป็น ผลของเหตุการณ์ที่ผ่านมา ไม่ใช่สัญญาณใหม่ทุกแท่ง
⏺️ Dashboard and default settings
Dashboard:
🔹 Event status and direction
🔹 Closed bars observed after the breakout
🔹 Net progress and cumulative close movement
🔹 Directional Efficiency
🔹 Giveback
🔹 Quality Score
Defaults:
🔹 Prior Range — 20 bars
🔹 Observation Window — 5 bars after the breakout
🔹 Minimum Efficiency — 60%
🔹 Maximum Giveback — 30%
Use a standard OHLC or candlestick chart.
⏺️ Dashboard และค่าเริ่มต้น
Dashboard แสดง:
🔹 สถานะและทิศทางเหตุการณ์
🔹 จำนวนแท่งปิดที่ติดตามหลัง Breakout
🔹 ระยะเดินหน้าสุทธิและระยะเคลื่อนไหวสะสม
🔹 Directional Efficiency
🔹 Giveback
🔹 Quality Score
ค่าเริ่มต้น:
🔹 Prior Range — 20 แท่ง
🔹 Observation Window — 5 แท่งหลัง Breakout
🔹 Minimum Efficiency — 60%
🔹 Maximum Giveback — 30%
ใช้กับกราฟ OHLC หรือแท่งเทียนมาตรฐาน
⏺️ Alerts
🔹 Quality up escape
🔹 Quality down escape
🔹 Weak escape
🔹 Returned across boundary
🔹 Any completed event
Alerts occur on the closed bar that completes an event. This version does not apply an additional two-bar confirmation.
Select “Once Per Bar Close” and recreate alerts after changing inputs or code.
⏺️ การแจ้งเตือน
🔹 Quality up escape — เหตุการณ์ขาขึ้นผ่านเกณฑ์คุณภาพ
🔹 Quality down escape — เหตุการณ์ขาลงผ่านเกณฑ์คุณภาพ
🔹 Weak escape — ยังอยู่นอกกรอบ แต่ไม่ผ่านเกณฑ์
🔹 Returned across boundary — กลับถึงหรือข้ามขอบ Breakout เดิม
🔹 Any completed event — แจ้งทุกประเภทเมื่อจบเหตุการณ์
แจ้งเตือนเมื่อแท่งที่จบเหตุการณ์ปิด เวอร์ชันนี้ไม่มีการรอยืนยันเพิ่มอีกสองแท่ง
ตั้ง “Once Per Bar Close” และสร้าง Alert ใหม่หลังเปลี่ยน Input หรือโค้ด
⏺️ Development and references
This Pine Script v6 implementation combines a Donchian-style prior-price range, directional efficiency inspired by Perry Kaufman’s Efficiency Ratio, and event-based retracement measurement.
The extension measures movement within a frozen post-breakout event and adjusts efficiency for lost progress.
No Community script code was copied for this implementation. The underlying channel, efficiency and retracement concepts are established methods; no claim is made that those concepts are new.
References:
🔹 TradingView — Donchian Channels
tradingview.com/support/solutions/43000502253-donchian-channels-dc/
🔹 TradingView — Kaufman’s Adaptive Moving Average, including Efficiency Ratio
tradingview.com/support/solutions/43000773012-kaufman-s-adaptive-moving-average-kama/
⏺️ การพัฒนาและอ้างอิง
เขียนด้วย Pine Script v6 โดยผสมกรอบราคาแบบ Donchian หลักการประสิทธิภาพการเคลื่อนที่ที่ต่อยอดจาก Efficiency Ratio ของ Perry Kaufman และการวัดระยะคืนกลับเฉพาะเหตุการณ์
ส่วนที่ต่อยอดคือการตรึงกรอบเมื่อเกิด Breakout วัดการเคลื่อนที่ในช่วงติดตาม และหักคะแนนตามระยะเดินหน้าที่สูญเสียไป
ไม่คัดลอกโค้ดจากสคริปต์ Community สำหรับการพัฒนาครั้งนี้ แนวคิดกรอบราคา ประสิทธิภาพ และการคืนระยะเป็นหลักการที่มีอยู่แล้ว ไม่ได้อ้างว่าเป็นสิ่งประดิษฐ์ใหม่ทั้งหมด
⏺️ Limitations and disclaimer
🔹 Measurements use closing prices and exclude intrabar excursions.
🔹 The breakout jump itself is excluded from the measured path.
🔹 Results depend on the selected range, observation window and thresholds.
🔹 Strong classification describes the completed window and does not predict subsequent continuation.
🔹 Session gaps, continuous-futures rolls and data revisions can affect results.
🔹 Numerical checks have been completed; TradingView compilation and market-data validation remain pending.
🔹 For educational and informational purposes only. No investment advice or return guarantee is provided.
⏺️ ข้อจำกัดและคำชี้แจง
🔹 วัดจากราคาปิด จึงไม่สะท้อนการแกว่งทั้งหมดภายในแท่ง
🔹 ไม่รวมระยะกระโดดของแท่ง Breakout ในเส้นทางที่ใช้ประเมิน
🔹 ผลขึ้นกับจำนวนแท่งของกรอบ ช่วงติดตาม และเกณฑ์ที่เลือก
🔹 การผ่านเกณฑ์บรรยายช่วงที่ประเมินเสร็จ ไม่ได้ทำนายว่าจะเดินหน้าต่อ
🔹 Gap ระหว่าง Session การเปลี่ยนสัญญาในกราฟ Continuous และการแก้ไขข้อมูลอาจกระทบผล
🔹 ตรวจสูตรเชิงตัวเลขแล้ว แต่ยังไม่ได้ compile ใน TradingView หรือทดสอบข้อมูลตลาดจริง
🔹 ใช้เพื่อการศึกษาและประกอบการวิเคราะห์ ไม่ใช่คำแนะนำการลงทุนหรือการรับประกันผลตอบแทน
[DAOL] Range Escape Quality evaluates price movement after a confirmed breakout from a prior high–low range.
It combines directional efficiency and retracement to distinguish efficient follow-through from movement that stays outside the range but makes little progress.
🔹 Frozen Range — the prior range captured at the breakout
🔹 Directional Efficiency — forward progress relative to cumulative close-to-close movement
🔹 Giveback — how much of the best post-breakout progress has been lost
🔹 Quality Score — efficiency adjusted for giveback, ranging from 0 to 100
The score describes observed price movement. It is not a win probability or an automatic trading recommendation.
⏺️ Indicator นี้คืออะไร?
[DAOL] Range Escape Quality ประเมิน คุณภาพการเดินหน้าของราคาหลังปิดหลุดกรอบ โดยดูทั้งประสิทธิภาพการเคลื่อนที่และระยะที่คืนกลับ
ช่วยแยกระหว่าง “หลุดแล้วเดินหน้าต่อ” กับ “ยังอยู่นอกกรอบ แต่แกว่งมากและคืบหน้าน้อย”
🔹 Frozen Range — กรอบราคาเดิมที่ตรึงไว้เมื่อเกิด Breakout
🔹 Directional Efficiency — ระยะเดินหน้าสุทธิเทียบกับระยะเคลื่อนไหวสะสมของราคาปิด
🔹 Giveback — สัดส่วนระยะที่คืนกลับจากจุดที่เดินหน้าได้ไกลที่สุด
🔹 Quality Score — คะแนนประสิทธิภาพหลังหักการคืนระยะ อยู่ระหว่าง 0–100
คะแนนใช้บรรยายการเคลื่อนไหวที่เกิดขึ้น ไม่ใช่เปอร์เซ็นต์โอกาสชนะหรือคำแนะนำซื้อขายโดยอัตโนมัติ
⏺️ Why use it?
🔹 Evaluates follow-through after a breakout
🔹 Distinguishes directional progress from repeated back-and-forth movement
🔹 Keeps the original range fixed during each event
🔹 Measures how much progress remains after retracement
🔹 Provides a consistent observation window for comparing events
⏺️ ทำไมต้องใช้?
🔹 อ่านคุณภาพการเคลื่อนที่หลัง Breakout
🔹 แยกการเดินหน้าตามทิศทางออกจากการแกว่งไปมา
🔹 ตรึงกรอบเดิมตลอดเหตุการณ์ เพื่อให้ระดับอ้างอิงคงที่
🔹 ดูว่าราคายังรักษาระยะที่เดินหน้าไว้ได้มากแค่ไหน
🔹 ใช้ช่วงติดตามที่กำหนดชัดเจนเพื่อเปรียบเทียบแต่ละเหตุการณ์
⏺️ How does it work?
Build a range from the highs and lows of the preceding 20 bars, excluding the current bar.
Start an event when the current bar closes outside that range and the preceding close is within the same range.
Freeze the range boundaries and use the breakout close as the measurement origin.
Observe the next 5 closed bars by default.
Finish early if a close reaches or crosses back over the frozen breakout boundary.
Otherwise, classify the event when the observation window ends.
Only one event is tracked at a time. A new event cannot begin on the same bar that the previous event ends.
⏺️ ทำงานอย่างไร?
สร้างกรอบจากราคาสูงสุด–ต่ำสุดของ 20 แท่งก่อนหน้า โดยไม่รวมแท่งปัจจุบัน
เริ่มเหตุการณ์เมื่อราคาปิดหลุดกรอบ และราคาปิดแท่งก่อนหน้ายังอยู่ในกรอบเดียวกัน
ตรึงขอบกรอบ และใช้ราคาปิดแท่ง Breakout เป็นจุดเริ่มวัด
ติดตาม 5 แท่งปิดถัดไปตามค่าเริ่มต้น
จบก่อนกำหนดหากราคาปิดกลับถึงหรือข้ามขอบ Breakout เดิม
หากยังอยู่นอกกรอบ ให้ประเมินผลเมื่อครบช่วงติดตาม
ระบบติดตามครั้งละหนึ่งเหตุการณ์ และไม่เริ่มเหตุการณ์ใหม่ในแท่งเดียวกับที่เหตุการณ์เดิมจบ
ไม่นับแท่ง Breakout เป็นหนึ่งใน 5 แท่งติดตาม
⏺️ How is the score calculated?
Directional Efficiency compares positive net progress in the breakout direction with the sum of absolute close-to-close changes after the breakout close.
Giveback measures the fraction of peak forward progress that has been surrendered.
Quality Score = Directional Efficiency × (1 − Giveback / 100)
Example:
🔹 Cumulative close movement = 10 points
🔹 Net forward progress = 2 points
🔹 Directional Efficiency = 20%
🔹 Peak forward progress = 4 points
🔹 Giveback = 50%
🔹 Quality Score = 10
If price makes no positive forward progress, giveback is defined as 100%. If it returns across the breakout boundary, the final score is set to zero.
⏺️ คำนวณคะแนนอย่างไร?
Directional Efficiency เปรียบเทียบระยะเดินหน้าสุทธิในทิศทาง Breakout กับผลรวมระยะเปลี่ยนแปลงของราคาปิดหลังแท่ง Breakout โดยไม่นับระยะถอยเป็นความคืบหน้าบวก
Giveback วัดว่าราคาคืนระยะจากจุดที่เดินหน้าได้ไกลที่สุดไปแล้วกี่ส่วน
Quality Score = Directional Efficiency × (1 − Giveback / 100)
ตัวอย่าง:
🔹 ราคาปิดเคลื่อนที่สะสม 10 จุด
🔹 เดินหน้าสุทธิ 2 จุด
🔹 Directional Efficiency = 20%
🔹 เคยเดินหน้าได้ไกลที่สุด 4 จุด
🔹 Giveback = 50%
🔹 Quality Score = 10
หากไม่เคยเดินหน้าเป็นบวก กำหนด Giveback เป็น 100% หากราคาปิดกลับถึงหรือข้ามขอบ Breakout เดิม คะแนนสุดท้ายจะเป็นศูนย์
ระยะคืนกลับวัดจาก ราคาปิดแท่ง Breakout และจุดสุดขั้วของราคาปิดหลังจากนั้น ไม่ได้วัดจากไส้เทียน
⏺️ How to read the colors
🔹 Blue — an event is being tracked
🔹 Green — completed upward event meeting the quality thresholds
🔹 Red — completed downward event meeting the quality thresholds
🔹 Gold — completed event remaining outside the range with weak follow-through
🔹 Gray — returned across the breakout boundary, or no completed result
Default quality requirements:
🔹 Positive net progress in the breakout direction
🔹 Directional Efficiency ≥ 60%
🔹 Giveback ≤ 30%
Color classification uses these individual conditions, rather than a single Quality Score threshold.
⏺️ อ่านสีอย่างไร?
🔹 น้ำเงิน — กำลังติดตามเหตุการณ์
🔹 เขียว — Breakout ขึ้นที่ประเมินเสร็จและผ่านเกณฑ์คุณภาพ
🔹 แดง — Breakout ลงที่ประเมินเสร็จและผ่านเกณฑ์คุณภาพ
🔹 ทอง — ครบช่วงติดตามแล้วยังอยู่นอกกรอบ แต่การเดินหน้าไม่ผ่านเกณฑ์
🔹 เทา — ราคากลับถึงหรือข้ามขอบ Breakout เดิม หรือยังไม่มีผลประเมิน
เกณฑ์คุณภาพตามค่าเริ่มต้น:
🔹 เดินหน้าสุทธิในทิศทาง Breakout เป็นบวก
🔹 Directional Efficiency ≥ 60%
🔹 Giveback ≤ 30%
สีพิจารณาจากเงื่อนไขเหล่านี้แยกกัน ไม่ได้ใช้เกณฑ์คะแนนรวมเพียงตัวเดียว
สีแดงหมายถึงการเดินหน้าลงที่ผ่านเกณฑ์ ไม่ได้หมายถึงสัญญาณผิดพลาด
⏺️ How to use it
🔹 Watch the blue start marker to identify a new tracked event
🔹 Follow the frozen boundaries and breakout-close reference
🔹 Read the completed marker together with the dashboard
🔹 Compare efficiency and giveback across events using consistent settings
🔹 Combine the result with broader trend and price-structure analysis
The latest completed result remains visible until another event begins. It is a retained historical result, not a new signal on every subsequent bar.
⏺️ วิธีใช้งาน
🔹 ดูเครื่องหมาย Start สีน้ำเงินเพื่อระบุจุดเริ่มเหตุการณ์
🔹 ติดตามขอบกรอบที่ตรึงไว้และระดับราคาปิดแท่ง Breakout
🔹 อ่านเครื่องหมายผลประเมินร่วมกับ Dashboard
🔹 เปรียบเทียบประสิทธิภาพและระยะคืนกลับโดยใช้ค่าตั้งเดียวกัน
🔹 ใช้ประกอบการอ่านแนวโน้มและโครงสร้างราคา
ผลล่าสุดจะคงอยู่จนเริ่มเหตุการณ์ใหม่ จึงเป็น ผลของเหตุการณ์ที่ผ่านมา ไม่ใช่สัญญาณใหม่ทุกแท่ง
⏺️ Dashboard and default settings
Dashboard:
🔹 Event status and direction
🔹 Closed bars observed after the breakout
🔹 Net progress and cumulative close movement
🔹 Directional Efficiency
🔹 Giveback
🔹 Quality Score
Defaults:
🔹 Prior Range — 20 bars
🔹 Observation Window — 5 bars after the breakout
🔹 Minimum Efficiency — 60%
🔹 Maximum Giveback — 30%
Use a standard OHLC or candlestick chart.
⏺️ Dashboard และค่าเริ่มต้น
Dashboard แสดง:
🔹 สถานะและทิศทางเหตุการณ์
🔹 จำนวนแท่งปิดที่ติดตามหลัง Breakout
🔹 ระยะเดินหน้าสุทธิและระยะเคลื่อนไหวสะสม
🔹 Directional Efficiency
🔹 Giveback
🔹 Quality Score
ค่าเริ่มต้น:
🔹 Prior Range — 20 แท่ง
🔹 Observation Window — 5 แท่งหลัง Breakout
🔹 Minimum Efficiency — 60%
🔹 Maximum Giveback — 30%
ใช้กับกราฟ OHLC หรือแท่งเทียนมาตรฐาน
⏺️ Alerts
🔹 Quality up escape
🔹 Quality down escape
🔹 Weak escape
🔹 Returned across boundary
🔹 Any completed event
Alerts occur on the closed bar that completes an event. This version does not apply an additional two-bar confirmation.
Select “Once Per Bar Close” and recreate alerts after changing inputs or code.
⏺️ การแจ้งเตือน
🔹 Quality up escape — เหตุการณ์ขาขึ้นผ่านเกณฑ์คุณภาพ
🔹 Quality down escape — เหตุการณ์ขาลงผ่านเกณฑ์คุณภาพ
🔹 Weak escape — ยังอยู่นอกกรอบ แต่ไม่ผ่านเกณฑ์
🔹 Returned across boundary — กลับถึงหรือข้ามขอบ Breakout เดิม
🔹 Any completed event — แจ้งทุกประเภทเมื่อจบเหตุการณ์
แจ้งเตือนเมื่อแท่งที่จบเหตุการณ์ปิด เวอร์ชันนี้ไม่มีการรอยืนยันเพิ่มอีกสองแท่ง
ตั้ง “Once Per Bar Close” และสร้าง Alert ใหม่หลังเปลี่ยน Input หรือโค้ด
⏺️ Development and references
This Pine Script v6 implementation combines a Donchian-style prior-price range, directional efficiency inspired by Perry Kaufman’s Efficiency Ratio, and event-based retracement measurement.
The extension measures movement within a frozen post-breakout event and adjusts efficiency for lost progress.
No Community script code was copied for this implementation. The underlying channel, efficiency and retracement concepts are established methods; no claim is made that those concepts are new.
References:
🔹 TradingView — Donchian Channels
tradingview.com/support/solutions/43000502253-donchian-channels-dc/
🔹 TradingView — Kaufman’s Adaptive Moving Average, including Efficiency Ratio
tradingview.com/support/solutions/43000773012-kaufman-s-adaptive-moving-average-kama/
⏺️ การพัฒนาและอ้างอิง
เขียนด้วย Pine Script v6 โดยผสมกรอบราคาแบบ Donchian หลักการประสิทธิภาพการเคลื่อนที่ที่ต่อยอดจาก Efficiency Ratio ของ Perry Kaufman และการวัดระยะคืนกลับเฉพาะเหตุการณ์
ส่วนที่ต่อยอดคือการตรึงกรอบเมื่อเกิด Breakout วัดการเคลื่อนที่ในช่วงติดตาม และหักคะแนนตามระยะเดินหน้าที่สูญเสียไป
ไม่คัดลอกโค้ดจากสคริปต์ Community สำหรับการพัฒนาครั้งนี้ แนวคิดกรอบราคา ประสิทธิภาพ และการคืนระยะเป็นหลักการที่มีอยู่แล้ว ไม่ได้อ้างว่าเป็นสิ่งประดิษฐ์ใหม่ทั้งหมด
⏺️ Limitations and disclaimer
🔹 Measurements use closing prices and exclude intrabar excursions.
🔹 The breakout jump itself is excluded from the measured path.
🔹 Results depend on the selected range, observation window and thresholds.
🔹 Strong classification describes the completed window and does not predict subsequent continuation.
🔹 Session gaps, continuous-futures rolls and data revisions can affect results.
🔹 Numerical checks have been completed; TradingView compilation and market-data validation remain pending.
🔹 For educational and informational purposes only. No investment advice or return guarantee is provided.
⏺️ ข้อจำกัดและคำชี้แจง
🔹 วัดจากราคาปิด จึงไม่สะท้อนการแกว่งทั้งหมดภายในแท่ง
🔹 ไม่รวมระยะกระโดดของแท่ง Breakout ในเส้นทางที่ใช้ประเมิน
🔹 ผลขึ้นกับจำนวนแท่งของกรอบ ช่วงติดตาม และเกณฑ์ที่เลือก
🔹 การผ่านเกณฑ์บรรยายช่วงที่ประเมินเสร็จ ไม่ได้ทำนายว่าจะเดินหน้าต่อ
🔹 Gap ระหว่าง Session การเปลี่ยนสัญญาในกราฟ Continuous และการแก้ไขข้อมูลอาจกระทบผล
🔹 ตรวจสูตรเชิงตัวเลขแล้ว แต่ยังไม่ได้ compile ใน TradingView หรือทดสอบข้อมูลตลาดจริง
🔹 ใช้เพื่อการศึกษาและประกอบการวิเคราะห์ ไม่ใช่คำแนะนำการลงทุนหรือการรับประกันผลตอบแทน

Clause de non-responsabilité
Les informations et publications ne sont pas destinées à être, et ne constituent pas, des conseils ou recommandations financiers, d'investissement, de trading ou autres fournis ou approuvés par TradingView. Pour en savoir plus, consultez les Conditions d'utilisation.
Clause de non-responsabilité
Les informations et publications ne sont pas destinées à être, et ne constituent pas, des conseils ou recommandations financiers, d'investissement, de trading ou autres fournis ou approuvés par TradingView. Pour en savoir plus, consultez les Conditions d'utilisation.