Range Expansion Radar
🎯 Range Expansion Radar
💡 Breaking a range is not what matters. The quality of the breakout is.
Not every range is the same size, and not every candle that breaks a range has the same strength or quality. A breakout from a tight 1% range is a completely different event from a breakout of a 10% range, and a weak candle that barely closes beyond a level is not the same as a decisive expansion.
Range Expansion Radar is built around this idea. It doesn’t just tell you that a range broke. It shows you how big the range was and how far price expanded beyond it, so you can compare breakouts objectively instead of guessing.
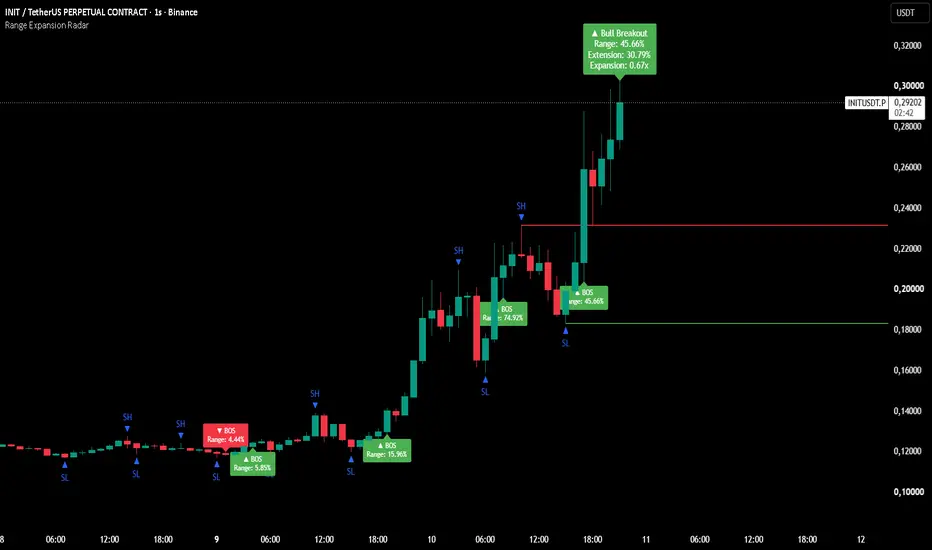
🔍 What It Does
🔺 Swing Detection: marks swing highs (SH) and swing lows (SL) with pivot logic.
📏 Active Range Lines: draws the latest swing high (🔴 red) and swing low (🟢 green) as extended lines.
💥 BOS Labels: prints a Break of Structure label when price closes outside the range, including the Range % that was broken.
📡 Live Expansion Tracker: after a breakout, it tracks the maximum move in the breakout direction in real time.
🧮 How It’s Calculated
1️⃣ Swing Points: Your chosen left/right bars.
2️⃣ Range %:
|Swing High − Swing Low| / min(Swing High, Swing Low) × 100
3️⃣ Bullish Breakout 🟢: close crosses above the latest swing high.
4️⃣ Bearish Breakout 🔴: close crosses below the latest swing low.
5️⃣ One Breakout per Level 🔒: each swing level can trigger only once, so the same range is never counted repeatedly.
6️⃣ Extension %: the maximum move beyond the broken level.
📈 Bull: (Highest High − Broken Level) / Broken Level × 100
📉 Bear: (Broken Level − Lowest Low) / Broken Level × 100
7️⃣ Expansion (x): Extension % / Range %
👉 Example: 2.0x means price has moved twice the height of the range it just broke.
🛠️ How To Use It
✅ Judge breakout quality: compare the Range % across BOS labels. Tight ranges and wide ranges behave differently.
✅ Measure follow-through: watch the Expansion multiple to learn how far breakouts typically run on your market and timeframe.
✅ Build realistic targets: study past BOS events and plan around 1x, 2x, 3x of the range.
✅ Filter weak breakouts: a breakout that barely expands (low x) is a different trade than one that explodes (high x).
✅ Tune sensitivity:
⬆️ Higher swing bars → fewer, more significant ranges (swing trading, higher timeframes)
⬇️ Lower swing bars → more sensitive ranges (scalping, lower timeframes)
⚙️ Settings
🔢 Swing Left / Right Bars: pivot sensitivity
🔺 Show Swing Points: toggle SH/SL markers
📏 Show Active Range Lines: toggle extended range lines
💥 Show Breakout Labels: toggle BOS labels
📡 Show Live Breakout Move: toggle the live Extension/Expansion label
⚠️ Notes
⏳ Swing points are confirmed with a delay equal to the right-bar setting, which is inherent to pivot logic.
🔄 The live label updates on the last bar, so values change while the candle is open.
📚 This tool is for analysis and educational purposes only. It is not financial advice and does not guarantee future results. Always use proper risk management.
💡 Breaking a range is not what matters. The quality of the breakout is.
Not every range is the same size, and not every candle that breaks a range has the same strength or quality. A breakout from a tight 1% range is a completely different event from a breakout of a 10% range, and a weak candle that barely closes beyond a level is not the same as a decisive expansion.
Range Expansion Radar is built around this idea. It doesn’t just tell you that a range broke. It shows you how big the range was and how far price expanded beyond it, so you can compare breakouts objectively instead of guessing.
🔍 What It Does
🔺 Swing Detection: marks swing highs (SH) and swing lows (SL) with pivot logic.
📏 Active Range Lines: draws the latest swing high (🔴 red) and swing low (🟢 green) as extended lines.
💥 BOS Labels: prints a Break of Structure label when price closes outside the range, including the Range % that was broken.
📡 Live Expansion Tracker: after a breakout, it tracks the maximum move in the breakout direction in real time.
🧮 How It’s Calculated
1️⃣ Swing Points: Your chosen left/right bars.
2️⃣ Range %:
|Swing High − Swing Low| / min(Swing High, Swing Low) × 100
3️⃣ Bullish Breakout 🟢: close crosses above the latest swing high.
4️⃣ Bearish Breakout 🔴: close crosses below the latest swing low.
5️⃣ One Breakout per Level 🔒: each swing level can trigger only once, so the same range is never counted repeatedly.
6️⃣ Extension %: the maximum move beyond the broken level.
📈 Bull: (Highest High − Broken Level) / Broken Level × 100
📉 Bear: (Broken Level − Lowest Low) / Broken Level × 100
7️⃣ Expansion (x): Extension % / Range %
👉 Example: 2.0x means price has moved twice the height of the range it just broke.
🛠️ How To Use It
✅ Judge breakout quality: compare the Range % across BOS labels. Tight ranges and wide ranges behave differently.
✅ Measure follow-through: watch the Expansion multiple to learn how far breakouts typically run on your market and timeframe.
✅ Build realistic targets: study past BOS events and plan around 1x, 2x, 3x of the range.
✅ Filter weak breakouts: a breakout that barely expands (low x) is a different trade than one that explodes (high x).
✅ Tune sensitivity:
⬆️ Higher swing bars → fewer, more significant ranges (swing trading, higher timeframes)
⬇️ Lower swing bars → more sensitive ranges (scalping, lower timeframes)
⚙️ Settings
🔢 Swing Left / Right Bars: pivot sensitivity
🔺 Show Swing Points: toggle SH/SL markers
📏 Show Active Range Lines: toggle extended range lines
💥 Show Breakout Labels: toggle BOS labels
📡 Show Live Breakout Move: toggle the live Extension/Expansion label
⚠️ Notes
⏳ Swing points are confirmed with a delay equal to the right-bar setting, which is inherent to pivot logic.
🔄 The live label updates on the last bar, so values change while the candle is open.
📚 This tool is for analysis and educational purposes only. It is not financial advice and does not guarantee future results. Always use proper risk management.

For help and support, feel free to contact:
wa.me/905469061306
wa.me/905469061306
Clause de non-responsabilité
Les informations et publications ne sont pas destinées à être, et ne constituent pas, des conseils ou recommandations financiers, d'investissement, de trading ou autres fournis ou approuvés par TradingView. Pour en savoir plus, consultez les Conditions d'utilisation.
For help and support, feel free to contact:
wa.me/905469061306
wa.me/905469061306
Clause de non-responsabilité
Les informations et publications ne sont pas destinées à être, et ne constituent pas, des conseils ou recommandations financiers, d'investissement, de trading ou autres fournis ou approuvés par TradingView. Pour en savoir plus, consultez les Conditions d'utilisation.