Mochipoyo MACD Divergence [TV]
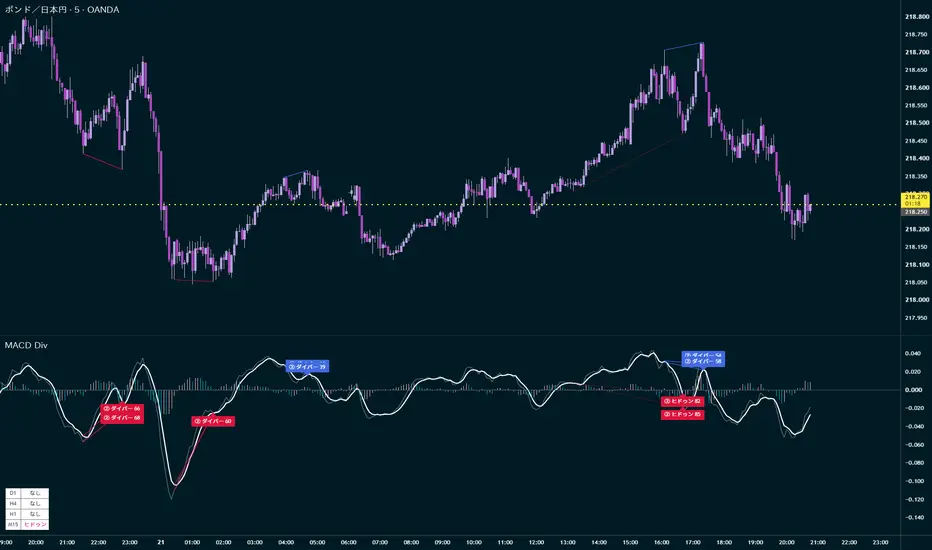
Motty MACD Divergence is an invite-only indicator designed to organize regular and hidden MACD divergence information for discretionary chart analysis.
The script uses a configurable ZigZag-style swing detection process based on Depth, Deviation, and Backstep settings. It compares accepted price swing highs and lows with the corresponding values of the MACD main line and signal line.
When the configured conditions are satisfied, the script displays lines, points, and labels representing the detected divergence structure.
This indicator does not place orders, manage positions, or provide guaranteed entry or exit instructions. Its purpose is to reduce repetitive manual comparison between price swings and MACD behavior and to present the information in a consistent visual format.
DETECTED DIVERGENCE STRUCTURES
The script can identify four divergence structures:
1. Bearish Regular Divergence
Price forms a higher high while the selected MACD series forms a lower high.
This structure can indicate weakening bullish momentum, but it does not guarantee a bearish reversal.
2. Bearish Hidden Divergence
Price forms a lower high while the selected MACD series forms a higher high.
This structure can be used as one factor when evaluating possible continuation of a downward trend.
3. Bullish Regular Divergence
Price forms a lower low while the selected MACD series forms a higher low.
This structure can indicate weakening bearish momentum, but it does not guarantee a bullish reversal.
4. Bullish Hidden Divergence
Price forms a higher low while the selected MACD series forms a lower low.
This structure can be used as one factor when evaluating possible continuation of an upward trend.
Only swing points accepted by the configured ZigZag-style engine are evaluated. Changing Depth, Deviation, Backstep, MACD, RCI, or score settings can change which structures are detected.
MAIN FEATURES
• Regular bullish and bearish divergence detection
• Hidden bullish and bearish divergence detection
• Separate detection using the MACD main line and signal line
• Configurable MACD periods and applied price
• SMA signal smoothing for MT5-style behavior or EMA signal smoothing for standard TradingView-style behavior
• Configurable ZigZag-style Depth, Deviation, and Backstep settings
• Optional RCI filter for restricting high-side structures to the selected upper zone and low-side structures to the selected lower zone
• Optional three-pivot divergence detection, displayed with an “×3” label
• Optional strength score from 0 to 100
• Configurable minimum score filter
• Divergence lines in the MACD pane
• Optional divergence lines on the price chart
• Four-timeframe divergence status panel
• Optional second detection engine using separate ZigZag and MACD settings
• Provisional and structurally confirmed alert modes
• Optional structure-break checkmark
• Simplified historical directional summary
WHY THIS SCRIPT IS DIFFERENT
MACD and divergence are established analytical concepts and are available in many public indicators.
This script is not intended to add value by merely plotting a standard MACD. Its purpose is to combine several related analytical processes into one configurable workflow:
• Swing detection using configurable price-structure settings
• Classification of regular and hidden divergences
• Independent evaluation of the MACD main and signal lines
• Optional RCI-based filtering
• Recognition of continuing three-pivot divergence structures
• Rule-based strength scoring
• Multi-timeframe status display
• A second detection engine with independent parameters
• Price-chart and oscillator-pane visualization
• Provisional and structural-confirmation alert options
These functions are integrated so that users can review divergence candidates without repeatedly comparing every price swing and MACD movement manually.
The exact proprietary implementation and thresholds are protected. However, the underlying principle is based on comparing accepted price pivots with the corresponding MACD main-line or signal-line values.
MACD CALCULATION
The MACD main line is calculated as the difference between the selected fast and slow exponential moving averages.
Users can choose between:
• SMA signal smoothing, intended to approximate the MT5 iMACD signal-line convention
• EMA signal smoothing, consistent with the standard TradingView MACD convention
The default MACD settings are 6, 13, and 4, but all periods can be changed by the user.
RCI FILTER
The optional RCI filter evaluates the RCI value at the newer pivot.
For a high-side divergence candidate, the RCI must be at or above the selected upper threshold.
For a low-side divergence candidate, the RCI must be at or below the selected lower threshold.
The default RCI settings are a period of 9, an upper threshold of 80, and a lower threshold of -80.
The RCI filter reduces the number of displayed candidates but does not validate or guarantee the future price direction.
THREE-PIVOT DIVERGENCE
When enabled, the script checks whether the same divergence relationship continues across three consecutive accepted pivots.
If the relationship is present between both pairs of pivots, the label includes “×3,” and an additional line is drawn between the older two points.
An “×3” label describes the detected three-pivot structure. It is not a probability, performance rating, or guarantee that the market will reverse or continue.
STRENGTH SCORE
The optional strength score assigns a value from 0 to 100 to each detected structure.
The score combines rule-based factors including:
• Price separation relative to ATR
• MACD separation relative to recent MACD variability
• Number of bars between pivots
• Swing range relative to ATR
• Position of the compared MACD values relative to the zero line
• Agreement between the MACD main and signal lines
• Higher-timeframe EMA direction
• Current-timeframe EMA structure
• RCI position and direction
The score is an analytical classification value only.
It does not represent:
• The probability of a reversal
• The probability of trend continuation
• Expected return
• Win rate
• Risk-to-reward ratio
• Future profitability
Users can set a minimum score. Structures below the selected threshold are excluded from display, alerts, and the simplified statistics calculation.
SIGNAL STATES AND REPAINTING BEHAVIOR
The script handles divergence structures in two stages:
1. Provisional
2. Structurally confirmed
PROVISIONAL SIGNALS
When the latest swing high or swing low satisfies the configured divergence conditions, the script can display a provisional label and provisional lines.
The latest swing is not yet fixed.
If price extends the same swing by making a higher high or a lower low, the provisional objects can:
• Move to a newer bar
• Be deleted and redrawn
• Change divergence type
• Change score
• Lose the three-pivot classification
• Disappear when the conditions are no longer satisfied
Provisional signals can therefore repaint.
The default notification setting in the current version is “Provisional — Immediate.” An alert generated with this mode can refer to a structure that later moves, changes, or disappears.
STRUCTURALLY CONFIRMED SIGNALS
A provisional high-side structure becomes structurally confirmed when the script subsequently detects an accepted low pivot.
A provisional low-side structure becomes structurally confirmed when the script subsequently detects an accepted high pivot.
At structural confirmation, the script changes the applicable objects from their provisional colors to their confirmed colors.
In the current version, structural confirmation is not necessarily the same as confirmation at the candle close.
An opposite pivot condition can be detected while the realtime bar is still developing. Therefore, the setting named “Confirmed Only” refers to confirmation by the script’s swing structure, not necessarily to end-of-bar confirmation.
Because realtime calculations and developing higher-timeframe values can differ from historical bar calculations, some results may appear differently after the script or chart is reloaded.
For these reasons, this indicator must not be described as fully non-repainting.
ALERTS
The script provides two alert timing modes:
• Provisional — Immediate
• Structurally Confirmed Only
Users can also enable or disable alerts independently for:
• High regular divergence
• High hidden divergence
• Low regular divergence
• Low hidden divergence
To use the alerts, add the indicator to a chart and create a TradingView alert using:
“Any alert() function call”
The selected symbol, timeframe, and script settings are stored when the alert is created. After changing indicator settings or updating the script, the existing alert should be deleted and created again.
The current script uses a once-per-realtime-bar alert frequency. If multiple eligible events occur on the same realtime bar, only the first permitted alert event for that bar may be delivered.
MULTI-TIMEFRAME STATUS PANEL
The multi-timeframe panel displays recent regular or hidden divergence status for four configurable timeframes.
The panel applies the main engine’s ZigZag, MACD, selected-line, and RCI-filter settings to each selected timeframe.
A result is shown only when the detected pivot is within the configured search-bar range.
The panel is intended to organize timeframe information. A displayed result is not an independent trading signal.
Data from a currently developing higher-timeframe candle can change until that candle closes. The panel can therefore change during realtime calculation and can appear differently after reloading the script.
SECOND DETECTION ENGINE
The optional second engine runs another divergence calculation using independent ZigZag and MACD settings.
Signals generated by the second engine include a “②” prefix.
The second engine can help compare a shorter swing structure with a broader swing structure in the same indicator.
The following functions apply only to the first engine:
• Multi-timeframe status panel
• Simplified historical directional summary
• Structure-break checkmark
STRUCTURE-BREAK CHECKMARK
After a first-engine signal becomes structurally confirmed, the script can monitor the most recent confirmed structure.
When the tracked structure level is broken by a confirmed closing price, a checkmark can be added to the applicable label.
The checkmark is a record of the defined structural-break condition. It is not an entry instruction and does not guarantee continuation in the break direction.
SIMPLIFIED HISTORICAL DIRECTIONAL SUMMARY
The optional statistics table is a simplified historical directional summary. It is not a strategy backtest.
When a first-engine signal becomes structurally confirmed, the script records the closing price at the confirmation point.
After the configured number of bars, it compares the later closing price with the recorded closing price and checks whether the net movement was in the direction associated with the detected structure.
The percentage displayed by the table should be interpreted only as a historical directional match rate under this simplified calculation.
It is not an expected trading win rate.
The calculation does not account for:
• Actual entry execution
• Intrabar movement
• Spread
• Commission
• Slippage
• Stop-loss rules
• Take-profit rules
• Maximum adverse excursion
• Maximum favorable excursion
• Position sizing
• Liquidity
• Financing costs
• Taxes
• Risk-to-reward ratio
The displayed “pips” value uses a script-specific conversion based on the symbol’s minimum tick. It may not correspond to the conventional pip definition for every asset class or data provider.
Results also depend on the chart’s loaded historical range and the selected settings.
HOW TO USE THE INDICATOR
The indicator is designed as one component of a broader discretionary analysis process.
Users should consider additional information such as:
• Higher-timeframe trend and structure
• Support and resistance
• Swing-high and swing-low progression
• Moving-average direction
• Volatility
• Market session
• Liquidity
• Scheduled economic releases
• Unexpected news events
• Stop-loss placement
• Position sizing
• Maximum acceptable loss
For example, a bullish regular divergence near an established higher-timeframe support area can provide different analytical context from the same divergence appearing in the middle of an undefined range.
Likewise, bearish divergence during a strong upward trend does not mean that price must immediately reverse.
A divergence label should not be used as the sole reason to enter or exit a position.
MARKETS AND TIMEFRAMES
The script can be applied to symbols available on TradingView, including:
• Foreign exchange
• Stocks
• Stock indices
• Commodities
• Futures
• Cryptocurrencies
Detection frequency and behavior vary according to:
• Symbol
• Timeframe
• Volatility
• Liquidity
• Trading session
• Exchange
• Broker
• Data provider
• Chart history
• User settings
Shorter timeframes generally contain more noise and can produce more frequent changes in provisional pivots.
Higher timeframes generally produce fewer structures, but confirmation can require more time.
Users should evaluate the indicator on the specific symbols, timeframes, and data sources they intend to analyze.
LIMITATIONS
• A divergence does not guarantee a reversal.
• A hidden divergence does not guarantee trend continuation.
• Strong trends can continue after multiple divergence structures appear.
• Provisional labels and lines can move, change, or disappear.
• Structural confirmation can be delayed because an opposite pivot must form.
• Structural confirmation is not necessarily candle-close confirmation in the current version.
• Developing higher-timeframe data can change until the higher-timeframe candle closes.
• Different data providers can produce different pivots and labels.
• The strength score is not a probability or performance forecast.
• The statistics table is not a backtest or verified trading record.
• Historical labels do not represent executable trades.
• The script does not determine the correct stop loss, position size, leverage, or acceptable risk.
• No technical indicator can predict future market movement with certainty.
RISK NOTICE
This indicator is an analytical tool for discretionary chart review.
It does not provide financial advice, investment advice, personalized recommendations, or guaranteed trading signals.
Trading and investing involve substantial risk, including the possible loss of capital. Leveraged products can produce losses greater than the amount initially allocated to a position.
Users are solely responsible for their own analysis, execution decisions, position sizing, risk management, and compliance with applicable laws and regulations.
Past chart behavior and historical calculations do not guarantee future results.
日本語説明
概要
Motty MACD Divergenceは、通常ダイバージェンスとヒドゥンダイバージェンスの候補を、TradingView上で整理して表示する招待専用インジケーターです。
Depth、Deviation、Backstepを使用したZigZag型の波形検出を行い、価格の高値・安値と、対応するMACDメインラインまたはシグナルラインの値を比較します。
条件を満たした場合、MACD画面と価格チャート上にライン、ポイント、ラベルを表示します。
本インジケーターは自動売買を行わず、売買や利益を保証するものではありません。
検出する種類
• 高値ダイバー:価格が高値を切り上げ、MACDが高値を切り下げる構造
• 高値ヒドゥン:価格が高値を切り下げ、MACDが高値を切り上げる構造
• 安値ダイバー:価格が安値を切り下げ、MACDが安値を切り上げる構造
• 安値ヒドゥン:価格が安値を切り上げ、MACDが安値を切り下げる構造
設定されたZigZag型エンジンで有効と判定されたピボットのみを比較します。
主な機能
• 通常・ヒドゥンダイバージェンスの分類
• MACDメインラインとシグナルラインの個別判定
• MACD期間、適用価格、シグナル平滑化の変更
• RCI複合フィルター
• 3点ダイバージェンスの「×3」表示
• 0~100点の強度スコア
• 最低スコアフィルター
• 価格チャート上へのダイバージェンスライン表示
• 4つの時間足を確認するMTFパネル
• 別設定で同時検出するエンジン2
• 未確定・構造確定の通知
• 構造ブレイク時のチェックマーク
• 簡易的な過去方向一致集計
強度スコア
強度スコアは、価格差、MACD差、ピボット間隔、ATR、MACDメイン・シグナルの一致、上位足のEMA方向、現在足のEMA構造、RCIなどを組み合わせた独自の条件評価です。
スコアは、方向一致率、反転確率、継続確率、期待収益または将来の利益を示すものではありません。
サインの確定とリペイント
本インジケーターには「未確定」と「構造上の確定」の2段階があります。
最新の高値または安値を基準とする未確定サインは、価格が同じ方向へ更新された場合に、移動、削除、再描画、種類変更、スコア変更または消失する可能性があります。
そのため、未確定サインはリペイントする可能性があります。
高値側の未確定サインは、その後に有効な安値ピボットを検出した時点で構造上の確定となります。
安値側の未確定サインは、その後に有効な高値ピボットを検出した時点で構造上の確定となります。
現在のバージョンでは、構造上の確定は必ずしもローソク足の終値確定と同じではありません。形成中のリアルタイムバーで反対側ピボットの条件を満たす場合があります。
形成途中の上位時間足データも使用するため、上位足確定前にスコアやMTF表示が変化したり、再読み込み後に表示差が生じたりする可能性があります。
したがって、本インジケーターは完全ノンリペイントではありません。
通知
通知タイミングは次の2種類です。
• 未確定(即時)
• 確定時のみ
現在の初期設定は「未確定(即時)」です。
この設定では、通知後に対象サインが移動、変更または消失する可能性があります。
TradingViewで通知を作成する際は、条件から「Any alert() function call」を選択してください。
同じリアルタイムバーで複数の通知条件が成立した場合、現在の通知頻度設定により、最初の対象通知だけが送信される場合があります。
複数時間足パネル
MTFパネルには、指定した4つの時間足について、設定された検索本数以内の最新ダイバーまたはヒドゥンの状態を表示します。
表示内容は売買サインではありません。
形成途中の上位時間足を参照する場合、対象時間足のローソク足が確定するまで表示が変わる可能性があります。
エンジン2
エンジン2を有効にすると、異なるZigZag設定とMACD設定を使用した2つ目の検出を同時に実行できます。
エンジン2のラベルには「②」が表示されます。
MTFパネル、簡易検証テーブル、構造ブレイクチェックはエンジン1のみが対象です。
簡易検証テーブル
簡易検証テーブルは売買戦略のバックテストではありません。
構造上のサイン確定時の終値と、設定した本数後の終値を比較し、サインが示す方向と一致した回数を簡易的に集計します。
スプレッド、手数料、スリッページ、損切り、利益確定、途中の値動き、ポジションサイズ、流動性などは考慮していません。
表示される割合は将来の方向一致率を示すものではありません。
「pips」の値は最小ティックを基準としたスクリプト独自の換算値であり、すべての市場で一般的なpipsの定義と一致するとは限りません。
利用上の注意
ダイバージェンスだけで売買を決定せず、上位時間足の方向、サポート・レジスタンス、相場構造、ボラティリティ、経済指標、損切り、ポジションサイズなどと組み合わせて判断してください。
通常ダイバージェンスは反転を保証しません。
ヒドゥンダイバージェンスはトレンド継続を保証しません。
強いトレンドでは、複数のダイバージェンスが表示されたあとも価格が同じ方向へ進み続ける場合があります。
リスクについて
本インジケーターは裁量によるチャート分析を補助するツールです。
投資助言、個別の売買推奨または利益を保証する売買シグナルではありません。
FX、株式、指数、商品、先物、暗号資産などの取引には、元本を失うリスクがあります。
実際の取引は利用者自身の判断と責任で行い、適切な損切りと資金管理を実施してください。
過去の値動きや過去データによる計算結果は、将来の結果を保証するものではありません。
Script sur invitation seulement
Seuls les utilisateurs approuvés par l'auteur peuvent accéder à ce script. Vous devrez demander et obtenir la permission de l'utiliser. Celle-ci est généralement accordée après paiement. Pour plus de détails, suivez les instructions de l'auteur ci-dessous ou contactez directement mochipoyo_fxtrader.
TradingView ne recommande PAS d'acheter ou d'utiliser un script à moins que vous ne fassiez entièrement confiance à son auteur et que vous compreniez son fonctionnement. Vous pouvez également trouver des alternatives gratuites et open source dans nos scripts communautaires.
Instructions de l'auteur

mochipoyo-trading.com/
【使用しているトレード方法など】
lit.link/mochipoyo
【X】
mobile.twitter.com/mochi_fxtrader
【YOUTUBE】
youtube.com/channel/UC0jNEDGSBcLnfQ8PDhkuYtA/
Clause de non-responsabilité
Script sur invitation seulement
Seuls les utilisateurs approuvés par l'auteur peuvent accéder à ce script. Vous devrez demander et obtenir la permission de l'utiliser. Celle-ci est généralement accordée après paiement. Pour plus de détails, suivez les instructions de l'auteur ci-dessous ou contactez directement mochipoyo_fxtrader.
TradingView ne recommande PAS d'acheter ou d'utiliser un script à moins que vous ne fassiez entièrement confiance à son auteur et que vous compreniez son fonctionnement. Vous pouvez également trouver des alternatives gratuites et open source dans nos scripts communautaires.
Instructions de l'auteur
mochipoyo-trading.com/
【使用しているトレード方法など】
lit.link/mochipoyo
【X】
mobile.twitter.com/mochi_fxtrader
【YOUTUBE】
youtube.com/channel/UC0jNEDGSBcLnfQ8PDhkuYtA/