Indicateur

Session Highlighter & Fractals
Session Highlighter & Fractals
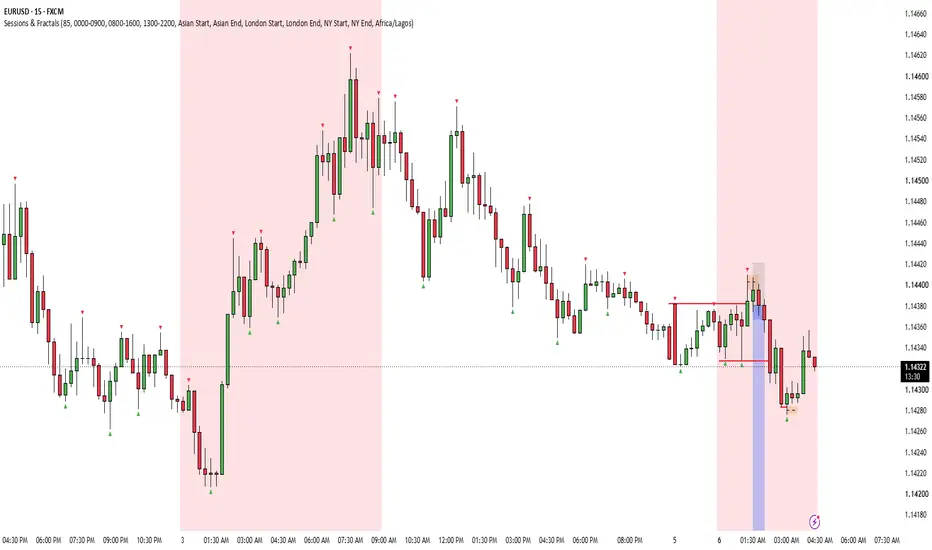
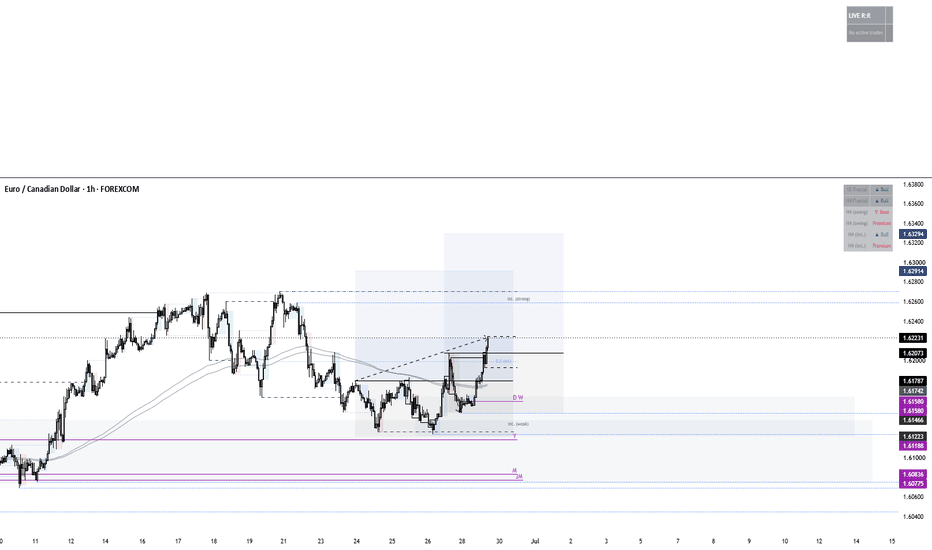
A clean session-tracking tool built for intraday traders who want to see exactly where price sits relative to the Asian, London, and New York sessions — combined with Williams Fractal swing points for structure reference.
Features:
Three independently configurable sessions (Asian, London, New York) — each with its own time window, on/off toggle, and color
Background highlighting for the full duration of each active session, with an adjustable transparency slider so the shading never overwhelms your price action
Start/End labels on every session transition — fully customizable text (defaults to "Asian Start", "Asian End", etc.) so you can rename them to match your own trading vocabulary
Timezone control — a dropdown of standard timezones so session boundaries align exactly with whatever timezone your chart is displaying, rather than relying on the exchange's default timezone
Williams Fractals — classic 5-bar swing high/low detection, plotted directly on the chart with green/red triangle markers
Built-in alerts for both bullish and bearish fractal prints, so you can get notified the moment a new swing point forms without watching the chart
How to use it:
Set your chart's timezone (bottom-right clock icon), then match that same timezone in the indicator's settings so session windows line up correctly. Adjust each session's start/end time if you trade a custom window rather than the standard session hours. Toggle labels on or off depending on whether you want a cleaner chart or explicit markers at every transition.
This script is intended as a visual and structural reference tool — it does not generate buy/sell signals and should be combined with your own strategy, risk management, and market analysis. Indicateur

Indicateur

Stratégie

Indicateur

Indicateur

Indicateur
Indicateur

Indicateur

Indicateur
Indicateur

EMA Ribbon FLOW PRO# EMA Ribbon FLOW PRO
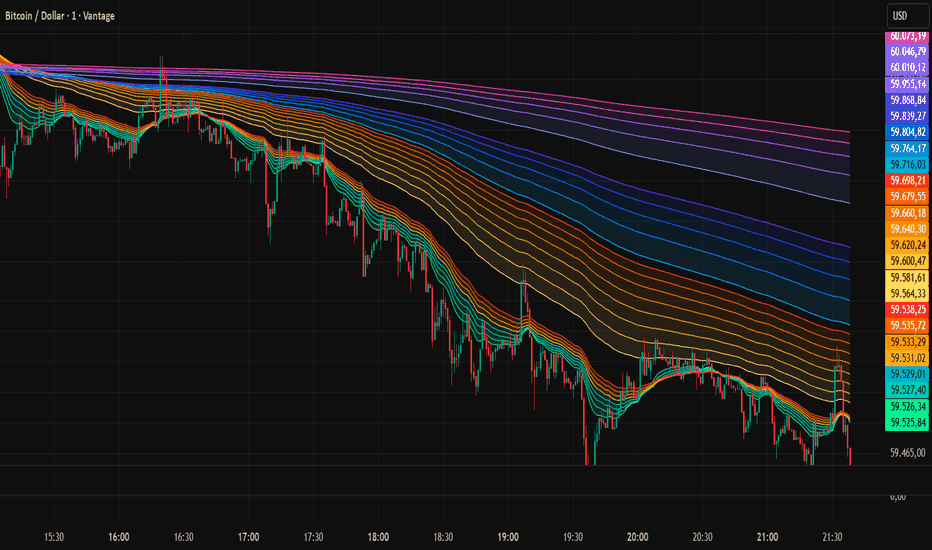
EMA Ribbon FLOW PRO is a multi-layer exponential moving average (EMA) ribbon designed to visualize market structure, trend direction, dynamic support/resistance, and momentum across different trading horizons.
Instead of using only one or two moving averages, the indicator combines several EMA ribbons into one clean visual layout. Each ribbon represents a different trend layer, allowing traders to quickly identify short-, medium-, and long-term market direction.
## Included EMA Ribbons
* **M1 Ribbon:** EMA 20–55
* **M5 Ribbon:** EMA 100–275
* **x15 Ribbon:** EMA 300–600
* **H1 Ribbon:** EMA 900–2100
Each ribbon uses its own color gradient, making it easy to distinguish between different market structures.
---
# How to Trade with EMA Ribbon FLOW PRO
The indicator can be used in many different ways depending on your trading style.
### Trend Identification
When all ribbons are aligned and pointing in the same direction, the market is usually trending.
* Rising ribbons → Bullish trend
* Falling ribbons → Bearish trend
The wider the ribbon becomes, the stronger the trend generally is.
---
### Dynamic Support and Resistance
The EMA ribbons often act as dynamic support and resistance zones.
Common approaches include:
* Buying pullbacks into bullish ribbons
* Selling pullbacks into bearish ribbons
* Watching for reactions when price touches an EMA cluster
Instead of focusing on a single moving average, traders can use the entire ribbon as an area of interest.
---
### Momentum
Ribbon expansion usually indicates increasing momentum.
Ribbon compression often signals:
* slowing momentum
* consolidation
* possible trend transitions
This allows traders to recognize changing market conditions before large moves develop.
---
### Multiple Trend Layers
The different ribbons help separate short-term market noise from the larger trend.
For example:
* M1 ribbon for short-term entries
* M5 ribbon for trend confirmation
* x15 ribbon for higher timeframe bias
* H1 ribbon for the overall market direction
Using multiple EMA groups together helps traders avoid trading against stronger trends.
---
# Fully Customizable
EMA Ribbon FLOW PRO was designed to be highly customizable.
You can:
* Show or hide every ribbon independently.
* Display only the EMA groups that fit your trading style.
* Customize line colors.
* Change ribbon fill colors.
* Disable fill colors completely.
* Adjust line width.
* Use your preferred price source.
Whether you prefer a clean chart with only a few EMAs or a complete multi-ribbon layout, the indicator can easily be adapted to your workflow.
---
# Suitable For
* Scalping
* Day Trading
* Swing Trading
* Crypto
* Forex
* Indices
* Stocks
* Commodities
The indicator works on every timeframe, although it is especially useful for traders who combine lower timeframe entries with higher timeframe trend confirmation.
---
# Disclaimer
EMA Ribbon FLOW PRO is a market structure and trend analysis tool. It does not predict future price movements and should be used together with proper risk management and your own trading strategy.
Indicateur
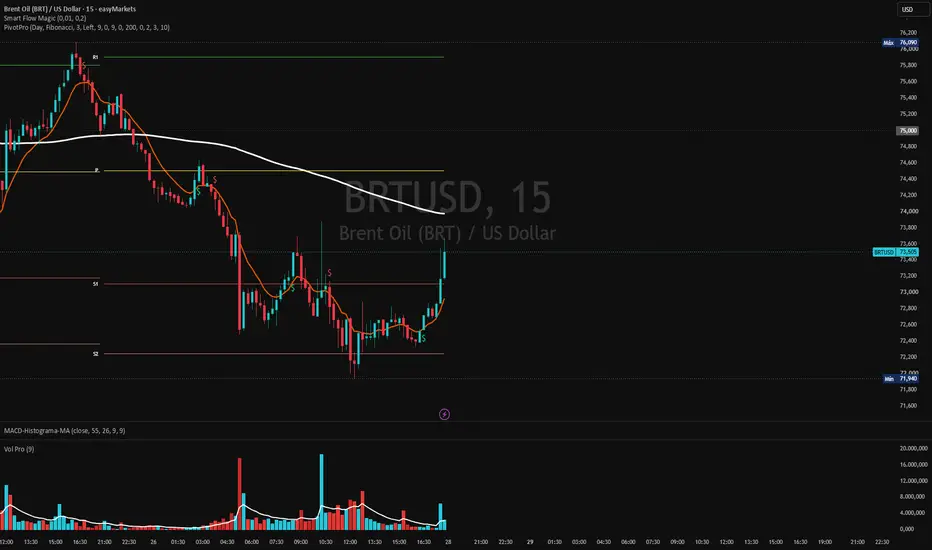
Pivot Premium Suite Nicolau EditionPivotPro Nicolau — Pivot Points + SuperTrend + EMA with the “Displacement” option
A professional all-in-one indicator combining three powerful technical
analysis tools into a single, clean, and highly configurable solution.
━━━━━━━━━━━━━━━━━━━━━━━━━━━━
📊 1. ADVANCED PIVOT POINTS
━━━━━━━━━━━━━━━━━━━━━━━━━━━━
Calculates and displays Pivot Points with full customization:
- Two calculation methods: Traditional and Fibonacci
- Configurable timeframe: Daily, Weekly, Monthly or Yearly
- Choose how many periods to display (current + previous)
- Labels positioned on Left or Right side of each line
- Individual color control for each level (P, R1, R2, R3, S1, S2, S3)
- Labels follow the line edge automatically — no overlap
- Alerts for price crossing any pivot level
━━━━━━━━━━━━━━━━━━━━━━━━━━━━
📈 2. PIVOT POINT SUPERTREND
━━━━━━━━━━━━━━━━━━━━━━━━━━━━
A unique SuperTrend implementation that uses Pivot Highs and Lows
as its center line instead of the traditional midpoint — making it
more reactive to actual market structure:
- ATR-based dynamic bands calculated from pivot-weighted center
- Buy/Sell signals rendered as plotshape (independent from labels)
- Optional Support/Resistance circles from pivot points
- Optional center line display
- Alerts for trend changes and Buy/Sell signals
━━━━━━━━━━━━━━━━━━━━━━━━━━━━
📉 3. EMA SUITE WITH SHIFT
━━━━━━━━━━━━━━━━━━━━━━━━━━━━
Three fully configurable Exponential Moving Averages with an
exclusive displacement feature:
- EMA 9, EMA 21, EMA 200 — all periods configurable
- Individual color for each EMA
- Each EMA has its own shift toggle and period input
- Positive shift = forward displacement (future projection)
- Negative shift = backward displacement (historical alignment)
- Visual crossover marker between EMA 9 and EMA 21
━━━━━━━━━━━━━━━━━━━━━━━━━━━━
⚙️ KEY FEATURES
━━━━━━━━━━━━━━━━━━━━━━━━━━━━
- Pivot numbers stay visible even when chart objects are hidden
- Buy/Sell labels are independent from Pivot labels
- All colors individually configurable
- Clean, non-overlapping label system
- Full alert support for all signals
Designed for traders who need precision, clarity and full control
over their chart without visual clutter.
Indicateur

Indicateur

Pivot Points Original RecreationPivot Points Original Recreation is a technical analysis indicator designed to identify potential pivot highs and pivot lows directly on the price chart.
The indicator highlights important swing points where price may have formed a temporary top or bottom. These pivot levels can help traders analyze market structure, trend direction, support and resistance zones, and possible reversal or continuation areas.
Main features:
- Detects pivot highs and pivot lows
- Displays clear PH and PL labels on the chart
- Helps identify swing structure and key turning points
- Useful for support and resistance analysis
- Can assist with trend continuation and reversal setups
- Works across forex, gold, indices, crypto, stocks, and other liquid markets
This indicator is intended for technical analysis and educational purposes only. It does not provide guaranteed buy or sell signals and should not be used as a standalone trading system. Traders should combine it with proper risk management, market structure analysis, and their own trading strategy. Indicateur

Indicateur
Indicateur

Stratégie

Indicateur
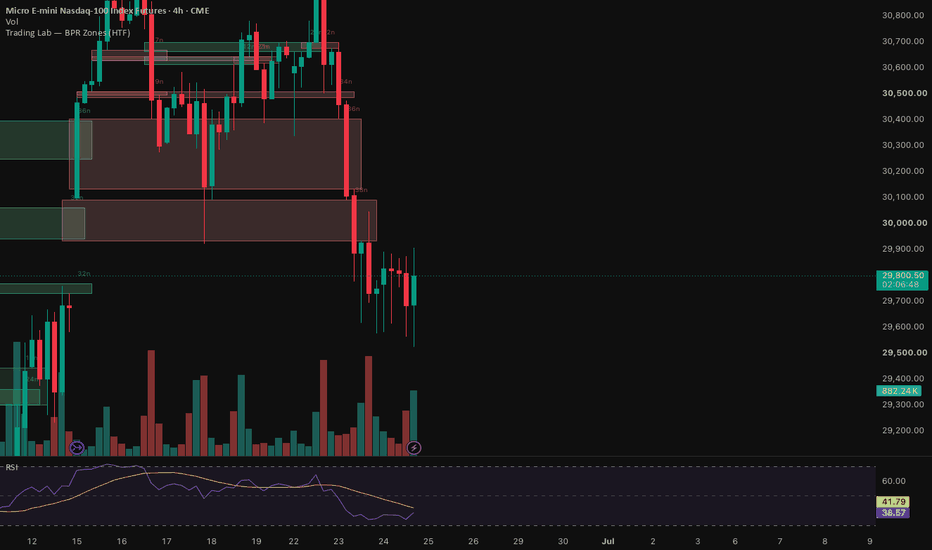
VWAP Acceptance Flow PRO
VWAP Acceptance Flow PRO
VWAP Acceptance Flow PRO is a multi-timeframe flow oscillator designed to measure market acceptance around a rolling VWAP. Instead of tracking price alone, the indicator evaluates whether the market is accepting or rejecting value and combines this information into a clean flow model optimized for fast-moving markets such as NASDAQ.
The indicator provides a real-time view of short-term flow, higher-timeframe alignment, momentum shifts, pullbacks, and re-acceptance signals.
CORE CONCEPT
Markets constantly move between two states:
• Acceptance → price is accepted above or below fair value.
• Rejection → price fails to hold value and rotates back.
VWAP Acceptance Flow PRO quantifies this process by combining:
1. Distance from VWAP
2. Velocity of VWAP displacement
3. Acceptance duration
4. VWAP slope
The result is a normalized flow engine that visualizes whether buyers or sellers are gaining control.
COMPONENTS
Chart Flow
The fastest flow line.
Measures current market pressure and reacts quickly to shifts in acceptance.
• Above zero = bullish acceptance
• Below zero = bearish acceptance
• Rising = increasing momentum
• Falling = weakening momentum
X5 Flow
Intermediate flow filter.
Represents the dominant short-term trend and helps remove noise from the Chart Flow.
• Above zero = bullish environment
• Below zero = bearish environment
X15 Flow
Institutional flow filter.
Represents the broader market bias.
This is the slowest and most stable component of the system.
• Positive = higher-timeframe buyers in control
• Negative = higher-timeframe sellers in control
ACCEPTANCE HISTOGRAM
The histogram displays:
Chart Flow − X5 Flow
This measures short-term acceleration relative to the dominant trend.
Green Histogram
• Bullish acceleration
• Momentum expanding
• Buyers gaining control
Red Histogram
• Bearish acceleration
• Momentum weakening
• Sellers gaining control
DYNAMIC ACCEPTANCE BANDS
The upper and lower bands are calculated from the average absolute flow value.
They adapt automatically to market volatility.
Inside Bands
• Normal market activity
Outside Bands
• Extreme acceptance conditions
• Trend extension
• Potential exhaustion
• Possible mean reversion
PULLBACK RADAR
The background highlights pullback opportunities inside strong trends.
Yellow Background
Bullish pullback.
Conditions:
• X15 Flow > 0
• X5 Flow > 0
• Chart Flow < 0
The larger trend remains bullish while short-term flow temporarily weakens.
Purple Background
Bearish pullback.
Conditions:
• X15 Flow < 0
• X5 Flow < 0
• Chart Flow > 0
The larger trend remains bearish while short-term flow temporarily rebounds.
RE-ACCEPTANCE SIGNALS
Signals occur when Chart Flow crosses X5 Flow.
Long Signal
Condition:
• Chart Flow crosses above X5 Flow
Interpretation:
Short-term acceptance is returning in favor of buyers.
Short Signal
Condition:
• Chart Flow crosses below X5 Flow
Interpretation:
Short-term acceptance is returning in favor of sellers.
These signals are designed to identify re-entry opportunities after pullbacks and consolidations.
FLOW SCORE
The Flow Score measures directional alignment across all three flow layers.
Range: -3 to +3
+3
• Strong bullish alignment
• All flow lines above zero
+2
• Bullish bias
+1
• Weak bullish bias
0
• Neutral market
-1
• Weak bearish bias
-2
• Bearish bias
-3
• Strong bearish alignment
• All flow lines below zero
ACCEPTANCE SCORE
The Acceptance Score measures the overall strength of market participation.
Range: 0–100
Low Values
• Weak conviction
• Choppy conditions
• Poor acceptance
High Values
• Strong conviction
• Trend continuation environment
• High-quality directional movement
The Acceptance Score can be used as a confidence filter for trade selection.
TRADING IDEAS
Trend Following
Look for:
• X15 Flow above zero
• X5 Flow above zero
• Flow Score = +2 or +3
Use bullish pullbacks and long re-acceptance signals as entry opportunities.
Short Selling
Look for:
• X15 Flow below zero
• X5 Flow below zero
• Flow Score = -2 or -3
Use bearish pullbacks and short re-acceptance signals as entry opportunities.
Momentum Expansion
Strong momentum often occurs when:
• Histogram expands rapidly
• Acceptance Score rises
• Flow Score reaches extreme alignment
This combination frequently appears during trend continuation phases.
BEST MARKETS
• NASDAQ
• Index Futures
• High-Volume Stocks
• ETFs
• Cryptocurrency Markets
Recommended Timeframes:
• 1 Minute
• 2 Minute
• 5 Minute
• 15 Minute
SUMMARY
VWAP Acceptance Flow PRO transforms VWAP behavior into a complete market-flow model. By combining acceptance, momentum, trend alignment, pullback detection, and re-acceptance signals, it helps traders identify when markets are building conviction and when higher-probability trend opportunities are emerging. Indicateur

Elliott Wave AnalysisElliott Wave Analysis Indicator for TradingView
A comprehensive Pine Script indicator that helps identify and label Elliott Wave patterns with full customization.
Features:
Wave Patterns (toggle on/off)
Impulse Waves (1-2-3-4-5)
Corrections (A-B-C)
Flats (3-3-5 structure)
Zigzags (5-3-5 structure)
Triangles, Flags, Wedges (a-b-c-d-e)
Wave Degrees (15 hierarchical levels - toggle individually)
Supermillennium → Miniscule
Proper numbering for each degree (Roman numerals, Arabic numerals, circled numbers, etc.)
Technical Tools
Trend Channels: Auto-detects and draws upper/lower channels
Fibonacci Retracement: 0%, 23.6%, 38.2%, 50%, 61.8%, 78.6%, 100%
Fibonacci Extension: 127.2%, 161.8%, 200%, 261.8%
Visual Design
White color only (no distractions)
Clean, professional appearance
Fully optional inputs—show only what you need
How It Works:
Customize via indicator settings to toggle wave patterns, degrees, channels, and Fibonacci levels on/off. Adapt the indicator to match your Elliott Wave analysis timeframe and trading style. Indicateur

Indicateur
[Viprasol] Real Relative StrengthOverview
This indicator is based on the open-source "Real Relative Strength" (RRS) concept, which measures how an asset is performing against a benchmark after normalising for volatility. The original plots ATR-normalised relative momentum versus a benchmark (e.g. SPY) with zero-cross arrows and strong/weak zones. This version keeps that calculation and adds RRS/price divergence detection, a second-benchmark agreement filter, a signal cooldown, an RRS acceleration read, and a compact dashboard.
How It Works
Real Relative Strength (from original concept):
Relative momentum = (asset momentum − benchmark momentum) / average ATR × multiplier, where momentum is close − close for both the asset and the benchmark, and the divisor is the average of the asset and benchmark ATR. The result is smoothed with an EMA. Positive = the asset is outperforming the benchmark on a volatility-adjusted basis; negative = underperforming. Strong/weak zones mark RRS beyond a configurable level.
Divergence (new):
Using pivots on the smoothed RRS, a bearish divergence is flagged when RRS makes a lower pivot high while price makes a higher high; bullish when RRS makes a higher pivot low while price makes a lower low.
Second-Benchmark Agreement (new):
Optionally compute RRS against a second benchmark and only confirm a zero-cross when both agree in sign — a confluence filter against single-benchmark noise.
Signal Cooldown (new):
A minimum bar gap between confirmed zero-cross signals to prevent clustering.
RRS Acceleration (new):
The bar-to-bar change in smoothed RRS, shown as a rising/falling momentum read in the dashboard.
What Is Original (Viprasol Additions)
1. RRS/price divergence detection (regular bullish and bearish).
2. Optional second-benchmark agreement filter on zero-cross signals.
3. Signal cooldown.
4. RRS acceleration (momentum-of-RRS) state.
5. Compact relative-strength dashboard.
Key Features
From the Original:
- ATR-normalised relative strength vs a benchmark
- EMA smoothing, zero-cross arrows, strong/weak zones, extreme background tint
Added in This Version (Viprasol):
- Divergence detection, dual-benchmark agreement, cooldown, acceleration read, dashboard
- Six alerts with dynamic {{ticker}}/{{close}}/{{interval}} messages
How to Use
1. Set the benchmark to match your asset class (SPY/QQQ stocks, IWM small-caps, BTCUSD crypto).
2. Above zero (aqua/green area) = outperforming; below zero (red area) = underperforming.
3. Zero-cross arrows mark fresh shifts; circles mark divergences; the strong/weak zones flag standout strength.
Recommended Starting Points:
- Intraday (15m-1H): Length 10-14
- Swing (Daily/4H): Length 14-20
- Use dual-benchmark agreement for higher-conviction crosses
These are starting points only — backtest and adjust before trading live.
Settings
Core: benchmark symbol, momentum length, ATR multiplier, RRS smoothing.
Confluence & Filters: 2nd-benchmark agreement (+ symbol), signal cooldown, strong/weak zone level.
Divergence: detect divergence toggle, pivot length.
Visuals: zero-cross arrows, RRS line, RRS area.
Dashboard: toggle and position.
Alerts
1. Bullish Cross — now outperforming the benchmark
2. Bearish Cross — now underperforming the benchmark
3. Strong Outperformance — RRS beyond the strong level
4. Strong Underperformance — RRS below the weak level
5. Bullish Divergence — RRS/price bullish divergence
6. Bearish Divergence — RRS/price bearish divergence
All alerts include {{ticker}}, {{close}}, and {{interval}}.
Limitations & Disclaimer
- RRS uses request.security for the benchmark; benchmark data quality and session alignment affect readings, especially across asset classes/exchanges.
- Divergence uses confirmed pivots, which lag by the pivot length.
- Relative strength shows leadership, not absolute direction — a rising RRS in a falling market only means the asset is falling less.
- Past performance does not guarantee future results. This indicator is for educational purposes only and is not financial advice. Always use proper risk management and test on historical data before trading live.
Credits & Attribution
Based on the open-source "Real Relative Strength" concept (community / SMB-style), which provided the ATR-normalised relative-momentum calculation, EMA smoothing, zero-cross signals, and strong/weak zones. Added by Viprasol: RRS/price divergence detection, optional second-benchmark agreement, signal cooldown, RRS acceleration, and the dashboard.
Published open-source per TradingView House Rules.
Indicateur