Indicateur

Indicateur

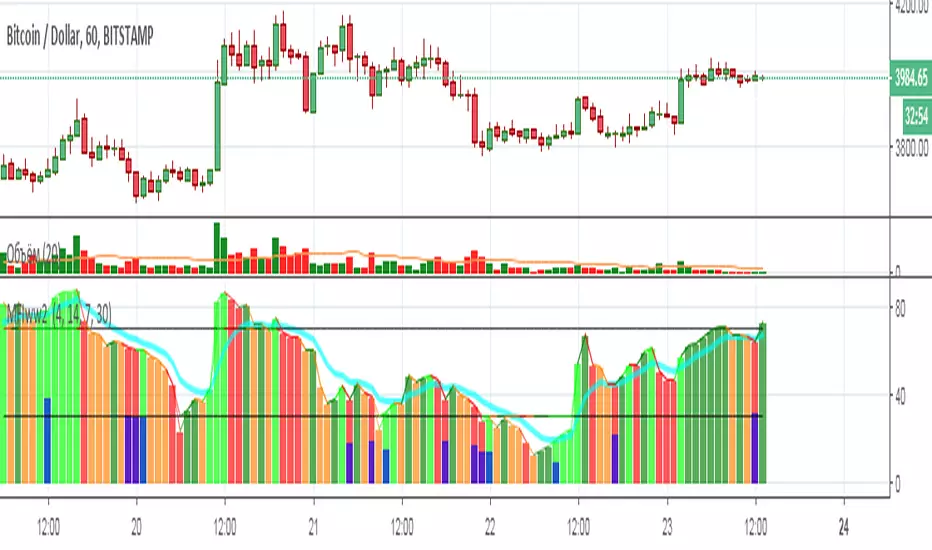
Market Facilitation Index - MFIUsing Market Facilitation Index - MFI you will be able to recognise two important metrics:
Whether the current trend is strong enough to trade it.
When a new trend may start.
MFI combines changes in price (range) and volume. Here is the formula:
MFI = (High – Low) * Volume
The indicator has bars of four colours. Each colour has a specific meaning and shows how the market responds to a change in volume.
Green. A green bar forms in the situation that both MFI and the volume are up. It means that more and more traders join the market in the current direction. In other words, it points to a strong trend, so you can open trades in line with this trend.
Brown. A brown bar appears when both MFI and the volume decline. It is also called “fade”. It signals that traders are hesitating and don’t want to continue the trend anymore. As a result, it’s not recommended to join the trend. Several brown bars are a sign of the potential reversal of the trend.
Blue. A blue bar forms when MFI increases, but the volume declines. A spike in price may be short-lived a precede a change in the trend. Blue bars appear at the times when newbies enter the trend, but professional traders know that it’s already too dangerous.
Pink. A pink bar, also known as squat, appears when MFI is diminishing, but the volume is growing. It reflects an increase of trading interest and an active fight between buyers and sellers. After one of the sides wins, the price will likely make a big move breaking support or resistance levels. The MFI, however, can’t be used to determine the direction of the breakout. Indicateur

Indicateur

Indicateur

Indicateur

Indicateur

Indicateur

Indicateur

Indicateur

Indicateur
Indicateur

Indicateur

Indicateur

Godmode 4.0.0 [Oscillator]First off, a huge thank you to the following people:
LEGION:
LazyBear: www.tradingview.com
xSilas: www.tradingview.com
Ni6HTH4awK: www.tradingview.com
sco77m4r7and:
SNOW_CITY: www.tradingview.com
oh92: www.tradingview.com
alexgrover: www.tradingview.com
cI8DH: www.tradingview.com
DonovanWall: www.tradingview.com
Since I've been on TradingView I've become somewhat enthralled by Godmode and the collective work that goes in to it, so I decided to publish my own iteration, building off the ideas already present. (This is a great way to get familiar with Pine by the way, just in case there are any beginners reading this)
Changes
The first change I made was to allow the user to select whatever tickerid they wanted as a benchmark. If trading XBTUSD on BitMEX for example, the indicator will react to exchange-specific activity, which means it will respond to all the little whipsaws, whipsaws that can be especially present on a futures exchange. By typing CRYPTOCAP:BTC or CRYPTOCAP:TOTAL we endeavor to remove noise. It can also signal earlier. Less noise and less lag. Another idea would be to choose a benchmark that has a strong inverse relationship with the asset you're trading: try CRYPTOCAP:USDT as the benchmark against BTC to see what I mean.
I also added the ability to smooth the plot, yet again removing noise but adding considerable lag.
The linear regression of the wave-trend is calculated in place of the EMA. This is plotted as columns with the midline (50) as the base. This is just calculating the slope of the wave-trend and can signal a weakening trend before a reversal takes place.
Using cI8DH's True RSI script () as inspiration, I added a function for calculating the True TSI in an attempt to remove any bullish bias. Funnily enough, when I tried to do the same with the RSI I had some problems. I'll try to resolve this in the coming weeks.
Made slight changes to the aesthetics. Tried to bring the two main plots alive by making their bold, opaque colors stand off the subtle tones in the background.
To Do List
1. I would like to sort out the issue with the True RSI.
2. When the plots are smoothed, there's an issue with the green 'Caution!' dots appearing in the lower half of the indicator.
3. I'd like to adjust the code so that if the 'Benchmark' box is empty, that it will automatically register the current tickerid as the 'Benchmark'.
If anyone has any suggestions on other fixes or how to apply the fixes mentioned by me, please don't hesitate to reach out to me here or through other media platforms.
Want to Learn?
If you'd like the opportunity to learn Pine but you have difficulty finding resources to guide you, take a look at this rudimentary list: docs.google.com
The list will be updated in the future as more people share the resources that have helped, or continue to help, them. Follow me on Twitter to keep up-to-date with the growing list of resources.
Suggestions or Questions?
Don't even kinda hesitate to forward them to me. My (metaphorical) door is always open.
BITMEX:XBTUSD
CRYPTOCAP:BTC
CRYPTOCAP:TOTAL
CRYPTOCAP:USDT.D Indicateur

Indicateur

Indicateur

Indicateur
Indicateur

Indicateur
Indicateur

Indicateur

Indicateur