Indicateur

Indicateur

Indicateur

Indicateur

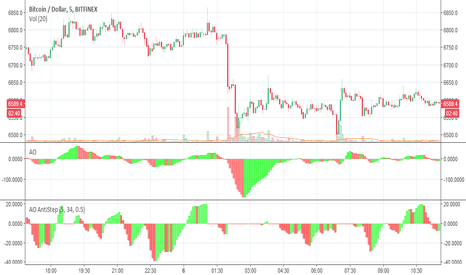
Awesome Oscillator with AntiStep CorrectionHere is the well-known Awesome Oscillator (AO), which I use to present the real purpose of this post: a function that provides step correction for simple moving averages (SMAs).
We all know that any indicator based on moving averages lags real-time movement. Normally this is fine, but just after large ("step") changes in level, the pre-step values that are still within the SMA window cause the result to falsely reflect continued movement, even when real-time values remain flat.
To counter this, when a step change of a configurable size is detected, I temporarily shrink the SMA window size to include only those values occurring since the step change, and then allow the size to increase to normal length as we move away from the step change. This is accomplished within the antistep_sma() function.
Note that this will cause SMAs of different lengths (e.g. those used in the AO) to be temporarily equal, until the shorter of the two reaches its normal size and begins to leave the longer one behind again. You can see this above, where the AO, which is the difference of two SMAs, goes to 0 immediately after a sufficiently large step change--configured to 0.5% in this case. Indicateur
Indicateur

Indicateur

Indicateur

Indicateur
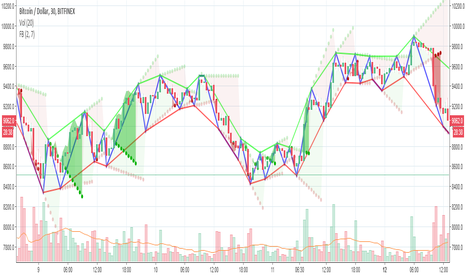
Fractal BreakoutFirst of all, huge credit to synapticEx , whose brilliant use of the security function inspired me to figure out a way to get quasi-shape boundaries automatically drawn on a chart.
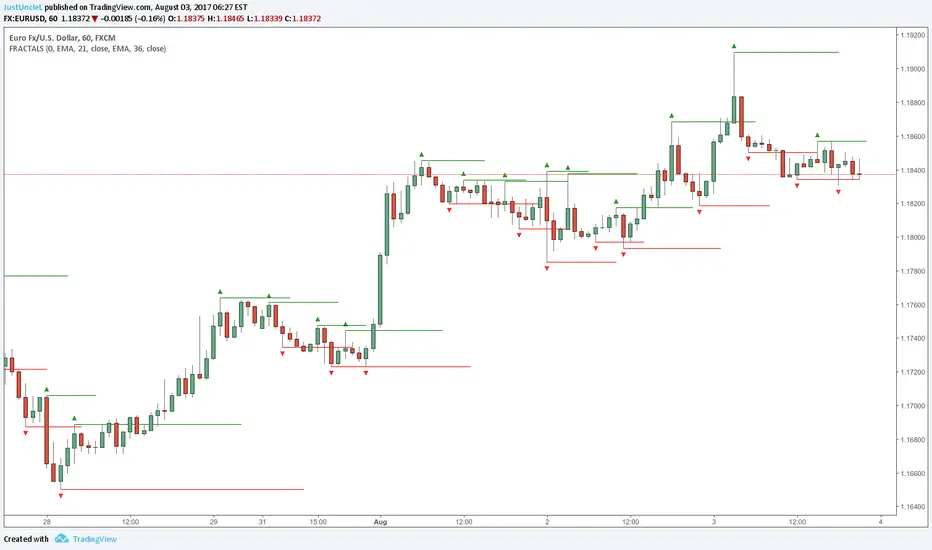
This study draws upper and lower trend lines, based on configurable fractal*** reversal detection, calculates slope from the last two upper or lower reversal points, and then extends a dotted line along the same slope...until the next upper (or lower) reversal occurs. If the high (or low) breaks this extension, the dotted line becomes solid to aid visibility. Reversal detection is configurable to use any number of ticks, but probably four to eight will work best.
I made the inclusion of volume in the reversal logic optional (off by default) and left the existing SMA input found in synapticEx's code intact, albeit with a lower default. With the addition of trend lines, I found volume hindered identification of reversals, although I could try various other filters than the SMA included originally.
I have also left intact the very nice ability to change the period and use the requested period identify reversals, courtesy of synapticEx.
This could be used in a strategy, as the values plotted are actual values that are available to include in logic and do not include knowledge of the future. However , information is not available until the floor of half the number of ticks used in reversal detection (I then offset by that number to line things up visually). Having never heard of it until now, I just Googled the Bill Williams Alligator strategy, which looks interesting, so maybe I could see how this could be ported to that.
***As I typed this, I remembered that while making reversal detection configurable, I changed the detection logic simply to look for highest (or lowest) of the desired length of ticks. I don't know whether this is not strictly fractal anymore, but if desired, with a little work, I could make it require consecutive, consistent changes before and after each reversal again.
Here are a few screenshots from hourly ticks, using the "current" (hourly) period, with and without volume, and playing with the number of points used to identify reversals.
Not using volume
Using volume
Indicateur

Indicateur

Indicateur

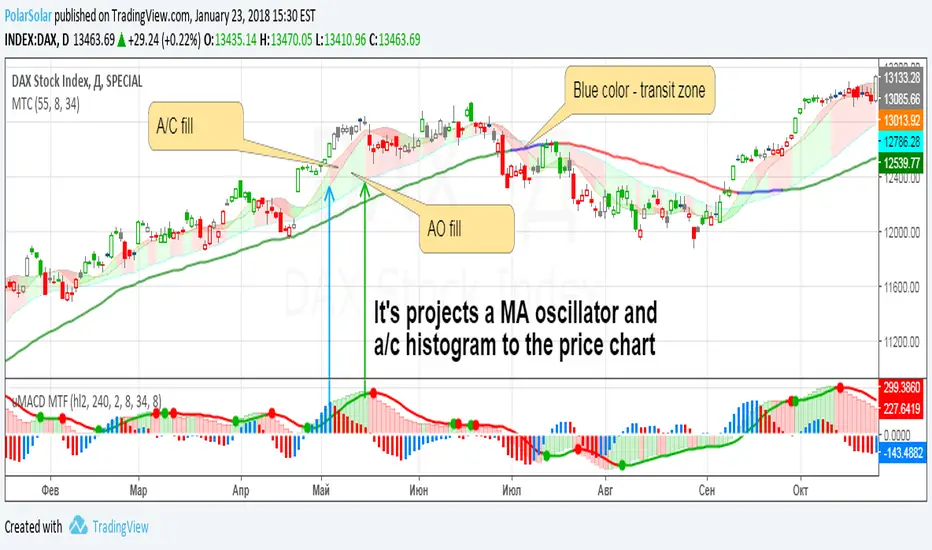
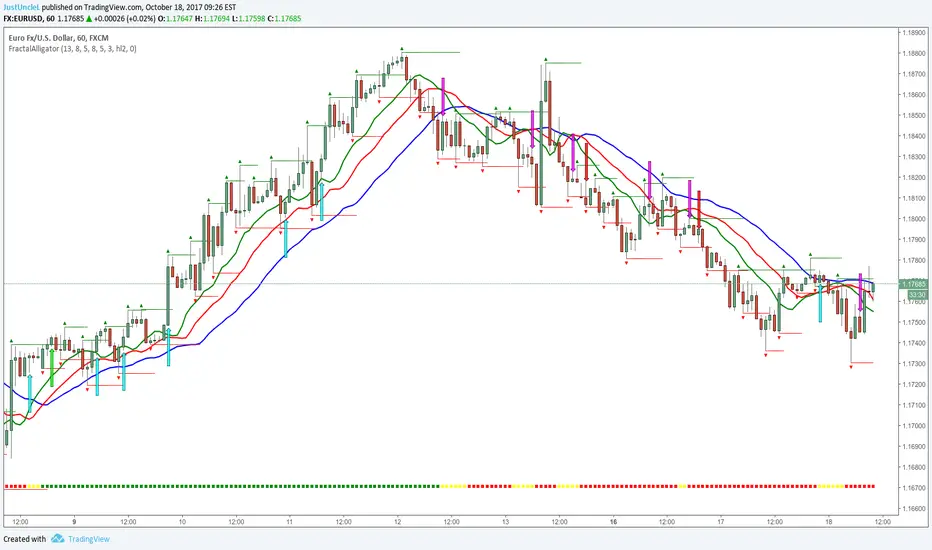
Bill Williams. Alligator, Fractals & Res/Sup combined (by vlkvr)Bill Williams indicators (each separately) are simple and quite self-sufficient, however, are most often used together. The key ones (Alligator and Fractals) are freely available and everyone can use them, but why use them on the chart separately, when "together more fun", and not conceivable, in my opinion, they are one without the other.
So, I present "split/copypasta" of two key indicators of Bill Williams, plus (as a bonus) visualization of "Support/Resistance" levels (and in fact, lines from extremes or the same fractals).
As a result, before you indicator "three-in-one". Indicateur

Indicateur

Stratégie

Indicateur

Stratégie

Indicateur

Indicateur

Indicateur

Indicateur

Indicateur

Indicateur