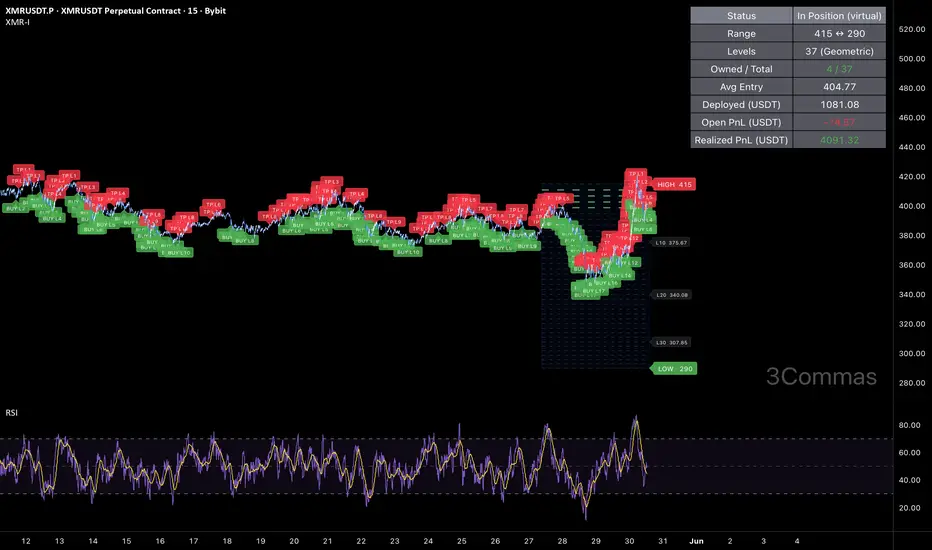
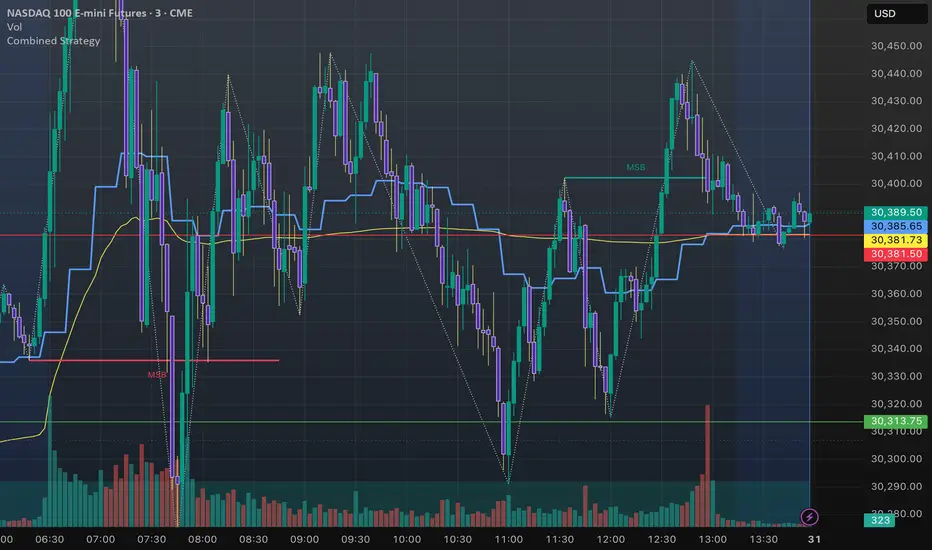
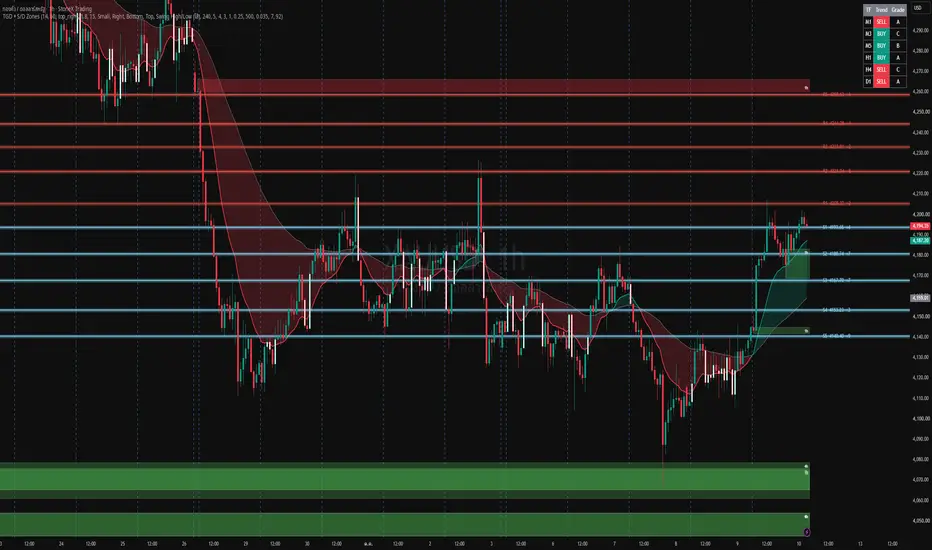
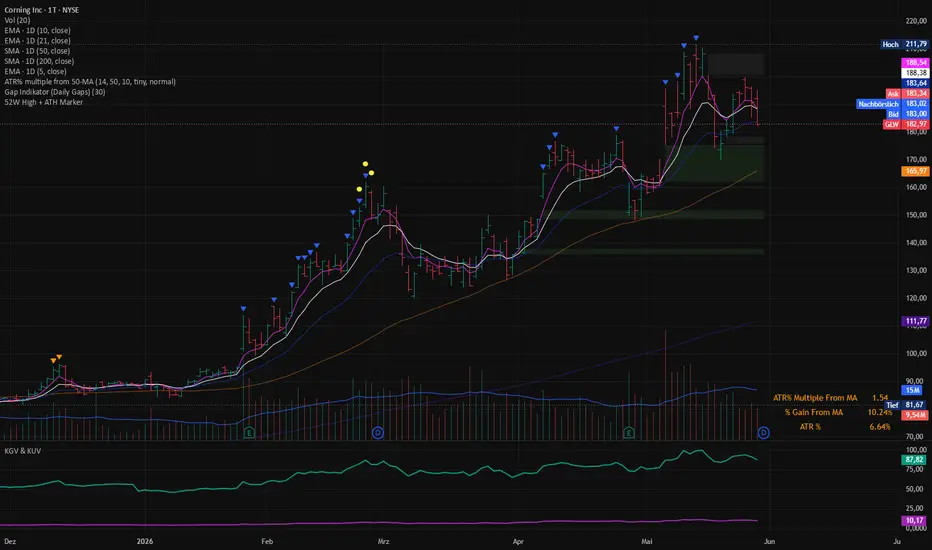
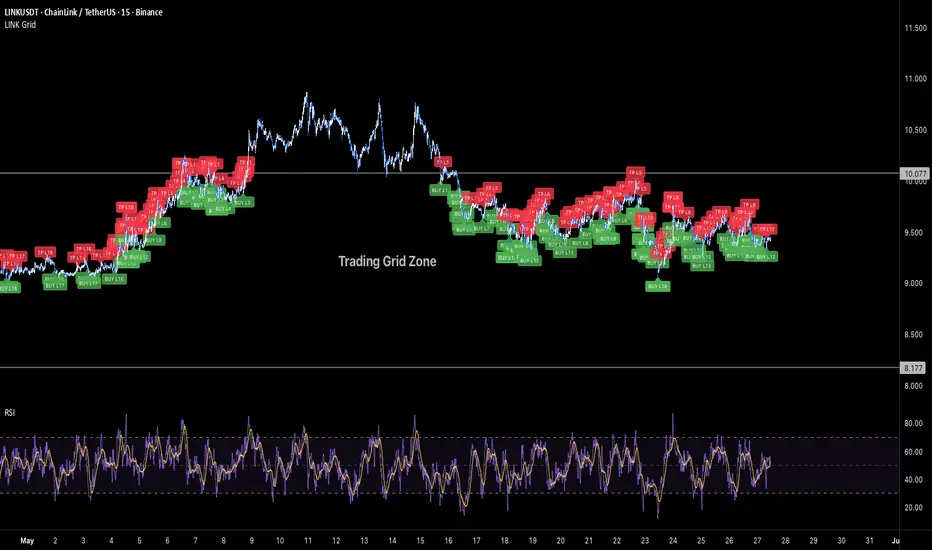
Avg Weekly Move + ImpliedProjects the expected weekly range and the key levels that drive it, anchored to the current week and readable on any timeframe; no repaint.
What it plots
- Average weekly move band — the mean weekly move over a configurable lookback, drawn as upper/lower lines around an anchor (this week's open or prior week's close). Choose Close-to-Close or High-Low Range, and Percent basis (scales to current price) or raw Points.
- Implied move overlay (manual) — enter the expected move from your broker'
Indicateur