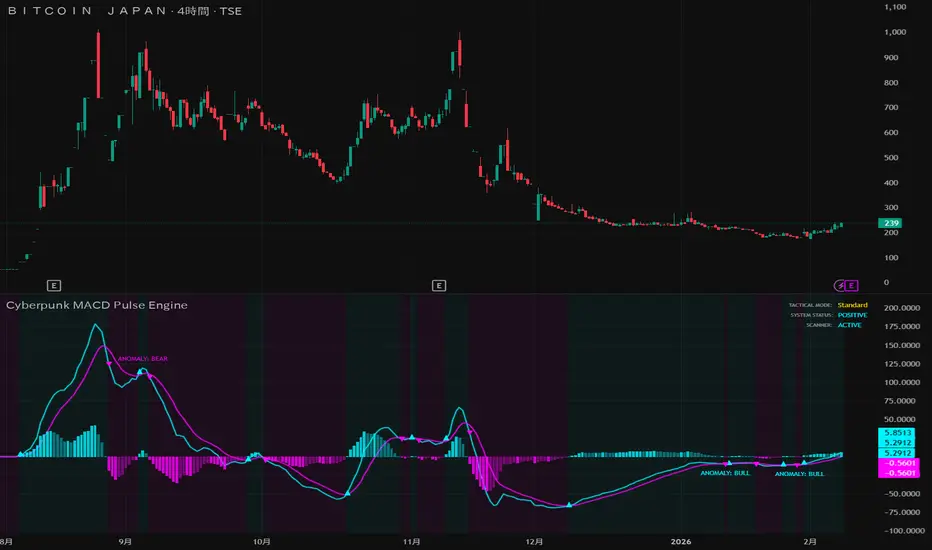
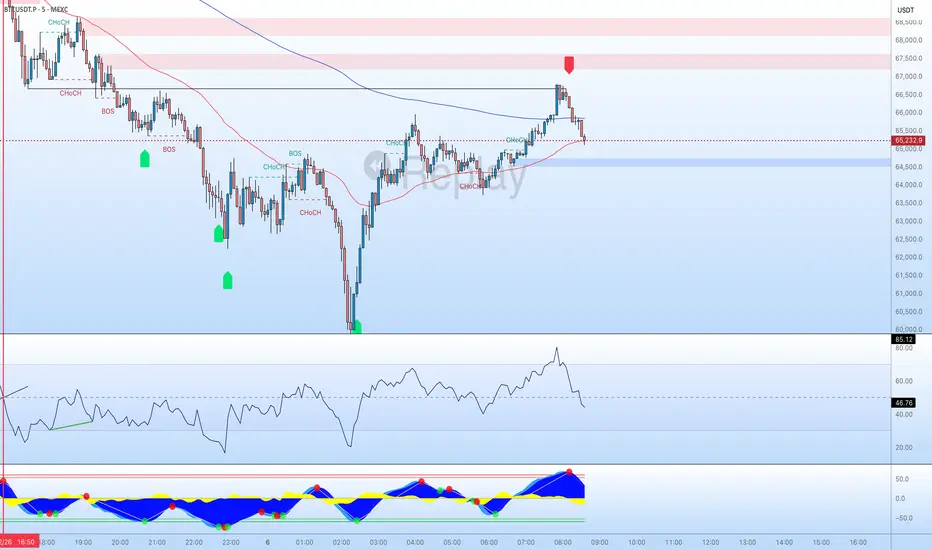
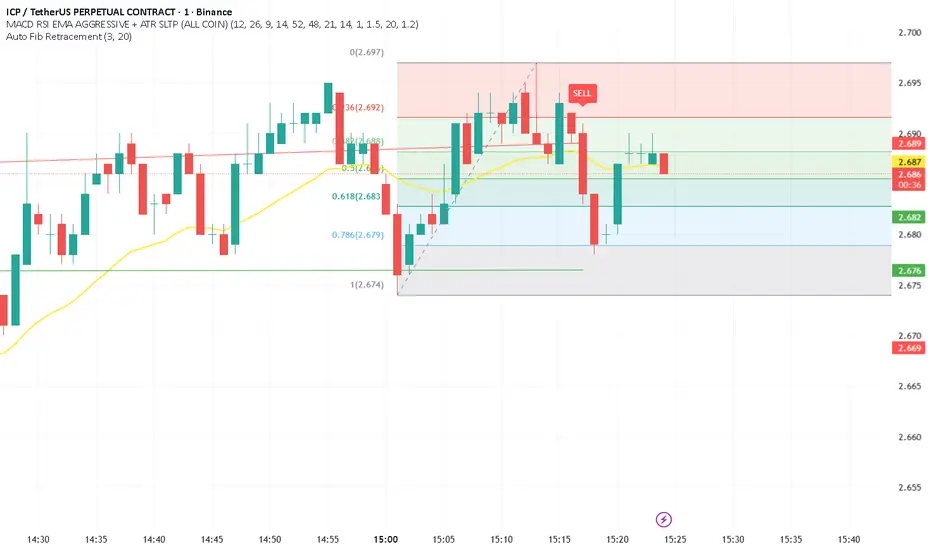
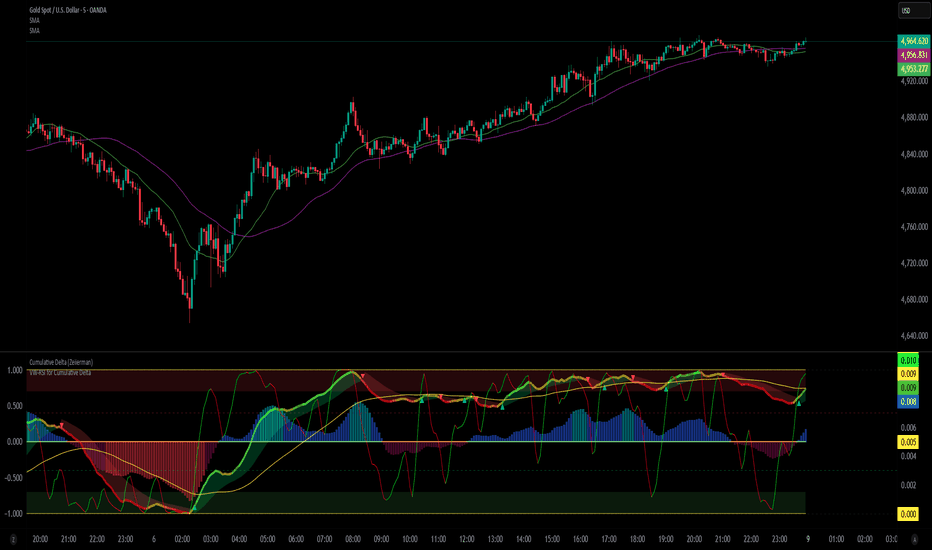
Rhokeo-VW-RSI Histogram for Cumulative Delta by ZeiirmanRhokeo-VW-RSI Histogram: Volume-Weighted Momentum (use with Cumulative Delta from Zeiierman) Note that Cumulative Delta is a paid indicator.
Overview: The Rhokeo-VW-RSI Histogram is a momentum oscillator designed to filter out market noise by integrating volume directly into the RSI calculation. Unlike a standard RSI, which only considers price change, this indicator weights those changes by the volume occurring at the time.
It creates a momentum profile in the form of a Histogram. If the price moves on high volume, the indicator reflects that strong market interest through its volume-weighted gain and loss calculations. It is particularly effective as a complementary filter for “Cumulative Delta” from Zeiierman to confirm the strength behind a move before you enter a trade.
How It Works The indicator operates on a normalized scale of -1.0 to +1.0 for easier visual interpretation and compatibility with Cumulative Delta indicator:
• The Volume-Weighted Core: Gains and losses are calculated by multiplying the price change by volume to ensure the "Relative Strength" reflects true capital flow.
• Smoothing for Clarity: The raw Volume Weighted RSI (VW-RSI) is processed through a customizable Moving Average—such as SMA, EMA, SMMA, WMA, or VWMA—to produce the smooth histogram.
• Four-Zone Coloring System: The histogram changes color dynamically based on momentum intensity:
o Strong Bull: Price is trending up with high-volume conviction.
o Weak Bull: Positive momentum, but not yet overextended.
o Weak Bear: Negative momentum starting to build.
o Strong Bear: Heavy selling pressure with high-volume conviction.
Key Features
• Shading: The background features optional red and green shading in the "Extreme" zones to warn traders of potential exhaustion areas.
• Dynamic Zero Line: The center line flips color between Green and Red based on whether the VW-RSI is positive or negative.
• Customization: Traders can adjust the smoothing length, source price, and the specific levels for overbought/oversold zones.
Best Use Case for New Traders: New traders often get "faked out" by price spikes that have no volume behind them. This indicator helps confirm and time better entries:
1. Wait for your Cumulative Delta indicator to give a signal.
2. Check the VW-RSI Histogram and whether it confirms or not.
3. Long Entry: Only enter if the histogram is positive and rising (above 0).
4. Short Entry: Only enter if the histogram is negative and decreasing (below 0).
________________________________________
Disclaimer
Financial Risk:
• Trading involves significant risk, and most traders lose money.
• This indicator is a tool for technical analysis and does not constitute financial, investment, or trading advice.
• Past performance is not indicative of future results; never trade with money you cannot afford to lose.
Usage & Reliability:
• The Rhokeo-VW-RSI Histogram is provided "as-is" for educational and informational purposes only.
• While volume-weighting aims to filter market noise, no indicator can guarantee 100% accuracy or predict future market movements with certainty.
• This script is intended to be a complementary tool that works well with other indicators in this case the Cumulative Delta from Zeiirman; it should be used in conjunction with other forms of analysis, risk management, and your own due diligence.
Commercial Notice:
• If you are using this alongside a third-party paid indicator, please note that I am not responsible for the performance or support of external products.
• Users are responsible for their own trade execution and account management.
Indicateur
Indicateur
Indicateur

Indicateur

7M Multi-Factor Momentum ScoreboardThe 7M Scoreboard is more than just a collection of indicators; it is a Real-Time Scoring Engine designed for momentum traders and quant-focused analysts. While many scripts simply "mash up" indicators, the 7M Dashboard provides a weighted analytical framework that filters market noise into a single, actionable 7M Score.
It evaluates seven distinct dimensions of market health: Price Action, Relative Volume (Time-specific and Daily), Capital Structure (Float), and Multi-timeframe Trend alignment (VWAP, VWMA, MACD).
Make sure to enable Extended Trading Hours in the TradingView settings.
What makes it original?
The core innovation lies in the 7M Scoring & Alerting logic. Instead of a trader manually checking eight different parameters, the script performs a logical "Pass/Fail" assessment on every bar.
Dynamic Time-Anchored Change: Unlike standard change percentages, this script allows you to anchor the "Starting Price" to the Pre-market (4:00 AM), Regular Open (9:30 AM), or Post-market (4:00 PM).
Relative Volume (RVOL) at Time: It compares the current 5-minute volume not just to recent bars, but to the historical average for that specific time of day, filtering out the standard "lunchtime lull."
Capital Structure Integration: It incorporates a "Float" filter, essential for identifying low-float momentum vs. heavy-cap institutional moves.
How it works
The script calculates a total score out of 9 points based on the following criteria:
Momentum: Is price change > X percent from your chosen time anchor?
Liquidity: Is the 5-minute volume > X million?
Relative Strength: Is Daily RVOL and Time-specific RVOL > X?
Trend Alignment: Is price above VWAP and the 20-period VWMA?
Momentum Convergence: Is the MACD histogram positive?
Volatility Health: Is RSI between 30 and 70 (avoiding extreme over-extension)?
Step-by-Step Guide to Use
Set your Market Type: Open the settings and choose your Price Change Anchor.
Use Pre-Market if you trade the morning "Gap and Go."
Use Regular Open if you are a day-trader focused on the 9:30 AM bell.
Configure Thresholds: Set your Min % Move (e.g., 1.5%) and Min 5m Vol.
Monitor the 7M Score: Look at the bottom row.
Score < 5: High-risk, no clear momentum.
Score 7+: High-probability "7M Pass" setup.
Alerts (Great with TV's Watchlist Alerts)
Right-click the chart and "Add Alert." Select the 7M Dashboard and choose the "🚀 7M PASS" condition to be notified the moment a ticker hits your momentum criteria.
Recommended Settings for Different Assets
Small-Cap Momentum Pre-Market - 4.0% (Change) - 500k (5m Vol) - 50M (Float)
Mega-Cap / Tech Regular - 1.0% (Change) - 1.5M (5m Vol) - 30,000M (Float)
Crypto Intraday Regular - 2.5% (Change) - 1M (5m Vol) - 10,000M (Foat)
Technical Details
Pine Script Version: v6
Visuals: Features a high-contrast UI with adaptive text sizing for the final 7M Score.
Alerting: Includes an optimized alert() function for real-time momentum detection.
Disclaimer
The "7M Multi-Factor Momentum Scoreboard" is a technical analysis tool provided for educational and informational purposes only. Nothing contained in this script, its outputs, or the 7M Score constitutes financial, investment, or trading advice. Trading stocks, futures, and cryptocurrencies involves significant risk of loss and is not suitable for every investor.
No Guarantees: Past performance as displayed by historical indicators is not indicative of future results.
Model Limitations: The 7M Score is based on mathematical calculations of price and volume; it does not account for fundamental news, earnings surprises, or broader macroeconomic shifts.
Personal Responsibility: You are solely responsible for your own trading decisions. Always perform your own due diligence and consult with a licensed financial advisor before putting capital at risk. Indicateur

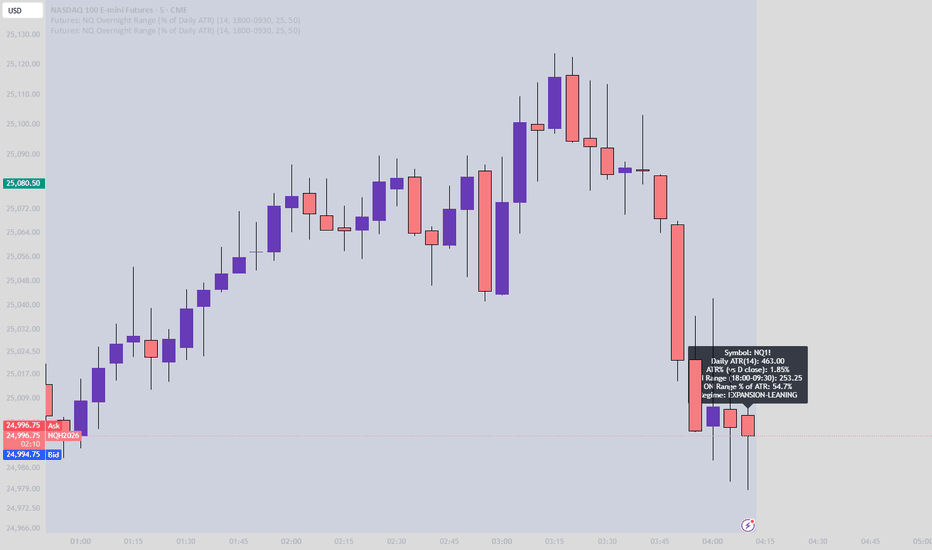
Futures: NQ Overnight Range (% of Daily ATR)## Futures: NQ Overnight Range (% of Daily ATR) — ORB Trading Guide
### What this indicator does
This indicator is built for **NQ / MNQ futures** and is meant to support **Opening Range Breakout (ORB)** trading.
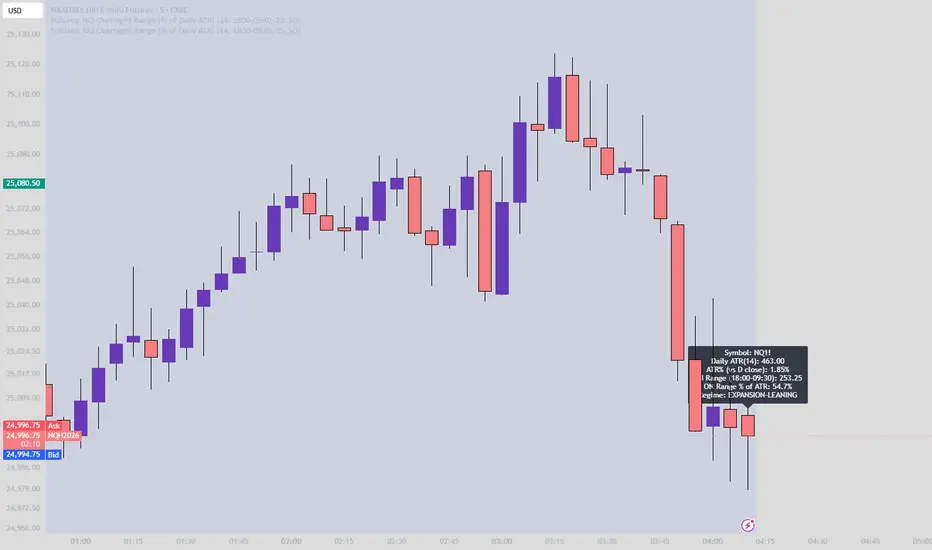
Because futures trade nearly 24 hours, a lot of important movement happens during **Asia + London**. This script measures the **Overnight Range** from **18:00 to 09:30** (exchange time), then compares it to the market’s **typical full-day movement** using **Daily ATR(14)**.
The goal is simple:
> **Before the open, decide whether the day is more likely to behave like a “chop day” or an “expansion day,” and then choose the ORB style that matches.**
---
## Key terms (plain English)
### Daily ATR(14)
ATR is the average daily movement over the last 14 days.
Think of it as:
> “On a normal day, NQ tends to move about *X* points.”
---
### Overnight Range (18:00–09:30)
This is the distance between the **overnight high** and **overnight low** from 18:00 to 09:30.
Think of it as:
> “How much NQ already moved before the cash open.”
---
### Overnight Range % of ATR
This is the “volatility meter” for the day:
It answers:
> “How much of a normal day’s movement already happened overnight?”
---
## How to interpret the Regime label
This script classifies the day into one of three “regimes”:
### **CHOP-LEANING** (Overnight Range < 25% of Daily ATR)
Overnight was quiet. The open is more likely to be:
* range-bound
* full of fakeouts
* slower follow-through
### **NEUTRAL** (25%–50%)
Normal overnight activity. Either outcome is possible:
* trend or chop
* you must let the open confirm it
### **EXPANSION-LEANING** (Overnight Range > 50%)
Overnight was very active. The open is more likely to:
* move faster
* expand range quickly
* have stronger directional pushes (or sharp swings)
**Important:** Expansion does not guarantee a clean trend. It means **movement is more likely**.
---
# How I use this indicator with ORB (my rules)
This indicator is not a buy/sell signal by itself.
I use it to decide **which ORB style to trade**.
## Step 1 — Check the “Regime” before the open
* If the indicator reads **EXPANSION-LEANING**, I treat it like a momentum environment.
* If the indicator reads **CHOP-LEANING**, I treat it like a confirmation environment.
* If it reads **NEUTRAL**, I stay selective and let price action confirm.
---
## Step 2 — ORB Execution Rules
### ✅ If **EXPANSION-LEANING** (momentum day)
**Goal:** Catch the move early and avoid missing the breakout.
**My ORB plan:**
* Build my opening range using the **5-minute ORB**
* Enter on a **break of the ORB level**
* Use the **1-minute timeframe** for the actual entry trigger
**How I confirm the break:**
* I want a clean break through the ORB level (not just a wick touch)
* If price snaps immediately back inside the ORB, I avoid chasing
This approach fits expansion days because the market can move quickly and waiting for perfect retests can cause you to miss the push.
---
### ✅ If **CHOP-LEANING** (confirmation day)
**Goal:** Avoid fakeouts and only enter when the break proves itself.
**My ORB plan:**
* Build my opening range using a **15-minute ORB**
* I do **not** enter on the first break
* I wait for a **break and retest**
* Then I use the **5-minute timeframe** to confirm the retest holds before entry
This fits chop days because breaks fail more often, so I require confirmation before committing.
---
### ✅ If **NEUTRAL**
**Goal:** Reduce low-quality trades.
**My ORB plan:**
* Treat it as “wait and see”
* Only take the break if price shows strong conviction (hold outside ORB)
* If price is whipping in and out of the range, I skip the trade
---
## Best practices
* This indicator works best on **1m / 5m / 15m charts** so the overnight high/low is captured accurately.
* Times are based on the symbol’s **exchange time**.
* Use proper risk management—futures can move fast, especially on expansion days.
---
## Disclaimer
This script is for educational purposes only and is not financial advice. Futures trading carries significant risk. Always use risk management and test any approach before trading live.
---
Indicateur
Momentum - MOM🎯 Overview
This is an advanced Momentum - MOM indicator that measures absolute price change over time, combined with dynamic moving average filtering. Unlike basic MOM implementations, this version features gradient momentum zones, multiple color themes, and a clear signal dashboard for precise price momentum identification.
🧩 Core Components
1. ⚙️ Technical Foundation
📊 Primary Calculation: Uses TradingView's built-in ta.mom() function which calculates absolute price difference between current price and price N periods ago
📈 Dual Analysis Components:
MOM Line: Absolute price change oscillator (unbounded range based on price)
MA Filter: Customizable moving average acting as momentum baseline
Momentum Zones: Gradient fills for strong positive and negative momentum extremes
⚡ Absolute Change Measurement: Unique ability to quantify the actual price movement in points/currency units
2. 🎛️ Configuration Parameters
📏 MOM Length: Default 14 periods (standard momentum setting)
🔄 MA Filter Settings:
Length: Customizable (default 365 periods)
Type: 6 options available (EMA, SMA, RMA, WMA, VWMA, HMA)
🎨 Color Themes: 5 visual schemes consistent with your indicator suite:
Classic, Modern, Robust, Accented, Monochrome
📊 Signal Interpretation:
🟢 BULLISH: MOM > MA Filter (price momentum above baseline)
🔴 BEARISH: MOM < MA Filter (price momentum below baseline)
🚀 STRONG BULLISH: (extreme positive momentum)
📉 STRONG BEARISH: (extreme negative momentum)
3. 🎨 Visual Elements
🚨 Gradient Zones:
Strong Bullish zone : Green gradient intensifying toward higher values
Strong Bearish zone : Red gradient intensifying toward lower values
📋 Dashboard Display: Top-right status indicator showing "⬆️ Bullish" or "⬇️ Bearish"
📊 Dynamic Coloring: MOM line changes color based on position relative to MA
⚡ Midline Reference: Subtle 50-level reference line for scale orientation
⚡ Trading Applications
📈 Primary Uses:
🎯 Absolute Momentum Measurement:
MOM > MA = Bullish price momentum
MOM < MA = Bearish price momentum
MOM = 0 = No net price change over period
💪 Momentum Strength in Price Terms:
Shows actual points/currency gained or lost
Useful for position sizing and risk management
More intuitive than percentages for some traders
🚨 Extreme Momentum Signals:
Extreme Bullish: (major price appreciation)
Extreme Bearish: (major price depreciation)
📊 Zone Analysis:
🟢 Strong Bullish Zone :
Green gradient fills
Indicates substantial price gains over the period
Often signals strong trend continuation or potential exhaustion
🔴 Strong Bearish Zone :
Red gradient fills
Indicates substantial price losses over the period
Often signals strong downtrend or potential reversal
🟡 Equilibrium: Yellow MA line acts as momentum baseline filter
🎨 Customization Options
👁️ Display Features:
📊 Dual Components: Always shows both MOM line and MA filter
🎨 Gradient Visualization: Automatic fill for extreme momentum conditions
📋 Status Dashboard: Clear bullish/bearish momentum indication
📈 Customizable MA: Choose from 6 different moving average types
📏 Wide Dynamic Range: ±15,000 levels accommodate various asset price ranges
🎨 Visual Themes: (Consistent suite)
🎨 Classic: Green/Red (traditional momentum colors)
🚀 Modern: Cyan/Purple (contemporary)
💪 Robust: Amber/Deep Purple (high contrast)
🌈 Accented: Purple/Magenta (vibrant)
⚫⚪ Monochrome: Light Gray/Dark Gray (minimalist)
🔔 Alert System
🟢 LONG Alert: Triggers when MOM crosses above MA
🔴 SHORT Alert: Triggers when MOM crosses below MA
📧 Format: Includes ticker symbol for tracking
⚡ Key Advantages
✅ Strengths:
🎯 Price-Based Analysis: Measures actual price movement in understandable units
💪 Absolute Value Interpretation: Shows exact points gained/lost over period
👁️ Clear Trend Momentum: MA filter separates noise from meaningful momentum
🔄 Flexible Across Assets: Works equally well with stocks, crypto, forex, etc.
📊 Professional Dashboard: Immediate momentum status recognition
📊 Optimal Settings:
⚡ Short-term Trading: MOM Length 10-14, MA Length 20-50
📊 Medium-term Trading: MOM Length 14-20, MA Length 50-100
📈 Long-term Trading: MOM Length 20-30, MA Length 100-365
🏆 Unique Features:
🎯 Absolute Price Measurement: Shows exact price change, not percentages
📊 Extreme Thresholds: ±15,000 levels for major momentum identification
🎨 Consistent Design: Matches your indicator family aesthetics
📋 Momentum Dashboard: Quick visual confirmation of price momentum
🔧 Direct Price Analysis: No conversion needed - shows actual market movement
🔄 Trading Strategies
1. Price Momentum Strategy:
Go LONG when MOM crosses above MA with positive values
Go SHORT when MOM crosses below MA with negative values
Strong signals when MA crossover aligns with extreme zones
2. Momentum Divergence:
Price makes higher high, MOM makes lower high → Bearish divergence (momentum weakening)
Price makes lower low, MOM makes higher low → Bullish divergence (selling pressure decreasing)
3. Trend Strength Assessment:
Large positive MOM values = Strong uptrend momentum
Large negative MOM values = Strong downtrend momentum
MOM near zero = Consolidation or trend change
📈 Performance Tips
Asset-Specific Thresholds: Adjust ±15,000 levels based on typical price ranges
Zero Line Significance: MOM crossing zero often precedes trend changes
Extreme Readings: Very high/low MOM values may indicate exhaustion moves
Multiple Timeframes: Compare MOM values across timeframes for confirmation
Combine with Volume: Add volume analysis to confirm momentum moves
This enhanced Momentum indicator provides professional-grade price-based momentum analysis with intuitive visualization, allowing traders to measure exact price movements, identify momentum trends in absolute terms, and filter signals through the customizable moving average for precise momentum-based trading decisions! 📊📈 Indicateur

Commodity Channel Index - CCIOverview
This enhanced Commodity Channel Index (CCI) indicator provides traders with a sophisticated visualization of market momentum and trend direction. By combining the classic CCI oscillator with customizable moving averages and advanced visual features, it offers clear signals for identifying bullish and bearish market conditions.
Core Functionality
Indicator Components
CCI Oscillator - Measures how far current price deviates from its statistical average
Moving Average Filter - Smooths CCI values using your choice of 7 MA types
Visual Zones - Color-coded overbought/oversold areas with gradient fills
Market Bias Display - Prominent bullish/bearish label for quick interpretation
Key Features
📊 Customizable Calculations
Adjust CCI period (default: 55) for sensitivity tuning
Select MA type (EMA, SMA, WMA, HMA, etc.) and period (default: 30) for smoothing
Flexible moving average system supporting multiple calculation methods
🎨 Advanced Visualization
Dynamic Color Coding: CCI line turns green when bullish (>50), red when bearish (≤50)
Gradient Fill Zones:
Green gradient between CCI and midline for overbought region (200 to 0)
Red gradient between CCI and midline for oversold region (0 to -100)
Multiple Plot Layers: CCI line, MA line, midline, and fill areas for comprehensive view
🔍 Clear Signal Interpretation
Bullish Condition: CCI > 50 (green zone)
Bearish Condition: CCI ≤ 50 (red zone)
Overbought Warning: CCI in upper gradient zone
Oversold Opportunity: CCI in lower gradient zone
📱 User-Friendly Display
Large "⬆️ Bullish" or "⬇️ Bearish" label in corner for immediate bias assessment
Thick CCI line (width 3) for easy visibility
Yellow MA line for trend direction confirmation
Trading Applications
Trend Identification
Use CCI position relative to 50 midline for trend bias
MA line confirms trend strength and direction
Long periods (110/30) optimized for capturing sustained trends
Potential Reversal Zones
Gradient fills highlight overbought/oversold extremes
Watch for CCI crossing the 50 level for trend change signals
Combine with MA line crosses for confirmation
Market Sentiment Assessment
Quick visual scan of color reveals current market bias
Label provides unambiguous bullish/bearish classification
Multiple timeframes supported through adjustable periods
Usage Recommendations
📈 For Trend Following:
Trade in direction indicated by CCI > 50 (bullish) or ≤ 50 (bearish)
Use MA line as dynamic support/resistance for CCI
Consider entries when CCI pulls back toward 50 in trend direction
🔄 For Mean Reversion:
Watch for extremes in gradient zones for potential reversals
Monitor for CCI crossing back through 50 after reaching extremes
Use MA line as confirmation for reversal validity
⚖️ For Confirmation:
Pair with other indicators for signal confirmation
Use as secondary tool to validate primary trading system signals
Adjust periods to match your trading timeframe
Customization Options
CCI Length: Adjust sensitivity (higher = smoother, lower = more responsive)
MA Type & Length: Choose smoothing method and period
Visual Elements: All colors and fills are built-in but based on logic conditions
Unique Advantages
Immediate Clarity: Color-coding and label remove interpretation ambiguity
Enhanced Visualization: Gradient fills provide intuitive overbought/oversold zones
Dual Analysis: Combines oscillator (CCI) with trend tool (MA) in one view
Flexible Configuration: Multiple MA types accommodate different trading styles
This indicator transforms the traditional CCI into a comprehensive trading tool that provides clear visual cues for market direction, momentum extremes, and trend confirmation—all in a single, customizable package. Indicateur

Indicateur

Indicateur

Indicateur

Indicateur

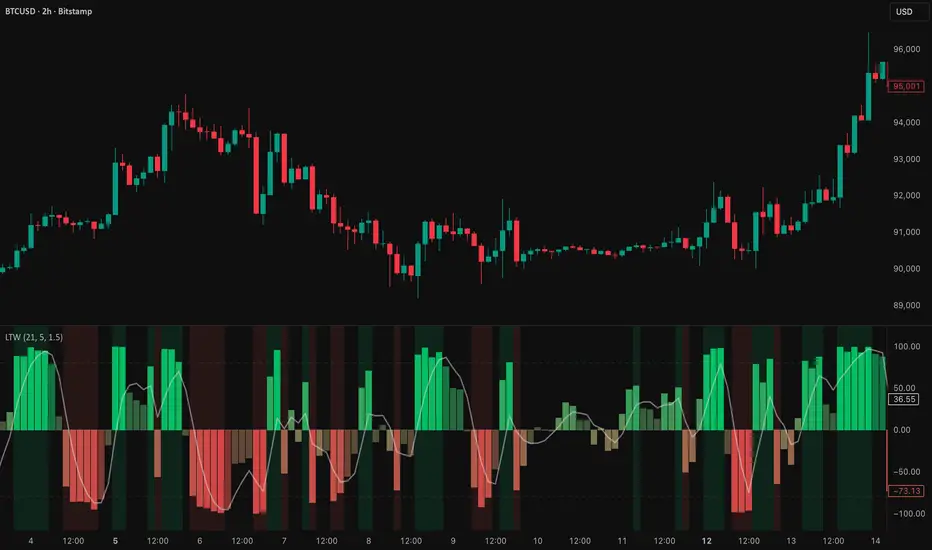
Luminous Trend Wave [Pineify]```
Luminous Trend Wave - Hull MA Based Normalized Momentum Oscillator
The Luminous Trend Wave (Pineify) is a momentum oscillator designed to provide clear, responsive trend signals while minimizing the lag commonly associated with traditional momentum indicators. By combining Hull Moving Average (HMA) calculations with ATR-based normalization and hyperbolic tangent transformation, LTW delivers a bounded oscillator that works consistently across different assets and timeframes.
Key Features
Hull Moving Average foundation for reduced lag trend detection
ATR normalization for universal applicability across all markets
Bounded output range (-100 to +100) using mathematical tanh transformation
Dynamic gradient coloring that reflects momentum intensity
Built-in signal line for momentum confirmation
Automatic alerts for trend reversals and momentum shifts
How It Works
The indicator operates through a four-stage calculation process:
Trend Basis Calculation: The indicator first calculates a Hull Moving Average (HMA) of the closing price. HMA was chosen specifically because it provides significantly less lag compared to Simple or Exponential Moving Averages while maintaining smoothness. This allows the oscillator to respond quickly to genuine price movements.
Distance Measurement: The raw distance between the current close price and the HMA trend line is calculated. This distance represents how far price has deviated from its smoothed trend.
ATR Normalization: The distance is then divided by the Average True Range (ATR) over the same lookback period. This normalization step is crucial - it makes the oscillator readings comparable across different assets regardless of their price levels or typical volatility. A stock trading at $500 and one at $5 will produce equivalent readings when their relative movements are similar.
Tanh Transformation: Finally, the normalized value is passed through a hyperbolic tangent function scaled by a sensitivity multiplier. The mathematical formula (e^2x - 1) / (e^2x + 1) naturally bounds the output between -100 and +100, preventing extreme spikes while preserving the directional information.
Trading Ideas and Insights
Zero Line Crossovers: When the oscillator crosses above zero, it indicates a shift from bearish to bullish momentum. Conversely, crossing below zero signals bearish momentum. These crossovers can be used as entry triggers when confirmed by other analysis.
Overbought/Oversold Levels: Readings above +80 suggest overbought conditions where price has extended significantly above its trend. Readings below -80 indicate oversold conditions. These extremes often precede mean reversion moves.
Signal Line Divergence: When the main oscillator (histogram) is above the signal line, momentum is increasing. When below, momentum is decreasing. This relationship helps identify the strength of the current move.
Momentum Fading: The indicator automatically fades the color intensity when the oscillator value is closer to the signal line than to the extremes, visually indicating weakening momentum before potential reversals.
How Multiple Indicators Work Together
LTW integrates three distinct technical concepts into a cohesive system:
Hull MA + ATR Integration: The Hull Moving Average provides the trend direction while ATR provides the volatility context. Together, they answer not just "where is the trend?" but "how significant is the current deviation relative to normal market movement?"
Mathematical Bounding + Visual Mapping: The tanh transformation ensures readings stay within predictable bounds, while the gradient coloring maps these bounded values to intuitive visual feedback. Strong bullish readings appear in bright green, strong bearish in bright red, with smooth transitions between.
Oscillator + Signal Line System: Similar to MACD's relationship between the MACD line and signal line, LTW uses a WMA-smoothed signal line to filter noise and confirm momentum direction. The interplay between the faster oscillator and slower signal creates actionable crossover signals.
Unique Aspects
Universal Normalization: Unlike many oscillators that produce different reading ranges on different assets, LTW's ATR normalization ensures consistent interpretation whether trading forex, crypto, stocks, or commodities.
Sensitivity Control: The sensitivity parameter allows traders to adjust how aggressively the oscillator responds to price changes. Higher values make it more responsive (useful for scalping), while lower values smooth out noise (better for swing trading).
Visual Momentum Feedback: The gradient coloring and transparency adjustments provide immediate visual feedback about trend strength without requiring traders to interpret numerical values.
How to Use
Add the indicator to your chart - it displays in a separate pane below price.
Watch for zero line crossovers as primary trend signals. Bullish when crossing above, bearish when crossing below.
Use the ±80 levels as caution zones where reversals become more likely.
Monitor the relationship between the histogram and signal line - histogram above signal indicates strengthening momentum.
Pay attention to color intensity - faded colors indicate weakening momentum and potential reversal zones.
Set alerts for automated notifications on trend changes and momentum shifts.
Customization
Trend Lookback (default: 21): Controls the HMA period. Lower values increase responsiveness but may generate more false signals. Higher values provide smoother trends but with more lag.
Signal Smoothing (default: 5): Adjusts the WMA period for the signal line. Higher values create a slower signal line with fewer crossovers.
Sensitivity (default: 1.5): Multiplier for the tanh transformation. Increase for more reactive signals, decrease for smoother readings.
Colors: Fully customizable bullish and bearish colors to match your chart theme.
Gradients: Toggle gradient coloring on/off based on preference.
Conclusion
The Luminous Trend Wave indicator offers traders a mathematically sound approach to momentum analysis. By combining the low-lag properties of Hull Moving Average with ATR-based normalization and bounded output transformation, LTW provides consistent, interpretable signals across any market. The visual feedback system makes trend strength immediately apparent, while the signal line crossovers offer clear entry and exit timing. Whether used as a standalone tool or combined with price action analysis, LTW helps traders identify trend direction, momentum strength, and potential reversal zones with clarity.
```
Indicateur

Indicateur

RSI Level Candles [fmb]RSI Level Candles
What it is
RSI Level Candles is a minimal, high-signal overlay that keeps your attention on price. It paints candles by RSI regime and adds tiny edge dots to highlight extreme momentum. The design goal is speed and clarity with no clutter.
Why it was built
Most RSI tools sit in a separate pane and introduce noise with extra lines, labels, and overlapping thresholds. This indicator moves the information onto price itself. You see regime directly on the candles and only the most important alerts when RSI is in extreme territory.
What it does
Candles change color according to RSI. Above the neutral high (default 60) they turn green. At the high extreme (default 70, or 80 if you prefer) they turn lime. Between 40 and 60 you may show a soft yellow neutral band or leave candles unpainted. Below the neutral low (default 40) candles turn red, and at or below the low extreme (default 30, or 20 if you prefer) they turn maroon. The indicator also prints small dots at the top and bottom of the pane to spotlight extremes. A green dot appears at the top on any bar with RSI at or above the high extreme. A red dot appears at the bottom on any bar with RSI at or below the low extreme.
How this helps
You get an instant read on momentum regime without leaving the price chart. Extremes are easy to spot which helps manage chase or exhaustion risk. The neutral band behavior helps distinguish trend days from range days and supports cleaner add or trim decisions within an existing trend.
Best practices
Treat 60 and 40 as momentum gates. Above 60 favors a long bias and additive entries on pullbacks. Below 40 favors a defensive posture on longs or a short bias. Use extremes for management rather than automatic reversal calls. In strong trends RSI can remain extreme for extended periods. Look for a change in market structure or a clear reclaim of 60 or 40 before shifting bias. Combine this overlay with simple structure and trend filters such as support and resistance, a 20 or 50 period moving average, and volume or volatility context.
Inputs
You can set RSI source and length, choose neutral low and high, and choose extreme low and high. The neutral band can be shown in soft yellow between 40 and 60 or turned off entirely. You can also toggle candle painting on or off if you only want the extreme dots.
Reading the colors
Lime indicates the extreme bullish zone. Green indicates bullish momentum. Yellow indicates the optional neutral band. Red indicates bearish momentum. Maroon indicates the extreme bearish zone. A small green dot at the top means the bar is in the high extreme. A small red dot at the bottom means the bar is in the low extreme.
Use cases
For trend following, stay aligned with the prevailing regime while avoiding overreactions to small fluctuations. For swing entries, buy pullbacks while RSI holds above 40 in uptrends, and fade bounces that stall under 60 in downtrends. For risk control, trim strength that pushes into extremes and stalls, then re-add on momentum reclaims.
Limitations
RSI measures momentum, not direction by itself. Do not use it in isolation. Extremes can persist during strong trends, so wait for structure or momentum re-tests before changing bias. Very illiquid symbols can create noisy signals.
Notes
Dots are designed to appear on every bar that sits inside the extreme zones. If you prefer single entry dots, change the logic to look for crosses rather than conditions. There is no separate RSI pane, no text labels, and no cross markers. The objective is simplicity and speed. Indicateur

Indicateur

Indicateur

Indicateur
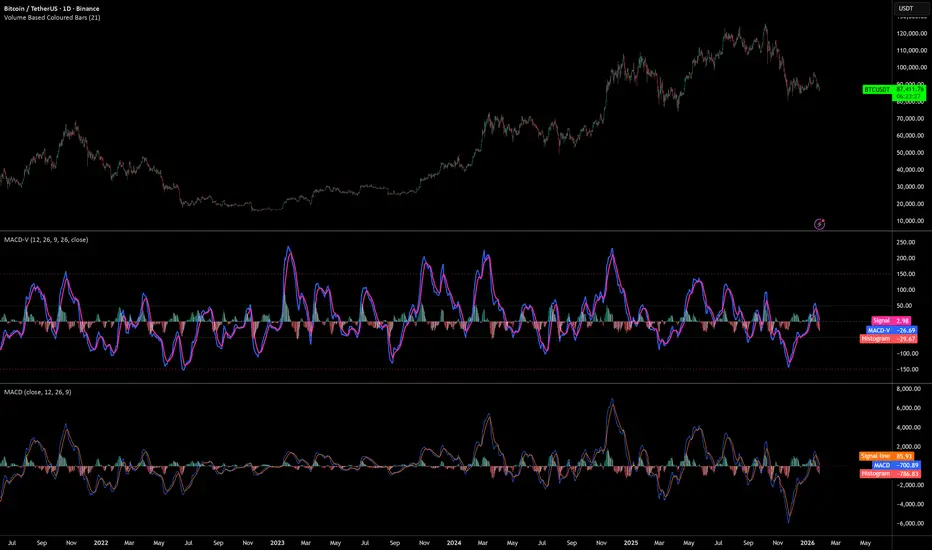
MACD-V (Volatility Normalized MACD)Award-Winning Momentum Indicator by Alex Spiroglou (CMT Charles Dao Award & NAAIM Founders Award, 2022)
The classic MACD has powered trading decisions for decades, but it suffers from five major limitations that undermine consistency:
1- Readings are not comparable over time (absolute price dependency causes massive scale differences across decades)
2- Not comparable across markets or assets (e.g., stocks vs. forex vs. crypto)
3- No universal overbought/oversold levels
4- Excessive whipsaws in low-momentum/range-bound conditions
5- Lagging signals in high-momentum reversals (e.g., missing big chunks of V-shaped recoveries)
MACD-V solves all five issues by normalizing momentum against volatility instead of price.
Core Formula
MACD-V = (EMA(12) - EMA(26)) / ATR(26) × 100
This expresses momentum in units of Average True Range (ATR), creating a volatility-adjusted oscillator that remains mathematically meaningful and comparable:
-Analysts can use MACD-V across any timeframe:
-Across any asset class (stocks, forex, commodities, bonds, crypto)
-Over decades of history
Key Features & Benefits
Time-stable & cross-market comparable: A +100 reading today has the same meaning as +100 in the past years, regardless of asset or price level.
Universal extremes: ±150 captures ~95% of all readings across markets → extreme/stretched momentum.
Momentum Lifecycle Roadmap (objective framework):
+150 or < -150: Extreme / overstretched (high reversal risk)
+50 to +150 or -50 to -150: Strong directional momentum (rallying, retracing, rebounding, reversing)
-50 to +50: Neutral / low momentum / ranging (avoid most signals — high whipsaw zone)
Range Rules for regime context: In bullish regimes (price > 200 EMA), -50 to -150 becomes the practical oversold zone; readings below -100 are rare and often powerful buy setups. Opposite in bearish regimes.
Improved signal quality: Filter whipsaws in neutral zone, anticipate lag in extremes, prioritize high-probability crosses in strong-momentum bands.
MACD-V Histogram (MACD-VH): Normalized short-term momentum with extremes at ±40 for fast reversal detection.
Backtesting & strategy-friendly: Enables reliable historical analysis, cross-asset relative strength, and systematic rules
MACD-V transforms momentum from subjective art into objective, repeatable science — giving you consistent, actionable insights no matter what you're trading.
Use it standalone or layer with trend filters (e.g., 200 EMA), volume, or price action for even stronger edges.
Developer: Alex Spiroglou
Open-source versions inspired by his work — feel free to fork and improve!
Happy trading! 🚀 Indicateur

Indicateur

Indicateur

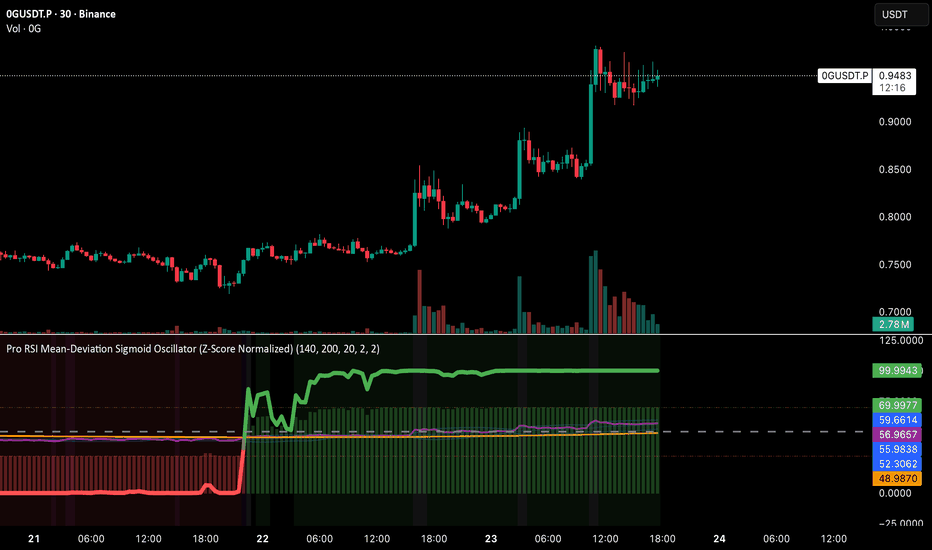
Pro RSI Mean-Deviation Sigmoid Oscillator (Z-Score Normalized)# Pro RSI Mean-Deviation Sigmoid Oscillator (Z-Score Normalized)
## 🧮 Core Mathematical Concept
**The Key Formula**: This indicator subtracts RSI's own EMA from the RSI value, divides the result by its standard deviation to create a Z-score, then applies sigmoid normalization to map it into a 0-1 range (displayed as 0-100).
**In Simple Terms**:
```
Z-Score = (RSI - RSI_EMA) / Standard_Deviation
Sigmoid = 1 / (1 + e^(-k × Z-Score))
Final Output = Sigmoid × 100
```
This mathematical approach transforms raw RSI momentum into a statistically normalized oscillator that better identifies genuine trend changes while filtering out noise.
---
## 📊 What This Indicator Does
This advanced momentum oscillator combines RSI analysis with statistical normalization to identify overbought/oversold conditions and momentum shifts with greater precision than traditional RSI alone.
**Core Innovation**: Uses Z-score normalization and sigmoid transformation to convert RSI deviations into a smooth 0-100 scale, reducing noise while maintaining sensitivity to genuine market movements.
---
## 🔧 How It Works
### 1. **RSI Foundation**
- Calculates standard RSI over your chosen period (default: 14)
- Applies an EMA smoothing line to identify the RSI trend
### 2. **Statistical Normalization**
- Measures deviation between RSI and its EMA
- Calculates Z-score (standard deviations from mean)
- Normalizes extreme values while preserving relative strength
### 3. **Sigmoid Transformation**
- Maps Z-scores to a 0-100 scale using sigmoid function
- Creates smooth transitions between bullish/bearish zones
- Reduces false signals from RSI whipsaws
### 4. **RSI Bollinger Bands**
- Adds dynamic overbought/oversold bands around RSI
- Adapts to market volatility automatically
- Confirms extreme conditions when RSI breaches bands
### 5. **Momentum Histogram**
- Visualizes rate of change in normalized momentum
- Green bars = strengthening bullish momentum
- Red bars = strengthening bearish momentum
---
## 📈 How to Use
### **Primary Signals**
**Sigmoid Oscillator (Thick Line)**
- **Above 50** = Bullish momentum dominant
- **Below 50** = Bearish momentum dominant
- **Crossing 50** = Potential trend change
**Extreme Zones**
- **Above 70** = Overbought (green background) - Consider taking profits or preparing for reversal
- **Below 30** = Oversold (red background) - Watch for potential bounce or reversal
### **Confirmation Signals**
**RSI Bollinger Band Breaches** (Purple background)
- RSI above upper band = Extremely overbought
- RSI below lower band = Extremely oversold
- Strong confirmation when paired with sigmoid extremes
**RSI vs RSI EMA Crossovers**
- Purple line (RSI) crossing above orange line (EMA) = Early bullish signal
- Purple line crossing below orange line = Early bearish signal
**Momentum Histogram**
- Growing green bars = Accelerating bullish momentum
- Growing red bars = Accelerating bearish momentum
- Shrinking bars = Momentum weakening (potential reversal warning)
---
## ⚙️ Parameter Settings
### **RSI Period** (Default: 14)
- Lower (7-10) = More responsive, more signals
- Higher (20-30) = Smoother, fewer false signals
- Recommended: Keep at 14 for most timeframes
### **RSI EMA Period** (Default: 14)
- Controls smoothness of RSI trend line
- Match to RSI period for standard behavior
- Increase for longer-term trend identification
### **Standard Deviation Period** (Default: 20)
- Lookback window for Z-score calculation
- Lower = More sensitive to recent changes
- Higher = More stable, slower to react
### **Sigmoid Sensitivity (k)** (Default: 1.0)
- **0.5-0.8** = Smoother, less extreme readings
- **1.0-1.5** = Balanced sensitivity
- **2.0+** = More aggressive, reaches extremes faster
- Adjust based on asset volatility
### **Bollinger Band Multiplier** (Default: 2.0)
- Standard deviation multiplier for RSI bands
- **1.5** = Tighter bands, more frequent signals
- **2.5-3.0** = Wider bands, only extreme moves
---
## 💡 Trading Strategies
### **Strategy 1: Momentum Continuation**
1. Wait for sigmoid to break and hold above 70 (bullish) or below 30 (bearish)
2. Confirm with growing momentum histogram in same direction
3. Enter in direction of momentum when RSI breaks Bollinger bands
4. Ride the trend until sigmoid crosses back through 50 or momentum histogram shrinks
5. This indicator excels at catching strong, sustainable momentum moves
### **Strategy 2: Momentum Breakout**
1. Identify sigmoid consolidation near 50
2. Watch for strong break above 70 or below 30
3. Confirm with growing momentum histogram
4. Enter in direction of break, exit when momentum weakens
### **Strategy 3: Divergence Detection**
1. Compare price action to sigmoid oscillator
2. Bullish divergence: Price makes lower low, sigmoid makes higher low
3. Bearish divergence: Price makes higher high, sigmoid makes lower high
4. Enter when sigmoid confirms with 50-line cross
### **Strategy 4: Multi-Timeframe Confluence**
1. Use on higher timeframe (4H/Daily) for trend direction
2. Use on lower timeframe (15M/1H) for entry timing
3. Only take trades when both timeframes align
4. Increases win rate significantly
---
## ⚠️ What to Watch For
### **Best Conditions**
- ✅ Trending markets with clear momentum
- ✅ Assets with decent volatility (not too choppy)
- ✅ When multiple signals align (sigmoid + bands + histogram)
- ✅ Confirmed with price action or volume
### **Difficult Conditions**
- ❌ Sideways, choppy markets (generates false signals)
- ❌ Low volatility periods (sigmoid may not reach extremes)
- ❌ Major news events (can cause extreme whipsaws)
- ❌ Very low timeframes (<5min) - too much noise
### **Common Pitfalls**
- Don't trade sigmoid extremes blindly - wait for reversal confirmation
- Don't ignore the momentum histogram - it shows strength of moves
- Don't use in isolation - combine with support/resistance, volume, etc.
- Don't over-optimize parameters - default settings work well for most assets
---
## 📋 Risk Disclaimers
**IMPORTANT:** This indicator is for educational purposes only and is NOT financial advice. All trading involves substantial risk of loss. Past performance does not guarantee future results. Always use proper risk management, backtest thoroughly, and consult a licensed financial advisor before making trading decisions. The creator assumes no liability for your trading results. **Trade at your own risk.**
---
## 🔍 Additional Considerations
### **Combine With:**
- Support and resistance levels
- Volume analysis
- Trend indicators (moving averages)
- Price action patterns
- Market structure analysis
### **Timeframe Recommendations:**
- **Scalping (1-5min)**: Lower RSI period (7-10), higher sigmoid sensitivity
- **Day Trading (15min-1H)**: Default settings work well
- **Swing Trading (4H-Daily)**: Increase all periods by 50-100%
- **Position Trading (Weekly)**: Double all default periods
### **Asset-Specific Tips:**
- **Crypto**: Often more volatile - consider k=0.8 for smoother signals
- **Forex**: Works well on major pairs with default settings
- **Stocks**: May need slight adjustments per stock volatility
- **Indices**: Very effective with standard parameters
---
## 📝 Credits & Sharing
Feel free to share this indicator! If you make modifications or improvements, consider sharing back with the community.
**Version**: 5
**Created for**: TradingView Pine Script
**Category**: Oscillators / Momentum
---
*Happy Trading! Remember: The best indicator is the one between your ears. Always think critically and trade responsibly.* 📊✨ Indicateur
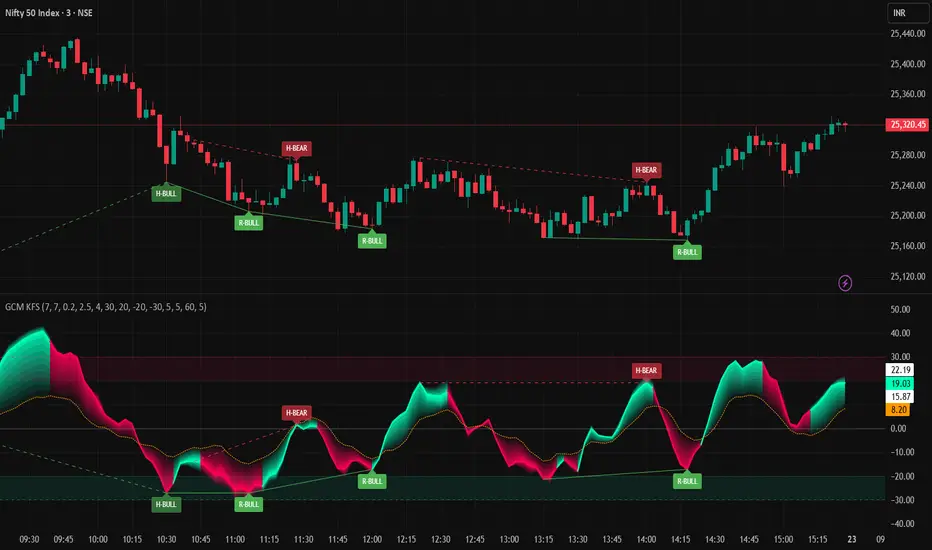
GCM Kinetic Flux SpectrumTitle: GCM Kinetic Flux Spectrum
DESCRIPTION
The GCM Kinetic Flux Spectrum is an institutional-grade hybrid momentum and volume engine. Unlike standard oscillators that rely on closing prices, the GCM KFS synthesizes dual-source RSI volatility with Volume Flow Intensity (VFI) to reveal the hidden kinetic energy of market movements.
By projecting a 27-layer "Spectrum Ribbon" and a multi-dimensional Divergence Engine, the GCM KFS identifies not just where the price is heading, but the quality and "fuel" behind the trend.
CORE ARCHITECTURE
1) The Kinetic Mean (Dual-Source RSI)
Standard RSI often ignores the battle occurring at the wicks. The GCM KFS calculates independent RSI streams for Highs and Lows, then anchors them to a Zero-Centered baseline (-50 to +50). The resulting Kinetic Mean filters out retail noise, providing a volatility-adjusted perspective on momentum.
2) Volume Flux Integration (VFI)
Volume precedes price. The GCM KFS integrates a highly responsive, EMA-smoothed Volume Flow Indicator (VFI). By syncing VFI length with the RSI cycle, the indicator cross-verifies price strength with capital flow.
• Momentum + Positive Flux: Confirms high-conviction trends.
• Momentum + Negative Flux: Reveals "Empty" breakouts or institutional distribution.
3) 27-Layer Spectrum Ribbon
The gradient fill isn't just aesthetic—it represents Volatility Density.
• Expansion: When ribbons fan out, it signals a high-velocity trend.
• Compression (The Squeeze): When ribbons pinch toward the Kinetic Mean, it signals a volatility contraction, typically the precursor to an explosive breakout.
4) Four-Way Divergence Engine
The KFS automatically detects and projects four types of divergence on both the indicator pane and the main price chart:
• Regular Bullish/Bearish: Identifying high-probability trend reversals.
• Hidden Bullish/Bearish: Identifying trend continuation (Smart Money re-entry points).
KEY POWER FEATURES
• Zero-Centered Logic: Levels are shifted for better visual balance. (OB: +20, Extreme OB: +30 | OS: -20, Extreme OS: -30).
• Dynamic Zones: Subtle background fills highlight "Extreme" areas where price is statistically likely to mean-revert.
• Main Chart Projection: Use the force_overlay feature to keep your eyes on price action while the indicator confirms entries.
• Institutional Dotted VFI: The orange dotted line acts as the "Anchor"—if price rises but the VFI Anchor stays below zero, the move lacks professional backing.
HOW TO TRADE WITH GCM-KFS
• The Reversal Sniper: Look for an R-BULL or R-BEAR label appearing inside the Extreme Zone (±30). This indicates momentum exhaustion backed by a volume shift.
• Trend Riding: During an uptrend, look for H-BULL (Hidden Bullish) labels. This signals that institutions are "buying the dip" while momentum resets.
• Volatility Breakouts: When the Spectrum Ribbon enters a tight "squeeze" near the Zero Line, prepare for a major move. Follow the direction of the first ribbon expansion.
RECOMMENDED SETTINGS
• Scalping (1m - 5m): Length 7 - 9
• Day Trading (15m - 1H): Length 10 - 14
• Swing Trading (4H - Daily): Length 20+
AUTHOR’S NOTE
This script is part of the GCM suite of professional tools. It is designed to be a "confluence engine"—it works best when used to confirm price action levels, supply/demand zones, or order blocks. Always trade with a plan and managed risk.
Indicateur