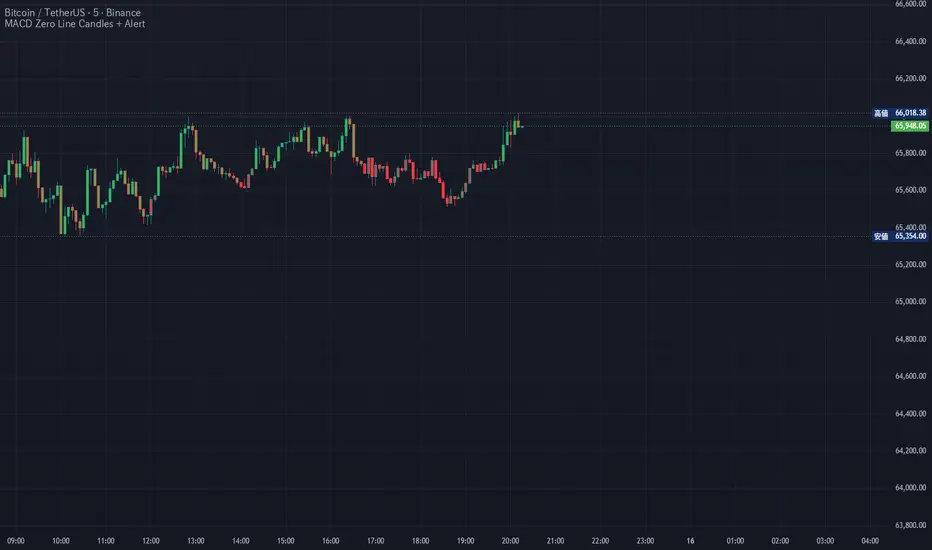
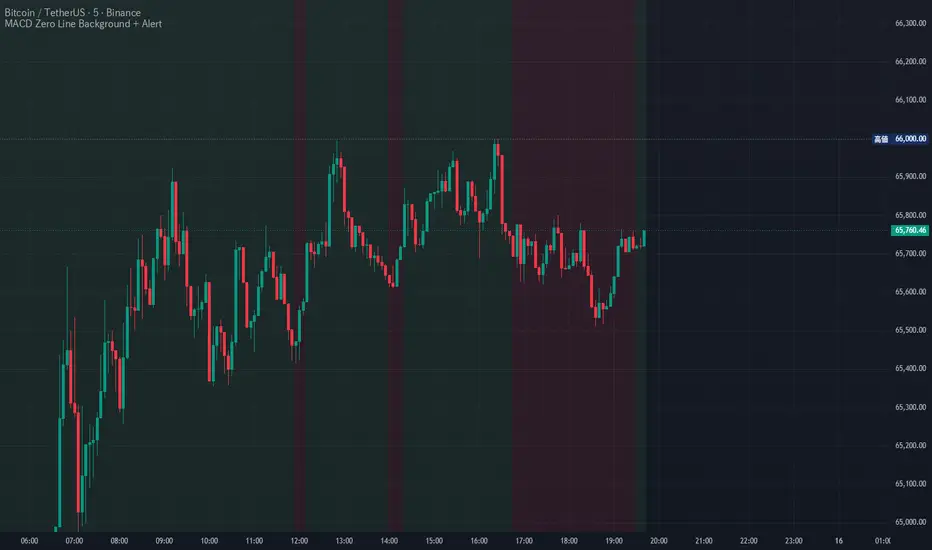
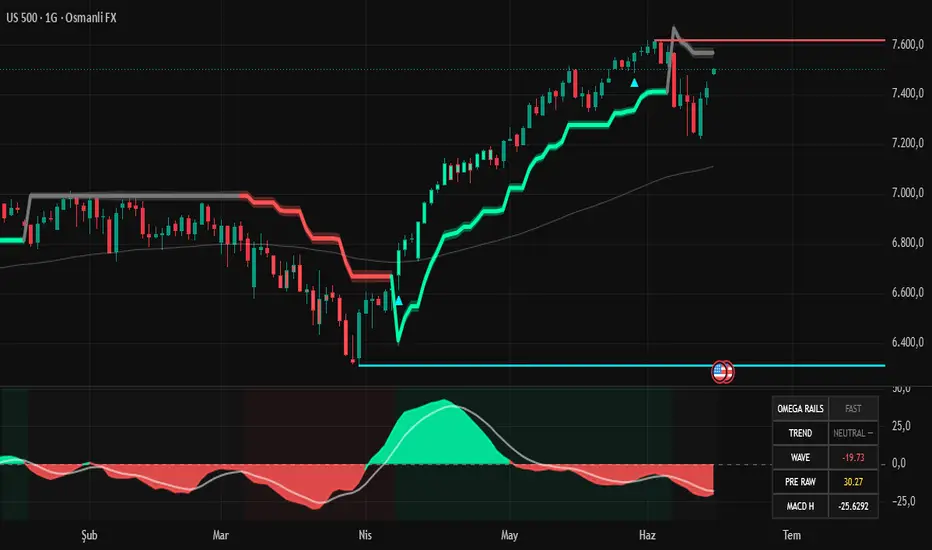
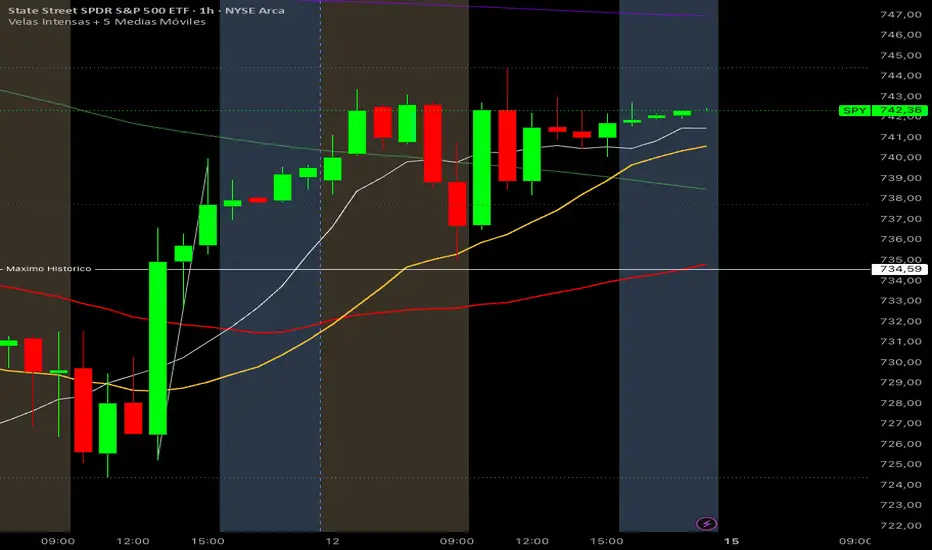
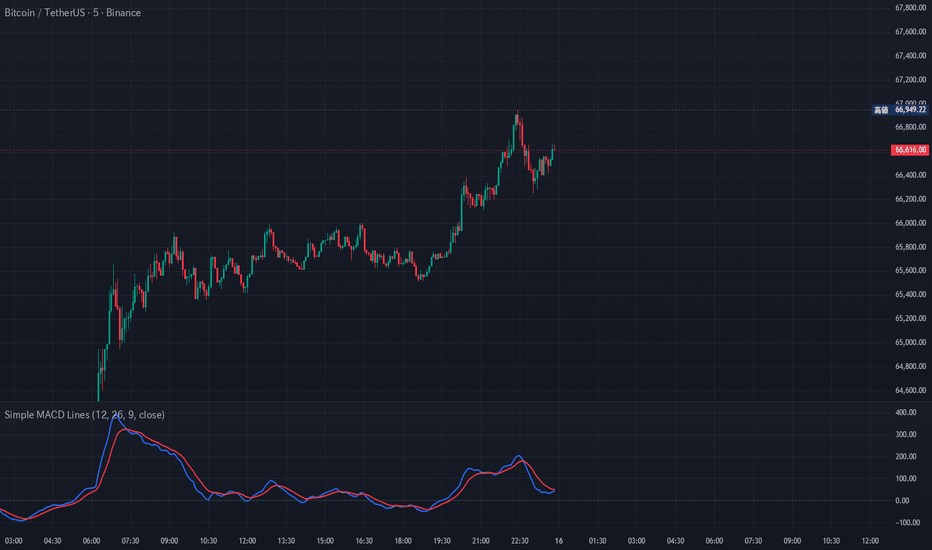
Simple MACD Lines█ OVERVIEW
This indicator displays only the MACD line and signal line — no histogram.
It sounds simple, but it solves a specific problem: when you try to set a price alert directly on a standard MACD indicator in TradingView, the histogram can interfere and make it hard to place the alert exactly where you want it.
With this indicator, there is nothing but the two lines, so alerts snap cleanly to the line positions.
█ HOW IT WORKS
• Calculates MACD using standard settings (12, 26, 9) — same math as the built-in MACD
• Plots the MACD line in blue and the signal line in red
• Includes a zero line for reference
• No histogram — cleaner chart, easier alert placement
█ HOW TO SET ALERTS
• Hover your cursor over one of the lines on the chart
• A "+" icon will appear — click it to set an alert at that exact price level
• Works well for zero line crosses, signal line crosses, or any custom level you want to watch
█ SETTINGS
• Fast Length — default 12
• Slow Length — default 26
• Signal Length — default 9
• Source — default close
All settings can be adjusted from the indicator's input panel. Colors can be changed from the Style tab.
█ NOTES
• This is a niche tool — if you just want to view MACD visually, the built-in TradingView MACD works fine
• Best used by traders who rely heavily on TradingView's alert system and want precise line-based alert placement
• Can be added as a separate pane alongside your existing indicators without interfering with them Indicateur
Indicateur
Indicateur

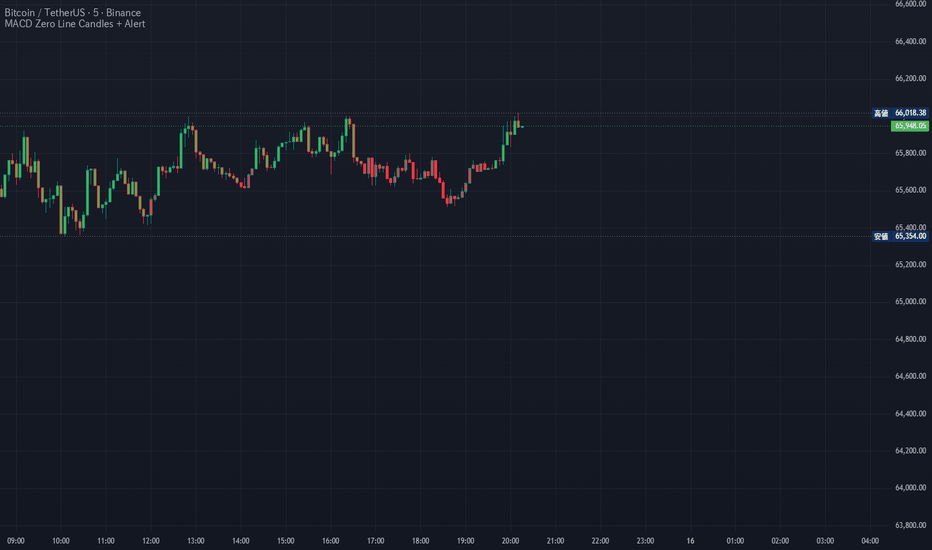
MAMA/FAMA Adaptive TrendMAMA/FAMA Adaptive Trend
1. Overview
MAMA/FAMA Adaptive Trend is an adaptive moving average indicator based on John Ehlers' MESA Adaptive Moving Average concept.
The indicator plots two adaptive lines:
* MAMA: the faster adaptive moving average
* FAMA: the slower following adaptive moving average
The tool is designed to help traders study adaptive trend state, trend transitions, and filtered MAMA/FAMA cross events directly on the price chart.
This is an indicator, not a strategy. It does not place orders, does not execute trades, and does not produce TradingView Strategy Tester backtest results. Entry and exit markers are visual chart events only and should not be treated as guaranteed trading signals or financial advice.
2. Core Idea
Traditional moving averages use fixed periods. MAMA/FAMA is different because it adapts its smoothing behavior according to the market's measured cycle and phase behavior.
When market phase changes quickly, MAMA can become more responsive.
When market movement is slower or steadier, MAMA can smooth more heavily.
FAMA follows MAMA using a slower adaptive response.
The relationship between MAMA and FAMA is used to define the current adaptive trend state:
* MAMA above FAMA suggests a bullish adaptive state.
* MAMA below FAMA suggests a bearish adaptive state.
3. MAMA and FAMA Lines
MAMA
MAMA is the faster adaptive line. It reacts more quickly to changes in price behavior.
FAMA
FAMA is the following adaptive line. It is slower than MAMA and provides a smoother reference.
MAMA/FAMA Fill
The area between MAMA and FAMA can be filled:
* Green fill suggests a bullish adaptive state.
* Red fill suggests a bearish adaptive state.
This fill is visual context only. It does not guarantee future price direction.
4. Adaptive Trend State
The indicator uses the position of MAMA relative to FAMA to define trend state.
Bullish state
A bullish adaptive state occurs when MAMA is above FAMA.
Bearish state
A bearish adaptive state occurs when MAMA is below FAMA.
The color of the MAMA line and the fill can change according to this state.
5. Entry Filters
The script includes entry filters designed to reduce weak crosses in sideways or noisy markets.
The entry filters are applied only to entry markers.
Exit markers use separate logic and are not blocked by the same entry filters.
Minimum MAMA/FAMA Gap Filter
This filter checks whether the distance between MAMA and FAMA is large enough relative to ATR.
The logic is based on:
MAMA/FAMA gap divided by ATR
If the gap is too small, the cross can be ignored as a weak entry event.
Default settings:
* Gap ATR length: 12
* Minimum gap in ATR: 0.05
MAMA Slope Filter
This filter checks the slope of MAMA.
A bullish entry requires MAMA to be rising.
A bearish entry requires MAMA to be falling.
This can help reduce entry markers during flat or unclear market conditions.
6. Entry Markers
The script can display filtered entry markers.
Bull Entry
A Bull Entry marker appears when MAMA crosses above FAMA and the entry filters pass.
Bear Entry
A Bear Entry marker appears when MAMA crosses below FAMA and the entry filters pass.
Important note
These markers are adaptive trend-state events. They are not guaranteed buy or sell signals.
7. Exit Markers
The script includes separate exit markers.
Exit Long
An Exit Long marker appears when the indicator is in a visual long state and MAMA crosses below FAMA.
This exit is not blocked by the entry filters.
Exit Short
An Exit Short marker appears when the indicator is in a visual short state and MAMA crosses above FAMA.
This exit is not blocked by the entry filters.
Why exit logic is separate
Entry filters can be useful for reducing weak entries, but exits often need to react faster.
For this reason, the script uses filtered logic for entries and raw opposite MAMA/FAMA crosses for exits.
8. Signal Marker Placement
Entry and exit markers are placed using ATR-based distance from candles.
This helps reduce marker overlap with price bars.
Users can adjust:
Signal distance from candles (ATR)
Increasing this value moves markers farther away from candles.
Decreasing this value places markers closer to candles.
9. Display Options
The script includes display settings for:
* Entry markers
* Exit markers
* MAMA/FAMA fill
* Optional background regime
The background regime is OFF by default to keep the chart clean.
10. Alerts
The script includes alert conditions for:
* Bull Entry
* Bear Entry
* Exit Long
* Exit Short
Alerts are notifications only. They do not place trades and do not confirm broker execution.
11. How to Use
A practical workflow:
1. Use the MAMA/FAMA lines to identify the adaptive trend state.
2. Look for green fill when MAMA is above FAMA.
3. Look for red fill when MAMA is below FAMA.
4. Use Bull Entry and Bear Entry markers as filtered adaptive cross events.
5. Use Exit Long and Exit Short markers as visual exit references.
6. Adjust the gap filter if too many or too few entry markers appear.
7. Adjust marker distance if entry or exit markers are too close to candles.
8. Combine the indicator with market structure, volume, support/resistance, and risk management.
9. Suggested Use Cases
MAMA/FAMA Adaptive Trend can be used for:
* Adaptive trend-state analysis
* Moving average trend filtering
* Trend transition study
* Visual trend-following context
* Exit reference based on opposite adaptive crosses
* Cleaner MAMA/FAMA cross visualization
13. Important Limitations
This indicator does not predict future price movement.
It does not guarantee profitable trades.
It is not a trading strategy.
It does not place orders.
It does not produce Strategy Tester results.
MAMA/FAMA crosses can whipsaw in sideways markets.
Adaptive moving averages can still lag during sharp reversals.
Entry and exit markers are visual events only.
A Bull Entry marker is not a guaranteed buy signal.
A Bear Entry marker is not a guaranteed sell signal.
Exit markers are not broker fills.
Users are responsible for their own trading decisions, risk management, and position sizing.
14. Originality and Purpose
MAMA/FAMA Adaptive Trend combines the MESA Adaptive Moving Average concept with cleaner TradingView visualization and practical signal filtering.
The script adds:
* Filtered entry markers
* Separate exit markers
* ATR-based marker spacing
* Optional fill between MAMA and FAMA
* Optional background regime
* Alerts for entry and exit events
* Cleaner chart output without a dashboard/table
The purpose of the indicator is to help traders study adaptive trend behavior in a simple and visually clear way.
15. Educational Disclaimer
This script is for educational and chart-analysis purposes only. It is not financial advice, investment advice, or a recommendation to buy or sell any financial instrument. Users should perform their own analysis and manage risk independently.
Indicateur

Indicateur
Indicateur

Indicateur

Indicateur

Indicateur
Stratégie

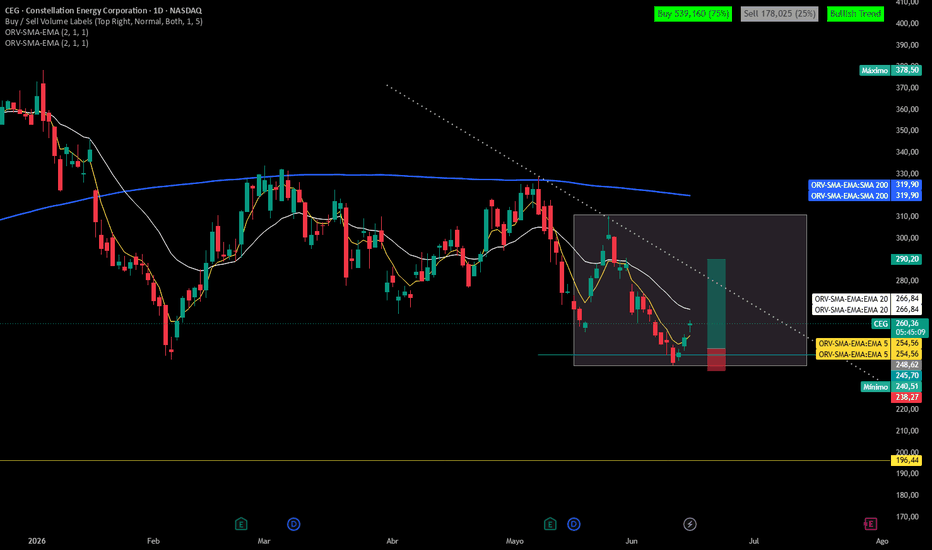
Yuri Garcia Narrow State Strategy (YGILS)Overview
The Yuri Garcia Institutional Liquidity Strategy (YGILS) is a trend-following and volatility-expansion methodology designed to identify high-probability trading opportunities during periods of market compression and directional momentum.
The strategy combines trend analysis, volatility measurements, momentum confirmation, and risk management into a structured framework that helps traders identify potential institutional participation while maintaining disciplined execution.
The primary objective is not to predict every market move, but rather to participate when multiple conditions align in favor of a directional expansion.
---
Strategy Philosophy
Markets alternate between periods of compression and expansion.
During compression, price contracts, volatility decreases, and market participants become indecisive.
During expansion, volatility increases, momentum accelerates, and directional opportunities emerge.
The strategy is specifically designed to identify the transition from low-volatility environments to high-volatility environments.
The Narrow State identifies compression.
The Elephant Bar identifies expansion.
The highest-quality opportunities typically occur when an Elephant Bar appears shortly after a period of compression and in the direction of the prevailing trend.
---
Core Components
Trend Identification
The strategy uses:
• 20 EMA (Short-Term Momentum)
• 200 SMA (Long-Term Trend)
Bullish Environment
✓ Price above 200 SMA
✓ 20 EMA above 200 SMA
Bearish Environment
✓ Price below 200 SMA
✓ 20 EMA below 200 SMA
This trend filter prevents traders from taking long positions against a bearish market and short positions against a bullish market.
---
Narrow State
A Narrow State occurs when the distance between the EMA 20 and SMA 200 contracts below a user-defined percentage threshold.
Formula:
Distance % = |EMA20 − SMA200| ÷ SMA200 × 100
The Narrow State represents a market compression phase.
Historically, significant market moves frequently begin after periods of compression.
The strategy seeks to participate during the transition from compression into expansion.
Important
The optimal Narrow State threshold depends on the instrument, timeframe, and market volatility.
Lower values produce stricter setups and fewer signals.
Higher values produce more signals but may increase market noise.
Traders are encouraged to optimize this setting based on the specific market being traded.
---
Elephant Bars
An Elephant Bar represents a significant expansion in volatility and directional conviction.
The candle body must exceed the Average True Range (ATR) multiplied by the Elephant Bar Multiplier selected by the user.
Formula:
Candle Body Size > ATR × Elephant Multiplier
Example
ATR = 20 points
Elephant Multiplier = 1.5
Required Body Size = 30 points
Any candle whose body exceeds 30 points is classified as an Elephant Bar.
---
Bullish Elephant Bar
Requirements:
✓ Bullish Candle
✓ Body exceeds ATR threshold
✓ Bullish Trend Active
Bullish Elephant Bars suggest aggressive buying pressure and potential institutional participation.
---
Bearish Elephant Bar
Requirements:
✓ Bearish Candle
✓ Body exceeds ATR threshold
✓ Bearish Trend Active
Bearish Elephant Bars suggest aggressive selling pressure and potential institutional participation.
---
Why Elephant Bars Matter
Institutional traders typically enter positions using significant volume and liquidity.
This often creates unusually large candles relative to recent market activity.
Elephant Bars help identify those moments where participation increases dramatically and may signal the beginning of a directional expansion phase.
---
RBI and GBI Confirmation Patterns
The strategy includes continuation confirmations.
RBI (Red Bar Ignored)
Bullish Continuation Pattern
Requirements:
• Previous candle closes bearish
• Current candle closes bullish
• Current candle closes above previous high
• Bullish trend remains active
This pattern suggests buyers have regained control.
---
GBI (Green Bar Ignored)
Bearish Continuation Pattern
Requirements:
• Previous candle closes bullish
• Current candle closes bearish
• Current candle closes below previous low
• Bearish trend remains active
This pattern suggests sellers have regained control.
---
Entry Conditions
Long Positions
A BUY signal occurs when:
✓ Bullish Trend Active
✓ Narrow State Active
✓ Bullish Elephant Bar OR RBI Pattern
✓ No Existing Long Position
---
Short Positions
A SELL signal occurs when:
✓ Bearish Trend Active
✓ Narrow State Active
✓ Bearish Elephant Bar OR GBI Pattern
✓ No Existing Short Position
---
Risk Management
The strategy uses ATR-based stop loss calculations that automatically adapt to changing market volatility.
Formula:
Stop Loss = Entry ± ATR × Multiplier
This helps maintain consistent risk management across different instruments and market conditions.
---
Take Profit Logic
The strategy uses configurable Risk-to-Reward ratios.
Formula:
Target = ATR × Multiplier × Risk Reward Ratio
Example:
Risk = 50 points
Target = 100 points
Reward Ratio = 2:1
This allows traders to maintain a structured and repeatable approach to position management.
---
Inputs and Customization
ATR Length
Controls volatility calculations.
Higher values create smoother signals.
Lower values create faster reactions.
---
ATR Multiplier
Controls stop-loss distance.
Higher values provide more room for volatility.
Lower values create tighter risk control.
---
Risk Reward Ratio (RRR)
Controls profit target distance relative to stop-loss distance.
Common values:
• 2.0
• 3.0
• 4.0
---
Elephant Bar Multiplier
Controls how large a candle must be before being classified as an Elephant Bar.
Higher values:
• Fewer signals
• Stronger momentum requirements
Lower values:
• More signals
• Faster entries
---
Narrow State Percentage
Controls how close the EMA 20 and SMA 200 must be before a compression phase is recognized.
Smaller values:
• Stricter setups
• Higher selectivity
Larger values:
• More opportunities
• Increased signal frequency
---
Best Practice
The strategy performs best when used as a confirmation tool rather than a prediction tool.
Wait for trend alignment.
Wait for compression.
Wait for volatility expansion.
Then execute according to the rules.
Patience and discipline are often more important than prediction.
The market rewards consistency more than excitement.
---
Disclaimer
This strategy is intended for educational and research purposes only.
Past performance does not guarantee future results.
Always perform your own testing, validation, and risk management before trading live capital. Stratégie

ASX 200 Breadth - % Above MAASX 200 Breadth - % Above MA
Overview
This indicator measures market breadth for the ASX 200 by tracking the percentage of a representative basket of 40 large- and mid-cap ASX-listed stocks trading above a chosen moving average. It helps gauge whether strength (or weakness) in the index is broad-based across the market or concentrated in just a handful of large stocks.
How It Works
- Pine Script limits a single indicator to 40, so true 200-stock breadth isn't possible directly. Instead, this script uses a diversified 40-stock sample spanning the major ASX sectors:
- Financials: CBA, NAB, WBC, ANZ, MQG, SUN, QBE, IAG, ASX
- Materials/Resources: BHP, RIO, FMG, S32, NEM, STO, WDS
- Healthcare: CSL, RMD, COH, SHL, PME
- Consumer: WES, WOW, COL, TWE, JHX, AMC
- Industrials/Infrastructure: TCL, APA, BXB, CPU
- Property (REITs): GMG, SCG, MGR, VCX
- Tech/Other: XRO, REA, ALL, ORG
- For each stock, the script checks whether the current closing price is above its 20-, 50-, 100-, and 200-period Simple Moving Average (SMA).
- The indicator then plots the percentage of the basket trading above each selected MA, e.g. a reading of 75% on the 50-day line means 30 of the 40 sample stocks are above their 50-day SMA.
Inputs
- MA to Display: Choose which breadth line(s) to show - 20, 50, 100, 200, or All (shows all four together). Default: All
- Overbought Level: Upper reference line - readings above this suggest broad-based strength / potential overextension. Default: 80
- Oversold Level: Lower reference line - readings below this suggest broad-based weakness / potential capitulation. Default: 20
Reading the Indicator
- **Above 50%**: more than half the sample is trending above the selected MA — generally bullish breadth.
- **Below 50%**: more than half the sample is trending below the selected MA — generally bearish breadth.
- **Near 80%+ (Overbought)**: market strength is broad and stretched — watch for breadth divergences if price keeps rising but this line rolls over.
- **Near 20% or below (Oversold)**: broad-based weakness — often associated with capitulation lows or the start of a recovery once breadth turns back up.
- **Divergences**: if the ASX 200 index makes a new high/low but breadth fails to confirm (doesn't reach a corresponding extreme), it can signal weakening participation behind the move.
- **Multiple timeframes ("All")**: comparing the 20-day line against the 100/200-day lines shows whether short-term moves are aligned with the longer-term trend — e.g., a sharp pop in the 20-day line while the 200-day line stays low suggests a short-term bounce within a longer downtrend.
Notes & Limitations
- This is a **sample-based proxy** for ASX 200 breadth, not an exact count across all 200 constituents — actual index breadth may differ, especially when small-caps move independently of large-caps.
- All four MA lengths are calculated from a single data request per stock, so adding more MA options does not increase the symbol count or hit Pine's 40-symbol request limit.
- Works on any timeframe — the moving averages are calculated on that chart's timeframe (e.g., daily MAs on a daily chart, weekly MAs on a weekly chart). Indicateur

Indicateur

EMA's, VWAP, Inside Day, SlingshotEMA's, VWAP, Slingshot & Inside Day
An all-in-one price action overlay combining four tools:
🔹 4 Customizable EMAs — Default lengths 5, 8, 20 & 50. Adjust lengths in Settings, colors in the Style tab.
🔹 VWAP — Only displays on intraday timeframes. Auto-hides on daily and above.
🔹 Slingshot — Uses an EMA of highs rather than closes, making it a tougher level to break above. When price closes above it after 3 consecutive bars below, it signals a momentum shift — like a slingshot snapping back. Paints the bar, plots a marker, and includes an alert.
🔹 Inside Day — Highlights bars fully contained within the prior bar's range. Indicateur

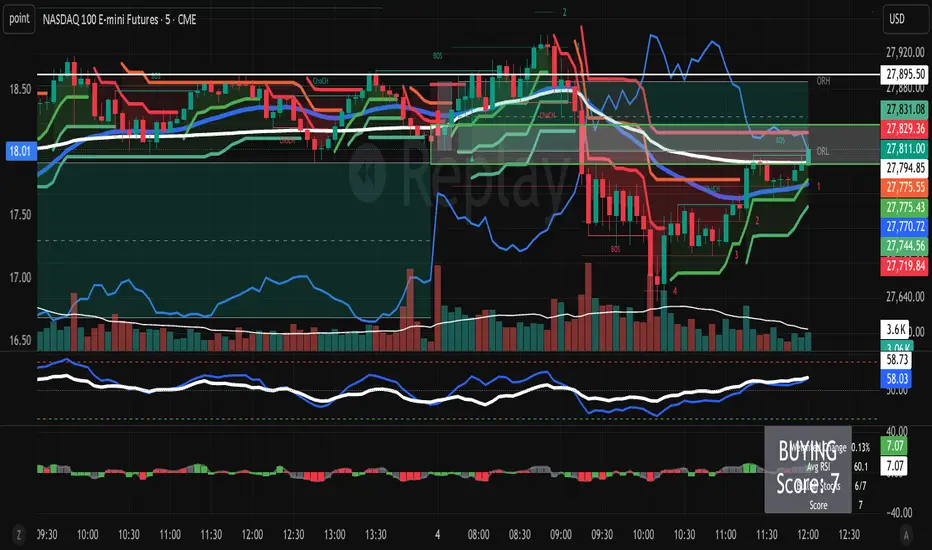
Momentum Conviction [HermesCore]WHAT THIS INDICATOR DOES
Momentum Conviction watches two things at the same moment: where price momentum turns, and how much agreement stands behind that turn. The turn is an EMA crossover — the fast EMA (Exponential Moving Average) crossing the slow one — but only when the MACD histogram (Moving Average Convergence Divergence, a standard momentum gauge) is leaning the same way. A LONG fires when the fast EMA crosses above the slow EMA while MACD momentum is positive; a SHORT is the exact mirror. A cross with no momentum behind it is ignored.
Every signal that does fire is then graded 0 to 5 by a conviction score, built from five independent checks the moment the signal prints. You decide how much conviction you require: show every signal, or raise the minimum and keep only the ones with weight behind them.
WHY IT IS DIFFERENT
Most moving-average tools print an arrow on every cross and leave you to separate the real ones from the noise by eye. My rules are:
A cross is not a signal on its own. It has to happen while MACD momentum agrees. A large share of the crosses that fail are crosses that fired into flat or opposing momentum; gating on the histogram removes them before they ever reach the chart.
The score is a filter, not decoration. It is not a confidence label added after the fact — it is five yes/no facts, known at signal time, summed. Set a minimum and the weak signals never appear.
The higher timeframe gets a vote, not the final word. One of the five points is HTF agreement, so you can weigh it without being ruled by it.
ADX is deliberately excluded. I tested it repeatedly on the charts this was built for and it did not earn a place.
Everything updates on confirmed bars only. No intrabar flicker, no repainting, and the higher-timeframe reads use no look-ahead.
HOW TO READ THE CHART
LONG bubble (green, below the bar) and SHORT bubble (red, above it) mark each qualifying signal. Bubble size is adjustable.
The gradient EMA cloud is aqua when the fast EMA sits above the slow one (uptrend lean) and magenta when below. The slow EMA carries a soft gold glow so the spine of the trend is always easy to find.
A faint background tint colours the whole pane in the trend colour — a peripheral regime cue, nothing to act on by itself.
A faint gold background band shows the previous day's and previous week's range, for context on where price sits inside the larger structure.
THE CONVICTION SCORE
Each check is worth one point, decided at signal time, and never changes afterwards:
Momentum strength — the MACD histogram is larger than its own 50-bar average: the push is bigger than this market's normal push. +1
Slope agreement — the fast EMA is itself moving in the signal's direction, not merely crossing. +1
Higher-timeframe trend — the chosen HTF (4H by default) is trending the same way; its price and 50/200 EMAs agree. +1
Not over-extended — price is within a set ATR (Average True Range, a volatility measure) distance of the slow EMA, so you are not entering after the move has already run. +1
RSI room — RSI (Relative Strength Index, 0–100) is not already at an extreme in the signal's direction; there is room left to travel. +1
Five of five is a cross with bigger-than-normal momentum, sloping the right way, aligned with the higher timeframe, entered near value, with room to run. Zero is a bare cross with nothing behind it. The minimum-score input is where you set your own bar.
HOW I USE IT
The defaults are deliberately fast (EMA 2/12) — a low-timeframe, many-signals setting. Slow the lengths down for swing work and you get fewer, heavier signals.
I treat a high-score signal that agrees with the higher timeframe as the one worth acting on, and a low-score signal as information about the tape rather than a trade. The honest part: this is trend and momentum logic. It earns its keep when the market trends and gives a good deal of it back in ranges. The regime tint and the HTF vote exist to keep you on the right side of that question, not to solve it — be honest with yourself about which regime you are actually in.
SETTINGS THAT MATTER
EMA fast/slow and MACD lengths — the engine. Defaults are fast; raise them for higher timeframes and fewer, heavier signals.
Minimum score (0) — your conviction bar. 0 shows everything; raise it to thin the chart to signals with agreement behind them.
Higher timeframe (4H) — the trend you check against. Match it to your horizon.
Max distance to slow EMA (2.0 ATR) — how far from value still counts as "not over-extended."
RSI overbought/oversold (72/28) — the "room left" thresholds.
Each score component can be switched off individually if you want to see what it contributes on its own.
ALERTS
Momentum Conviction LONG and Momentum Conviction SHORT, both firing on the confirmed close of the signal bar, with ticker and timeframe in the message.
CALCULATION DETAILS
All logic evaluates on confirmed bars. A signal cannot appear or disappear inside a forming candle.
The trigger is the fast/slow EMA cross; the gate is the sign of the MACD histogram on the same close.
The higher-timeframe trend uses that timeframe's prior-bar close and 50/200 EMAs, requested with no look-ahead, so it does not repaint.
The conviction score is computed once, at signal time, from the values listed above.
HONEST LIMITATIONS
This is trend-following momentum. In a range it will cross back and forth and hand gains back; no filter removes that, it only thins it.
The score is a hypothesis about signal quality, not a measured edge. This indicator does not keep score for you. If you want to know whether higher scores actually perform better on your symbol, run the matching strategy version in the Strategy Tester with realistic costs and read the result yourself.
The defaults trade often. On a live account, slippage and spread on frequent entries matter more than the chart suggests — cost everything before you believe anything.
Signals are evaluated at the close; real fills happen later and worse. Treat the chart as the ideal case.
It runs on any symbol and timeframe, but "runs" is not "has an edge" — whether it works on your market is yours to verify. Past behaviour is not the next signal.
Not financial advice. It manages no positions and places no orders.
ORIGINALITY
The ingredients — EMA crosses, MACD, RSI, ATR — are as old as charting. The momentum-gated trigger, the five-factor conviction score and its use as a hard filter, the regime-aware visual language and the non-repaint construction are my own work in Pine v6. Every value the script uses is recomputable from the rules above.
Questions and suggestions are welcome in the comments. Enjoy. Indicateur

Indicateur

Fractal Regime Engine (FRPE)🚀 Fractal Regime Engine (FRPE)
The FRPE (Fractal Regime Engine) is an advanced, quantitative market regime oscillator designed to identify structural transitions between trend expansion, mean reversion compression, and neutral market equilibrium in real time. Built on a multi-scale fractal scaling framework, volatility-normalized logarithmic relationships, and adaptive statistical compression, this indicator reconstructs market behavior through regime dynamics rather than price direction alone.
Unlike conventional momentum oscillators that rely on lagging price derivatives, FRPE models the *structural complexity of market behavior* by comparing fractal scaling differences across multiple time horizons. This allows the detection of regime shifts that occur before they become visually apparent on price charts.
The result is a bounded, adaptive regime signal that clearly distinguishes when the market is expanding directionally, compressing into equilibrium, or transitioning between structural phases of uncertainty.
💡 Key Features
🧠 Multi-Scale Fractal Engine:
FRPE evaluates market structure across short, mid, and long-term windows simultaneously. By measuring fractal scaling divergence between these timeframes, the system isolates structural drift in market behavior rather than simple price movement.
📊 Fractal Drift Model:
The core signal is derived from the differential relationship between short-term and long-term fractal scaling behavior. This creates a robust measure of regime imbalance that reflects the underlying geometry of market activity.
🔬 Volatility-Normalized Log Scaling:
Price range behavior is normalized against ATR-based volatility scaling using logarithmic transformation. This ensures that the signal remains consistent across different asset classes and volatility regimes.
⚡ Adaptive Oscillator Compression:
All raw outputs are transformed into a bounded oscillator (-100 to +100) using dynamic scaling logic. This enables consistent interpretation across all market conditions without recalibration.
🛡️ Percentile-Based Dynamic Thresholds:
Instead of fixed levels, FRPE uses rolling percentile bands to define regime boundaries. This ensures that signal sensitivity adapts automatically to changing market environments.
📉 Three-State Regime Classification:
FRPE categorizes market behavior into three structural phases:
* Expansion Regime (Trend Continuation / Directional Imbalance)
* Compression Regime (Mean Reversion / Liquidity Equilibrium)
* Transition Regime (Structural Uncertainty / Regime Shift Zone)
🔬 Mathematical Logic and Structure
FRPE is built on a multi-layer fractal decomposition model that transforms raw market data into a structured regime oscillator.
The process begins by calculating a fractal scaling proxy based on the logarithmic relationship between price range expansion and volatility-adjusted ATR scaling. This creates a normalized measure of how efficiently price is expanding relative to its underlying volatility structure.
To capture structural differences across time horizons, the system computes fractal scaling values across short, mid, and long windows. The divergence between short-term and long-term behavior forms the core “fractal drift” signal, which represents directional structural imbalance in market dynamics.
This drift signal is then amplified and normalized into a bounded oscillator space (-100 to +100), allowing direct interpretation of regime intensity. Positive values indicate structural expansion and trending behavior, while negative values indicate compression and mean-reverting pressure.
To eliminate noise and microstructure distortion, the signal is smoothed using exponential moving averaging, ensuring that only statistically relevant regime transitions are preserved.
Finally, adaptive percentile-based thresholds dynamically define regime boundaries based on recent historical distribution. This removes dependency on static parameters and ensures robustness across different volatility environments.
In essence, FRPE does not track price direction. It reconstructs the *structural evolution of market complexity across time scales* and translates it into a unified regime map of expansion, compression, and transition.
🛠️ How to Use
1. Expansion Regime (Positive Extremes):
Indicates strong directional structure and increasing trend persistence. Breakout continuation strategies are statistically favored.
2. Compression Regime (Negative Extremes):
Represents equilibrium or absorption phases where mean reversion behavior dominates. Range-bound strategies tend to perform better.
3. Transition Regime (Neutral Zone):
Signals structural uncertainty and regime instability. Market conditions are non-directional and require caution.
🎛️ Settings
* Short Window (10): High-frequency structural sensitivity
* Mid Window (30): Core regime stability filter
* Long Window (100): Macro structural reference baseline
* Smoothing Length (5): Signal stabilization layer
📌 Credits and Origins
FRPE is engineered by gunebak4n as a structural market regime framework built on multi-timeframe fractal scaling dynamics, volatility-normalized logarithmic relationships, and adaptive statistical compression. The model is designed to move beyond traditional momentum-based oscillators and instead reconstruct underlying market behavior through regime transitions driven by fractal divergence across time horizons.
The model is optimized for discretionary traders, quantitative analysts, and systematic trading workflows that prioritize regime awareness over directional prediction.
⚠️ Disclaimer
All outputs generated by FRPE are probabilistic and non-deterministic. This indicator does not predict market direction or guarantee outcomes. It is a structural analysis tool intended to support decision-making under uncertainty. Proper risk management remains essential at all times.
Indicateur

Stratégie

Indicateur

Indicateur
NORN WEAVE | THURISAZ# NORN WEAVE ᚦ THURISAZ
---
### Overview
NORN WEAVE ᚦ THURISAZ is the third version of the NORN WEAVE series, built on URUZ as its foundation.
The core logic is unchanged — EMA slope, Dow Theory swing structure, ADX trend confirmation. What changed is the entry filter. THURISAZ adds one question before every trade: *where are we standing on the daily chart?*
URUZ was built to survive. THURISAZ is built to choose. Bad entries don't just lose money — they consume time, margin, and mental bandwidth. The goal of this version is to stop entering trades that look right on the current timeframe but are wrong on the bigger picture.
The philosophy remains: survival first, profit second. THURISAZ adds a third principle — *don't enter where you shouldn't be standing.*
---
### What's New: Daily Fibonacci Filter
THURISAZ introduces a daily timeframe Fibonacci filter as a structural context layer.
When the current timeframe trend and the daily trend align, the strategy behaves exactly like URUZ — no additional friction.
When they diverge, THURISAZ evaluates *where* price sits within the daily swing range using Fibonacci retracement levels (0.382 and 0.618):
- **Mid zone (0.382–0.618)** — Price is in the middle of the daily range. This is the "landing zone": the most likely area for a pullback to stall and reverse, not complete. Entries are blocked.
- **Shallow zone (below 0.382)** — The pullback is still early. Entry is allowed, but TP1 is adjusted to the 0.382 level rather than the standard ATR-based target. Partial profit is taken before the natural resistance zone.
- **Deep zone (above 0.618)** — Price has retraced significantly. Potential reversal territory. Entry is allowed with standard targets.
The daily swing detection period is independently configurable from the current timeframe's Focus Level, giving finer control over what constitutes a "daily swing."
---
### Entry Conditions
**Long:** EMA rising AND Dow Theory trend up AND ADX above threshold AND Daily Fibo zone allows AND Footprint Delta bullish (if filter enabled)
**Short:** EMA falling AND Dow Theory trend down AND ADX above threshold AND Daily Fibo zone allows AND Footprint Delta bearish (if filter enabled)
---
### Exit Conditions
- TP1 — ATR × Factor × 1 → closes 30% (or Fibo 0.382 if shallow counter-trend entry)
- TP2 — ATR × Factor × 2 → closes another 30%
- TP3 — ATR × Factor × 3 → closes a further 30%
- Stop Loss — fixed % from entry → closes full position
- Break Even Stop — once floating profit reaches the BE trigger %, stop moves to entry price and closes on pullback
- Trend Reversal — when Dow Theory swing flips → closes full position
---
### Focus Level & Auto Calibration
Unchanged from URUZ. Focus Level is the primary knob — adjust it first when applying to a new symbol or timeframe.
Auto Calibration computes ADX threshold, ATR factor, and Stop Loss from the chart's own volatility data. When enabled, no manual tuning is required.
---
### Break Even Stop
Unchanged from URUZ. One parameter: how far price must move from entry before the stop activates. Stop is always placed at entry price.
---
### Footprint Delta Filter *(Premium plan required)*
Unchanged from URUZ. Uses BTC or ETH footprint delta as a directional confirmation filter. Blocks entries when order flow contradicts the trade direction.
---
### Parameters
- **Focus Level** (default 13) — Main knob. Controls swing detection and EMA scaling.
- **EMA Scale Ratio** (default 5) — EMA length = Focus Level × this value.
- **Daily Swing Length** (default 10) — Swing detection period for the daily timeframe. Independent from Focus Level.
- **Show Daily Fibo Zone** (default ON) — Displays the 0.382 and 0.618 levels on the chart for visual reference.
- **Auto Calibration** (default ON) — Computes ADX threshold, ATR factor, and SL automatically.
- **BE Trigger %** (default 5.5%) — How far price must move before the BE stop activates.
- **ATR Factor** — Manual mode only. Default 3.8.
- **Stop Loss %** — Manual mode only. Default -10.0%.
- **ADX Threshold** — Manual mode only. Default 20.5.
- **Footprint SMA Period** (default 21) — Smoothing period for delta signal.
---
### On Overfitting
One of the design principles of the NORN WEAVE series has been to minimize the number of configurable parameters. More parameters means more room to fit historical data — and less reason to trust that the results will hold going forward.
THURISAZ adds one new parameter: Daily Swing Length. That's it.
The Fibonacci levels themselves (0.382 and 0.618) are not parameters — they are fixed, widely recognized structural levels used by traders across markets and timeframes. They were not chosen by optimizing against backtest data.
The Daily Fibonacci Filter was validated across six symbols (SOL, DOGE, ETH, SUI, NEAR, PEPE). Five of the six showed improvement in profit factor and drawdown. The one exception — PEPE — deteriorated, which is the expected behavior: PEPE's explosive, non-structural price action doesn't respect daily swing context the way trend-following instruments do. A filter that improves everything uniformly would be suspicious. This result is not.
The filter works because the idea behind it is sound, not because it was tuned to work.
---
### Visual Guide
- **EMA line** — 3-layer glow. Teal when rising, red when falling.
- **Dow Theory zones** — gradient fill from current swing level to current price.
- **Daily Fibo lines** — gold lines at 0.382 and 0.618 of the daily swing. Shaded zone between them marks where entries are blocked.
- **TP lines** — semi-transparent. TP1 faintest, TP3 most visible.
- **BE Stop line** — gold, appears only when active.
- **Gray background** — ADX below threshold. No entries.
- **Orange background** — Footprint Delta Filter blocking entry, or Daily Fibo mid zone active.
- **Status table** — real-time display of all conditions. Japanese/English toggle included. Daily Fibo status shown as: Same Dir / Mid Zone (blocked) / Shallow (TP adjusted) / Deep (reversal watch).
---
---
### 概要
NORN WEAVE ᚦ THURISAZ は、URUZを土台とした NORN WEAVE シリーズ第3バージョンです。
コアロジックは変わっていません——EMAの傾き・ダウ理論のスイング構造・ADXトレンド確認。変わったのはエントリーフィルターです。THURISAZは、すべてのトレードの前に一つの問いを加えます。*日足でみたとき、今どこに立っているのか?*
URUZは「生き残る」ために設計されました。THURISAZは「選ぶ」ために設計されています。悪いエントリーは資金を失うだけでなく、時間・証拠金・集中力を消費します。このバージョンの目標は、現在足ではシグナルが正しく見えても、大きな地形では立ってはいけない場所へのエントリーを止めることです。
哲学は変わっていません。まず生き残る、利益はその次。THURISAZは三つ目の原則を加えます——*立つべきでない場所には立たない。*
---
### 追加機能:日足フィボフィルター
THURISAZは、相場の地形を把握するための「日足フィボナッチフィルター」を新たに導入しました。
現在足のトレンドと日足のトレンドが同じ方向の場合、ストラテジーはURUZとまったく同じ挙動をします——追加の制約はありません。
方向が逆の場合、THURISAZはフィボナッチリトレースメント水準(0.382・0.618)を使い、日足スイングのどの位置に価格があるかを評価します。
- **中間ゾーン(0.382〜0.618)** — 価格が日足レンジの真ん中にある状態。「踊り場」と呼ぶべき位置で、押し目・戻しが途中で止まって反転する可能性が最も高い。エントリーをブロックします。
- **浅いゾーン(0.382以下)** — 押し目・戻しがまだ浅い段階。エントリーは許可しますが、TP1を通常のATRベースから日足フィボ0.382水準に調整します。自然な抵抗ゾーンの手前で部分利確します。
- **深いゾーン(0.618以上)** — 大きく押し込まれた位置。反転の可能性がある水準として通常通りエントリーします。
日足のスイング検出期間は現在足のフォーカスレベルとは独立して設定できます。
---
### エントリー条件
**ロング:** EMA上向き AND ダウ理論上昇 AND ADXしきい値以上 AND 日足フィボゾーン許可 AND フットプリントデルタ買い優勢(フィルター有効時)
**ショート:** EMA下向き AND ダウ理論下降 AND ADXしきい値以上 AND 日足フィボゾーン許可 AND フットプリントデルタ売り優勢(フィルター有効時)
---
### イグジット条件
- TP1 — ATR×倍率×1 → 30%決済(逆張り・浅いゾーン時はフィボ0.382水準)
- TP2 — ATR×倍率×2 → さらに30%決済
- TP3 — ATR×倍率×3 → さらに30%決済
- ストップロス — エントリーから設定%に達したら全決済
- ブレークイーブンストップ — 含み益がBE発動しきい値%に達したらストップが建値に移動。価格が戻ったら全決済
- トレンド反転 — ダウ理論スイングが逆転した時点で全決済
---
### フォーカスレベルとオートキャリブレーション
URUZから変更なし。フォーカスレベルが主軸ノブです。新しい銘柄・時間足に適用するときはここを最初に調整してください。
オートキャリブレーションをONにすると、ADXしきい値・ATR倍率・SLがチャートのボラティリティデータから自動算出されます。
---
### ブレークイーブンストップ
URUZから変更なし。設定項目は一つ——「何%動いたら発動するか」だけ。ストップ位置は常に建値です。
---
### フットプリント・デルタフィルター *(Premiumプラン以上が必要)*
URUZから変更なし。BTCまたはETHのフットプリントデルタを方向性確認フィルターとして使用します。
---
### パラメーター
- **フォーカスレベル**(デフォルト13)— 主軸ノブ。スイング検出・EMAスケールを制御。
- **EMAスケール倍率**(デフォルト5)— EMA期間 = フォーカスレベル × この値。
- **日足スイング検出期間**(デフォルト10)— 日足フィボ計算に使うスイング検出期間。フォーカスレベルとは独立。
- **日足フィボゾーン表示**(デフォルトON)— 0.382・0.618ラインをチャートに表示。
- **オートキャリブレーション**(デフォルトON)— ADXしきい値・ATR倍率・SLを自動算出。
- **BE発動しきい値%**(デフォルト5.5%)— エントリーからこの%動いたらBEストップが発動。
- **ATR倍率**(手動)— オートキャリブレーションOFF時に有効。デフォルト3.8。
- **損切り%**(手動)— オートキャリブレーションOFF時に有効。デフォルト-10.0%。
- **ADXしきい値**(手動)— オートキャリブレーションOFF時に有効。デフォルト20.5。
- **フットプリントSMA期間**(デフォルト21)— デルタシグナルの平滑化期間。
---
### 過剰最適化について
NORN WEAVE シリーズの設計方針の一つは、パラメーター数をできる限り減らすことでした。パラメーターが増えるほど過去データへの過剰適合が起きやすくなり、将来の結果を信頼する根拠が薄れるからです。
THURISAZで追加したパラメーターは「日足スイング検出期間」の一つだけです。
フィボナッチ水準(0.382・0.618)自体はパラメーターではありません——バックテストデータを最適化して選んだ値ではなく、多くのトレーダーが長年にわたって参照してきた普遍的な構造水準です。
日足フィボフィルターは6銘柄(SOL・DOGE・ETH・SUI・NEAR・PEPE)で検証しました。そのうち5銘柄でPFとDDが改善しました。唯一悪化したのはPEPEですが、これは想定内の結果です——PEPEの急騰急落型の値動きは日足スイング構造を参照するロジックとそもそも相性が悪い。すべての銘柄で一様に改善するフィルターの方が、むしろ過剰最適化を疑うべきです。
このフィルターが機能するのは、チューニングの結果ではなく、背後にある考え方が正しいからだと考えています。
---
### チャートの見方
- **EMAライン** — 3層グロー効果。上向きはティール、下向きはレッド。
- **ダウ理論ゾーン** — 現在のスイングレベルから現在価格へのグラデーション。
- **日足フィボライン** — 日足スイングの0.382・0.618をゴールドラインで表示。その間のシェードが「踊り場ゾーン(エントリーブロック)」。
- **TPライン** — 半透明。TP1が最も薄く、TP3が最も濃い。
- **BEストップライン** — ゴールド。発動中のみ表示。
- **グレー背景** — ADXがしきい値以下。エントリーなし。
- **オレンジ背景** — フットプリントデルタフィルターがブロック中、または日足フィボ踊り場ゾーンが有効。
- **ステータステーブル** — 全条件・パラメーター値をリアルタイム表示。日英切り替え対応。日足フィボの状態は「同方向 / 踊り場(ブロック)/ 浅い(TP調整)/ 深い(反転狙い)」で表示。 Stratégie

Indicateur
Indicateur