O'Neil Climax Top Detector█ OVERVIEW
O'Neil Climax Top Detector plots the percentage distance of a price source from its simple moving average in a separate pane and flags the bars where three conditions associated with a climax top occur together: the price is extended into an upper band, it has run up rapidly over a short window, and the bar carries record volume. The histogram measures extension; the flag identifies where extension, runup, and volume coincide.
█ HISTORY / BACKGROUND
The components are drawn from William J. O'Neil's discussion of climax (blow-off) tops in How to Make Money in Stocks . O'Neil described a stock trading 70% to 100% or more above its 200-day moving average line (4th edition, page 264), a rapid price runup over roughly two to three weeks, and heavy volume on the advance as markers of a late-stage move. O'Neil presented these as qualitative, infrequently decisive sell pointers for individual growth leaders on the daily chart, not as a mechanical signal. This script operationalizes that description as a single bar-level test.
█ HOW IT WORKS
On the chart timeframe the script computes, for each bar:
- The distance from the average: the simple moving average of the source over SMA Length , then percentage distance as (source minus average) divided by average, times 100. This is the histogram.
- The extension condition: the distance is at or above the lower band. In fixed mode the band is the Fixed lower / upper band inputs (70 and 100). In adaptive mode the band is the symbol's own mean distance plus a number of standard deviations ( Adaptive lower / upper ) over Adaptive lookback .
- The runup condition: the source's percentage gain over Runup lookback bars is at or above Min runup over lookback .
- The volume condition: the bar's volume is a new high over Volume record lookback bars. When Require record-volume condition is off, this term is dropped.
A climax bar is the conjunction of all active conditions:
climax = extCond and runCond and volTerm
Climax bars are recolored on the histogram and marked with a vertical line spanning the pane. Two alert conditions are exposed: one for the full climax conjunction, one for the distance reaching the lower band.
█ HOW TO USE
Apply on the daily chart, the resolution on which O'Neil's band and runup window are defined. Read the histogram as the degree of extension above or below the average: bars above zero trade above the average, bars below zero trade below it. The lower and upper band lines bound the extension zone. A recolored bar with a vertical line marks where extension, runup, and volume align on the same bar. Treat a flag as a candidate for review of a late-stage move, not as an instruction.
█ SETTINGS
- Source : series used for the average and the distance. Default close.
- SMA Length : period of the simple moving average. Default 200.
- Extension band mode : fixed O'Neil 70/100 band, or per-symbol adaptive band. Default fixed.
- Fixed lower / upper band : the band in fixed mode. Defaults 70 and 100.
- Adaptive lookback : window for the adaptive band statistics. Default 504.
- Adaptive lower / upper : standard deviations above the mean distance defining the adaptive band. Defaults 2.0 and 3.0.
- Runup lookback : bars over which the runup is measured. Default 10.
- Min runup over lookback : minimum percentage gain to satisfy the runup. Default 25.
- Require record-volume condition : include the volume term. Default on.
- Volume record lookback : window over which the bar's volume must be the highest. Default 50.
█ WHAT MAKES IT ORIGINAL
A plain distance-from-moving-average histogram only shows extension. This script requires extension, a rapid runup, and record volume to coincide on the same bar before it flags, which is the conjunction O'Neil described qualitatively but is not present in a single distance plot. The adaptive band is a further departure: O'Neil's 70 to 100 figure is calibrated to growth leaders and is rarely reached on indices or low-volatility instruments, so the script can replace the fixed band with one derived from the symbol's own distance distribution, extending the concept beyond the instrument class it was written for.
█ NOTES / LIMITATIONS
- Insufficient history: the average needs SMA Length bars, the adaptive band needs Adaptive lookback bars, and the runup needs Runup lookback bars. Until those windows fill, the corresponding output is na and no flag appears.
- Volume-free symbols: on instruments without volume the record-volume term resolves to na and nothing flags. Turning off Require record-volume condition runs the extension and runup pair only, a weaker two-condition test.
- Timeframe: the default band and runup window reflect O'Neil's daily-chart definition. On other resolutions the thresholds keep their numeric values but lose their reference meaning.
- Symbol class: the fixed band reflects individual growth-stock behavior. Use adaptive mode for indices, large-cap averages, and low-volatility instruments.
- Real-time bars: conditions confirm on bar close. On the forming bar a flag and its line can appear and disappear as price and volume change until the bar closes. Historical flags do not change.
- No higher-timeframe data: all computation is on the chart timeframe with no request.security and no lookahead.
- Object ceiling: the script retains up to 500 vertical lines. On long histories the oldest markers are dropped as new ones are added.
- The default thresholds are conceptual settings consistent with O'Neil's description, not optimized or validated values. Indicateur

Indicateur

Stratégie
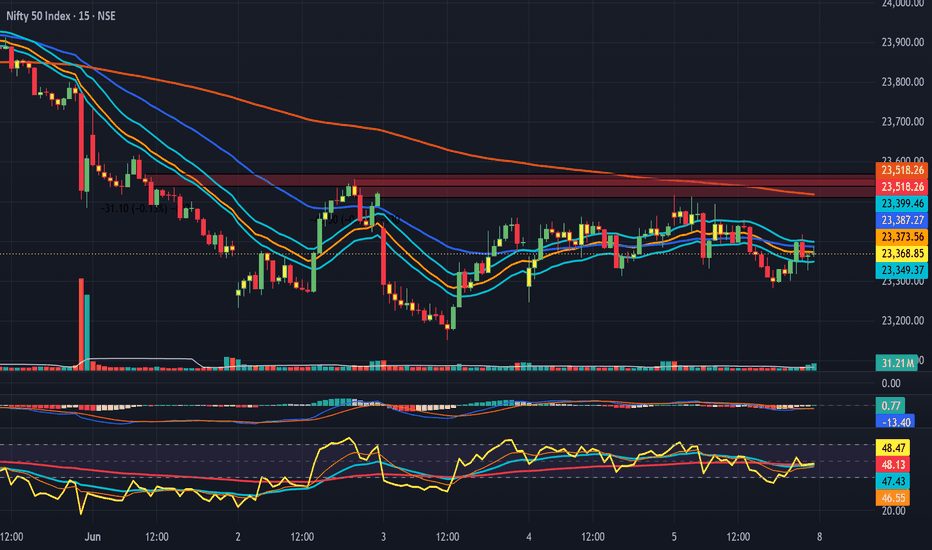
SCALP AIThis script is a collection of various trading concepts and indicators integrated into a single Pine Script file. I would like to express my sincere gratitude to the original authors whose work, ideas, and components made this compilation possible.
Core Functionalities
Dashboard & AI Scoring System:
Features a configurable dashboard showing real-time market data.
Uses a proprietary scoring mechanism based on trend analysis (EMA 20/200), RSI, volume, VWAP, ADX, and Multi-Timeframe (MTF) alignment to output signals ("A+ SETUP" to "NO TRADE").
Trend & Filter Analysis:
Uses Exponential Moving Averages (EMA) to identify trends and simple moving averages (SMA 9, 20, 89, 200) for visual filter support.
Color-coded bar highlights based on short-term EMA 9 trends.
Session Engine:
Tracks specific market sessions (NY, London, Asia, US Pre-market) with visual markers on the chart.
Includes alerts for upcoming session starts.
Levels & Price Action:
Automatically plots Daily Open, High of Day (HOD), and Low of Day (LOD) levels with extendable lines.
Features an advanced Supply & Demand zone detection system that ranks zones based on strength, mitigates broken zones, and visualizes zone strength using bar-based meters.
Multi-Timeframe Data:
Integrates multiple daily EMAs (3, 9, 20, 50, 100, 200) to help gauge long-term momentum alongside the short-term scalping logic.
The script leverages complex array structures to manage active supply and demand zones, ensuring that invalid or "broken" zones are removed from the chart, while keeping the most relevant ones ranked by a calculated score. It also utilizes request.security for multi-timeframe data fetching to provide a broader context for the current chart timeframe. Indicateur

Indicateur

LSD Zone Detector V2.5LSD Zone Detector
LSD Zone Detector is a supply and demand indicator that automatically identifies, manages, and invalidates zones using a rule-based detection engine. The indicator is designed to highlight areas where strong directional movement originated and to maintain only zones that remain structurally valid.
Overview
The indicator searches for demand and supply zones by combining a marking-candle model with Fair Value Gap (FVG) confirmation.
For demand zones, the script identifies a bearish marking candle and then scans subsequent candles for bullish imbalance conditions. For supply zones, the process is reversed using a bullish marking candle and bearish imbalance confirmation.
Only zones that satisfy the internal validation rules are plotted.
Zone Detection Logic
Demand Zones
A demand zone is created when:
A bearish marking candle is identified.
A bullish Fair Value Gap is found within the configured detection window.
No conflicting bearish candle interacts with the marking candle's range during validation.
Supply Zones
A supply zone is created when:
A bullish marking candle is identified.
A bearish Fair Value Gap is found within the configured detection window.
No conflicting bullish candle interacts with the marking candle's range during validation.
This approach attempts to isolate the origin of strong directional movement while filtering out many overlapping or low-quality areas.
Accuracy Zone Boundaries
The indicator uses a boundary refinement method to reduce unnecessarily large zones.
For demand zones:
If the marking candle's upper wick extends beyond the next candle's high, the zone's upper boundary is reduced to the candle body rather than using the full wick.
For supply zones:
If the marking candle's lower wick extends beyond the next candle's low, the zone's lower boundary is reduced to the candle body rather than using the full wick.
This process can create tighter zones while still preserving the original price area that generated the move.
Zone Lifecycle
Every zone passes through a simple lifecycle:
Zone is detected and drawn.
Zone remains active while valid.
Zone extends forward automatically.
First touch converts the zone into a tapped zone.
Invalid zones are removed from the chart.
Only the most recent tapped zones are retained to reduce visual clutter.
Invalidation Rules
A zone is considered invalid when price closes through the opposite side of the zone.
Demand Zone:
Invalidated when a candle body closes below the zone.
Supply Zone:
Invalidated when a candle body closes above the zone.
When invalidated, the zone is removed rather than remaining on the chart as an inactive object.
Break of Structure (BoS)
The indicator includes optional Break of Structure detection.
BoS is generated using an internal pivot-state machine that tracks confirmed swing transitions rather than relying solely on rolling highs and lows.
For demand zones:
A bullish BoS is displayed when price closes above a confirmed structural pivot formed after the zone was created.
For supply zones:
A bearish BoS is displayed when price closes below a confirmed structural pivot formed after the zone was created.
Each zone can trigger a structure break only once.
Inputs
Zone Extension
Controls how far active zones extend into future bars.
Maximum Zones Per Side
Limits the number of active demand and supply zones maintained on the chart.
FVG Window
Defines how many candles are searched when validating imbalance conditions after the marking candle.
BoS Sensitivity
Controls the pivot lookback used by the structure engine.
Show Break of Structure
Enables or disables BoS plotting.
BoS Colors
Allows customization of bullish and bearish structure-break colors.
Intended Use
The indicator is designed as a market structure and supply/demand analysis tool. It can be used to identify potential reaction areas, monitor zone validity, and observe structural changes in price action.
As with any technical analysis tool, signals should be evaluated within a broader trading plan and risk management framework. Indicateur

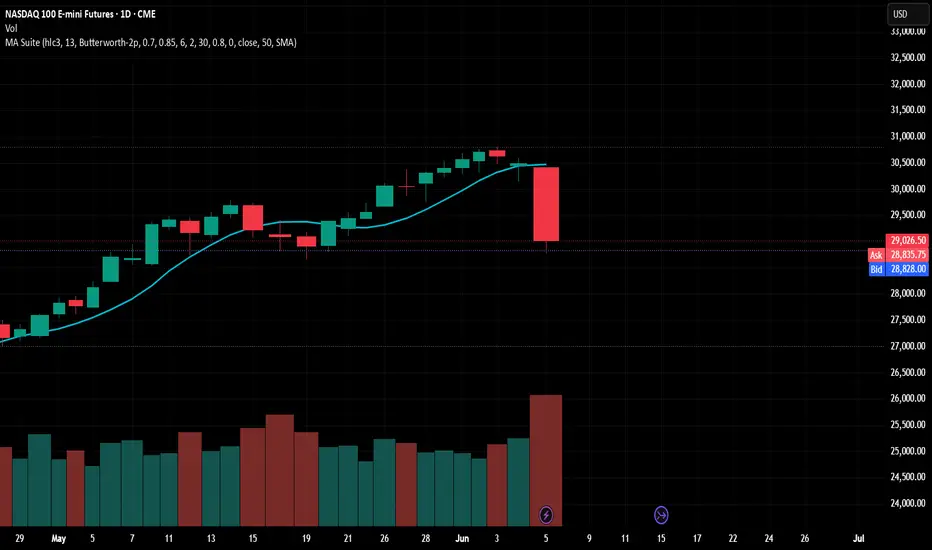
Moving Average Suite (60+)Moving Average Suite (60+ in One)
Welcome to the ultimate Moving Average Suite. Instead of cluttering your chart with multiple scripts or struggling to find that one specific moving average, this single indicator gives you access to over 60 different moving averages through a clean, simple dropdown menu.
Every included moving average has been numerically validated for accuracy, ensuring you get institutional-grade calculations without the hassle of managing multiple indicators.
Key Features
Massive Library: Choose from over 60 distinct moving average types from 7 different mathematical families.
Dual-Plotting System: Optionally plot a second, independent moving average to easily build crossover strategies or compare two different calculation methods side-by-side.
Clean UI: A single "Length" input drives the core of every moving average. For the specific MAs that require extra fine-tuning (like T3 volume factors or KAMA speeds), those parameters are neatly organized in a dedicated section.
Highly Accurate: Calculated with precision and validated against external data science libraries to ensure true-to-form behavior.
The Moving Average Families
We have categorized the available moving averages into seven distinct families based on how they process price data:
1. Classic
The foundational trend-following tools. This includes the standard Simple (SMA), Exponential (EMA), Weighted (WMA), and Running/Smoothed (RMA/SMMA) averages, plus a Cumulative average that tracks price action since the beginning of the chart.
2. Reduced-Lag
Designed to stick closer to the price action and react faster to sudden changes. This family includes double/triple exponential variations (DEMA, TEMA) and highly responsive tools like the Hull (HMA), EHMA, Tillson's T3, and the McGinley Dynamic.
3. Shaped Windows
Instead of applying linear weights, these averages use statistical "shapes" to smooth out price data. You'll find bell-curve smoothing (Gaussian), wave-based smoothing (Sine, Cosine), and binomial models (Pascal) that provide incredibly smooth outputs.
4. Adaptive
"Smart" moving averages that dynamically adjust their own speed based on market conditions. In choppy, sideways markets, they slow down and stay flat to avoid false signals. When a strong trend breaks out, they speed up to catch the move. This category includes KAMA, VIDYA, FRAMA, MAMA/FAMA, and an approximation of the Jurik Moving Average (JMA).
5. Volume-Weighted
Price is only half the story; volume is the other. These averages factor in trading volume to give more weight to price levels where heavy trading occurred. Includes VWMA, Session VWAP, Elastic VWMA, and Volatility-Adjusted MA (VAMA).
6. Regression & Statistical
Built on statistical modeling rather than simple averaging. This includes the Linear Regression Curve (LSMA), Holt Double Exponential (which tracks both level and trend), the Median price tracker, Geometric, and Harmonic averages.
7. Ehlers & Digital Filters
Advanced tools borrowed from the world of digital signal processing, engineered by John Ehlers. These filters are mathematically designed to aggressively strip out market noise (aliasing) while maintaining near-zero lag. Includes the SuperSmoother, 2-Pole Butterworth, Laguerre, Roofing Filter, and Instantaneous Trendline.
How to Use It
Add the indicator to your chart.
Open the settings and select your primary MA Type and Length.
If you use a crossover strategy, check the "Show second MA" box and configure your secondary baseline.
If you are using a specialized MA (like ALMA or KAMA), scroll down to the Per-MA Params group to tweak its specific inputs. Indicateur

Indicateur

Indicateur

Range BAR Scalper (100R/1000R)Range Scalper — Adaptive S/R Zones
A visualization tool built specifically for range charts (100R/1000R).
🔹 Adaptive S/R zones with automatic pivot detection
🔹 M / R / RSI signals with neon-style markers
🔹 Dashboard showing active levels and last break
🔹 Status panel: trend, bar run, RSI, and last signal (with bars-ago count)
The visual style of the signal markers is inspired by Dynamic RSI Regression Bands by Zeiierman, and the adaptive S/R zone concept draws from Adaptive S/R Zones by BigBeluga. Both originals are licensed under CC BY-NC-SA 4.0; this tool follows the same license and is for non-commercial use only.
⚠️ This is a visualization/educational tool, not financial advice. Signals are not a guarantee of results — test it yourself before any real use.Disclaimer
This indicator is provided for educational and informational purposes only. It is not financial, investment, or trading advice, and nothing in it constitutes a recommendation to buy, sell, or hold any instrument.
Trading and investing carry substantial risk of loss. Past performance — including any signals, levels, or visuals shown by this tool — does not guarantee future results. The signals are not predictions and may produce false or losing setups.
You are solely responsible for your own trading decisions. The author accepts no liability for any losses, damages, or other consequences arising from the use of this tool. Always do your own research and consider consulting a licensed financial professional before trading.
Licensed under CC BY-NC-SA 4.0 — non-commercial use only. Visual style adapted from work by Zeiierman and BigBeluga. Indicateur

Indicateur

Indicateur

GMMA Decisive Below Signal MTFGuppy Multiple Moving Average (GMMA) Decisive Below Signal MTF User Manual
Overview
This manual explains how to use the GMMA Decisive Below Signal MTF TradingView indicator, including its inputs, chart behavior, and signal logic. The script supports separate visibility controls for short and long GMMA groups, separate source settings for those groups, and a selectable timeframe for multi-timeframe GMMA calculations.
What the indicator does
The indicator plots a Guppy Multiple Moving Average structure using 12 EMAs split into two groups: six short-period EMAs and six long-period EMAs. It then displays a one-time bearish signal only when a candle body is completely below the full GMMA stack, with no body contact with any EMA, and only on the first bar where that state begins.
Inputs
| Setting | Purpose | Notes |
| -------------------- | ------------------------------------------------ | -------------------------------------------------------------------------------------- |
| GMMA Timeframe | Chooses the timeframe used for GMMA calculations | Uses input.timeframe() and feeds that into request.security().tradingview+1 |
| Short GMMA Source | Source used for the six short EMAs | Created with input.source().tradingviewyoutube |
| Long GMMA Source | Source used for the six long EMAs | Created with input.source().tradingviewyoutube |
| Show Short GMMA | Shows or hides the short EMA group | Boolean visibility control through input.bool() and plot(... ? value : na).tradingview |
| Show Long GMMA | Shows or hides the long EMA group | Boolean visibility control through input.bool() and plot(... ? value : na).tradingview |
| EMA1 to EMA12 Period | Controls the lengths of the EMAs | The default GMMA structure remains 3, 5, 8, 10, 12, 15 and 30, 35, 40, 45, 50, 60. |
Signal logic
The script calculates the upper edge of the candle body using math.max(open, close). It then calculates the lowest EMA value across all 12 GMMA lines using math.min(...), and the bearish condition becomes true only when the body top is strictly below that level, which prevents body contact with any EMA.
The plotted signal appears only on the first bar where the decisive bearish condition turns true. This behavior comes from feeding plotshape() a boolean series and combining the current condition with its prior-bar state using , so repeated signals are suppressed while the condition remains true.
Setup steps
Open TradingView and add a new custom indicator in the Pine Editor.
Paste the script and save it.
Add the indicator to the chart.
Open the indicator settings and choose the GMMA timeframe, short source, long source, and visibility checkboxes.
Review the chart for one-time SELL signals when a candle body decisively moves below the full GMMA stack.
Screen grabs to capture
Add the following screenshots before publishing the manual so users can visually follow the workflow.
Screen grab 1: Pine Editor with the script loaded
Capture the Pine Editor showing the script title, the timeframe input, the short and long source inputs, and the plotshape signal section. This screenshot helps users confirm they pasted the correct script.
Screen grab 2: Indicator settings panel
Capture the Inputs tab showing:
GMMA Timeframe
Short GMMA Source
Long GMMA Source
Show Short GMMA
Show Long GMMA
EMA periods
This screenshot helps users understand how to configure the script inputs.
Screen grab 3: Chart with both GMMA groups visible
Capture a chart where the six short EMAs are visible in green and the six long EMAs are visible in red. This screenshot demonstrates the two-group GMMA structure.
Screen grab 4: Chart showing the first decisive bearish SELL signal
Capture a chart section where the candle body is clearly below the entire GMMA stack and the SELL marker appears above the bar only once. This screenshot documents the exact signal behavior controlled by plotshape() and the first-occurrence condition.
Screen grab 5: Visibility controls in action
Capture one chart with only short GMMA enabled and another with only long GMMA enabled. This screenshot pair documents how the checkboxes affect display without changing the underlying signal logic.
Notes and cautions
input.source() supports source selection such as open, high, low, close, and composite price series, but source behavior in multi-timeframe workflows should be tested carefully because the script also uses request.security() to pull values from another timeframe.
TradingView documentation notes that requesting lower-timeframe data from a higher-timeframe chart is generally not recommended, so users should prefer equal or higher GMMA timeframes for more stable behavior.
Recommended upload package
For a clean user manual upload, include:
This markdown manual as the main document.
Five PNG screenshots named in sequence, for example 01-pine-editor.png through 05-signal-example.png.
The Pine Script file saved separately as plain text for quick reuse. Indicateur

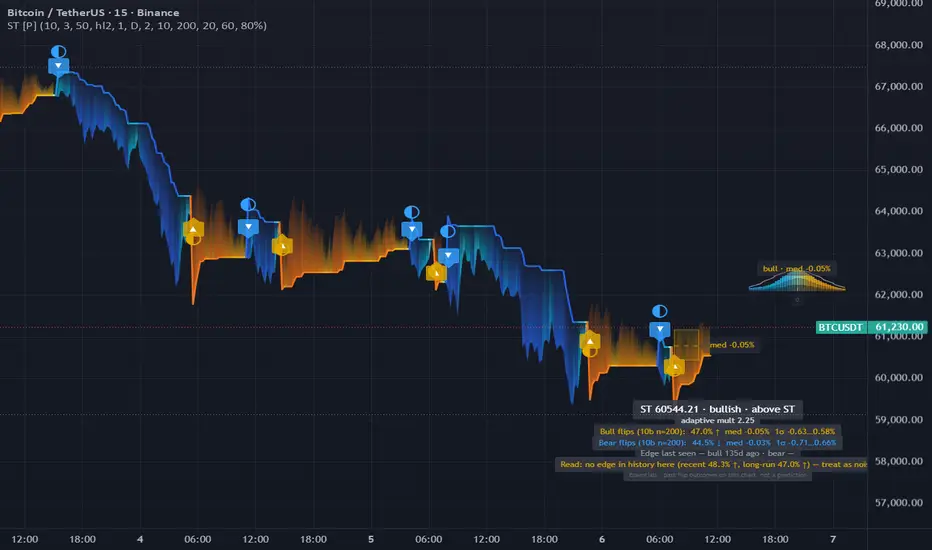
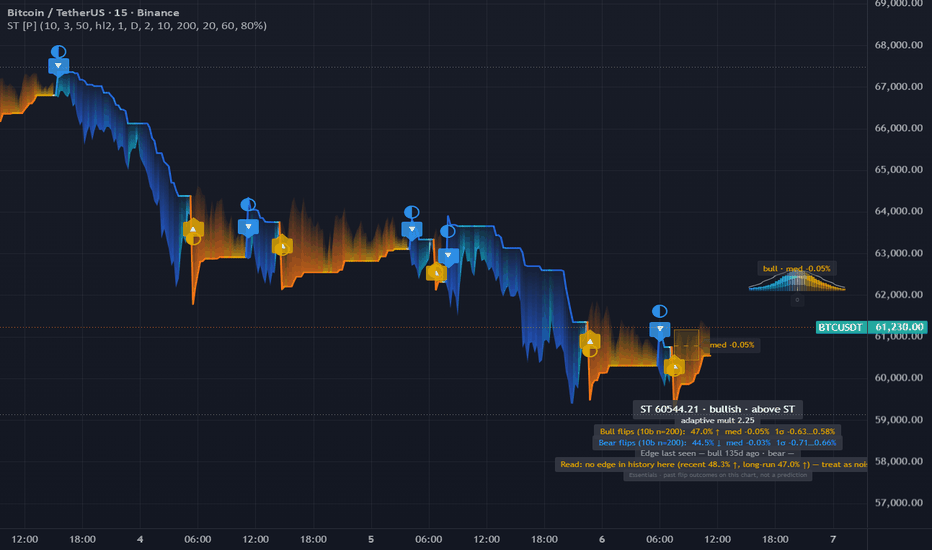
Supertrend Tempered [Probalist Essentials]Supertrend Tempered is a trend-direction tool that places a trailing ATR stop above or below price and flips when price closes through it. Gold line means the trend is up; blue means it's down. The flip is the signal.
The Tempered version adds ATR-adaptive sensitivity so the band breathes with volatility — tighter when markets are calm, wider during spikes — reducing false flips without sacrificing responsiveness. On top of the classic, it tracks what actually happened after past flips on this chart and shows the distribution as a forward projection and a bell curve panel.
🟡 WHY THIS VERSION
A Supertrend that shows you what its own flips have historically led to, right on the chart. Most Supertrend scripts just draw the line and fire an alert — this one keeps score. After enough flips, the distribution panel and cone tell you the median outcome and the spread, separately for bull and bear flips, so you can judge the flip in context rather than treating every one the same. The adaptive mode is on by default because it cuts noise on most instruments without any extra fiddling. Flips only confirm on a closed bar so no midnight-print surprises. The alerts have a history-backed tier that fires only when your chart's past flips actually showed follow-through — a useful filter, not a promise.
🟡 HOW IT WORKS
The core is a two-sided trailing stop built from ATR. On each bar, a raw upper band sits above the midpoint by a multiple of ATR and a raw lower band sits below by the same amount. The bands are ratcheted: the upper band can only move down (or reset if price breaks above it), and the lower band can only move up (or reset if price breaks below it). When price closes above the upper band, trend flips to bullish and the lower band becomes the active trailing stop. When price closes below the lower band, trend flips to bearish and the upper band takes over.
In adaptive mode the multiplier is scaled by the ratio of short-term ATR to a longer-run ATR baseline. A high ratio means volatility is spiking relative to its norm — the band widens to avoid a false flip. A low ratio means conditions are quiet — the band tightens to stay close to price. The result tracks trend direction through choppy patches better than a fixed multiplier.
The probability read counts every confirmed flip, then looks up the close N bars later. Those returns go into per-direction arrays. The distribution panel draws a kernel-smoothed density of those returns, with a Gaussian overlay so you can see fat tails and skew at a glance. The projection cone after the most recent flip spans the 16th–84th percentile of that history, anchored at the flip price.
🟡 KEY FEATURES
ATR-adaptive multiplier that scales with short/long ATR ratio — fewer whipsaws in low-vol periods, wider band during spikes
Clean ▲/▼ flip labels at each trend-change bar with hover tooltips showing signal strength and historical stats at fire time
Weighted signal dots: size reflects excursion depth (ATR-scaled), glyph shows evidence tier at the moment of the flip
Forward-return distribution: separate bull and bear outcome arrays, KDE bell curve panel with Gaussian overlay
Projection cone anchored at the flip price, spanning the 16th–84th percentile of past outcomes in that direction
Optional higher-timeframe Supertrend reference line — display only, no scoring or gating
Heat colour ramp: line and fill breathe hot/cold with how far price has moved through the band
Eight alert conditions including history-backed and strong-flip tiers, all confirmed on bar close
Regime-aware reads: besides the long-run record, a recent-form window (default last 40 outcomes) with a Wilson-score evidence test — the Read tells you whether the signal works NOW, and an edge clock shows when each side last had it
🟡 HOW TO USE
Use the line colour as a bias filter: gold = bullish bias, worth considering long-side setups; blue = bearish, consider the short side or stay flat.
A flip label marks the moment the trend changed. Hover the dot to see the strength and what past flips at this signal tier averaged — use that as context, not a guarantee.
ATR-adaptive mode is on by default. On trending instruments with variable volatility it cuts noise well. For very stable, range-bound markets you may prefer fixed multiplier.
The projection cone after a flip shows the 16th–84th percentile of past outcomes in that direction, anchored at the flip price. A tight cone on a backed signal adds conviction; a wide or centred cone around zero is a caution.
The distribution panel (top-right of the price pane) shows the full return distribution separately for bull and bear flips. The gap between the KDE fill and the Gaussian overlay reveals skew and fat tails.
Run the optional HTF line to see whether the higher-timeframe trend agrees — a flip that aligns with the HTF direction has broader context; a counter-HTF flip is a fade candidate, not a trend trade.
Realtime mode (Confirm bars = 0) updates the signal on the live bar — useful for watching; default 1-bar confirmation is the honest, non-repainting mode for alerts.
Weigh the median move against your round-trip costs — a backed flip with a tiny median (say +0.04% on a 5-minute chart) doesn't survive fees and spread on most venues; the edge read is about direction, not net profit
🟡 PAIRS WELL WITH
A momentum read (RSI, MACD) pairs naturally here — a bullish Supertrend flip is worth more when momentum was oversold before the flip or is now turning up from a low base. A volume indicator adds the missing liquidity dimension: a flip on elevated volume has more conviction than one on thin air. For swing setups, a higher-timeframe structure read (S/R levels, swing highs/lows) tells you whether the flip is happening into open space or straight into overhead supply. The Supertrend alone doesn't read overextension — it just tracks the trend — so a volatility or mean-reversion tool alongside it flags when a quiet trend is tightening toward a potential squeeze release.
Supertrend Tempered gives you the classic ATR trailing stop with adaptive sensitivity and an honest historical context. It tells you which way the trend is running, how far price has moved through the band, and what past flips in that direction have actually produced on this chart. That's the read — what you do with it is yours.
Open source under MPL-2.0. The probability layer describes past signals on your chart — it is a measurement, not a prediction, and nothing here is financial advice. Indicateur
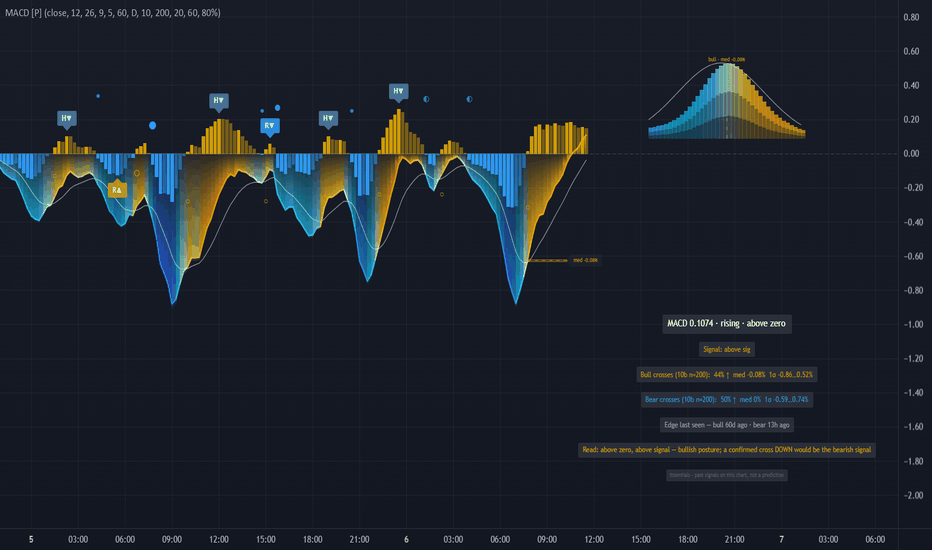
MACD Rewired [Probalist Essentials]MACD Rewired is the canonical Moving Average Convergence Divergence — fast EMA minus slow EMA, smoothed through a signal EMA — rebuilt with a 4-state histogram, regular and hidden divergence detection, and an empirical forward-return distribution on every signal cross.
It's aimed at momentum traders who already know MACD and want a version that earns its place: the histogram tells you not just where price is but whether momentum is building or fading, the divergence labels flag the structural shifts the raw histogram misses, and the probability panel shows what this chart's own history recorded after past crosses.
🟡 WHY THIS VERSION
The histogram alone doesn't tell you whether a reading above zero is growing or about to roll — this version colour-codes all four states so you can see momentum building vs. fading at a glance, in the right direction. The divergence labels (regular and hidden, both bull and bear) are drawn on confirmed pivots and stay put — no repainting. The probability read is the one I find myself actually using: it doesn't promise an edge, it just tells you what happened after past crosses on the specific chart you're looking at, with the sample size and spread shown honestly. Sane defaults, all alerts fire on bar close, and the heat palette makes the wave read intuitively hot or cold with the momentum.
🟡 HOW IT WORKS
MACD subtracts a slow EMA from a fast EMA to isolate the gap between short-term and medium-term momentum. A signal EMA smoothed over the MACD line then acts as a trigger — crossovers and crossunders are the classic entry cues. The histogram (MACD minus signal) turns that gap into a visual: rising bars show momentum building, falling bars show it fading, and the zero line separates bullish from bearish territory. Four colours cover the four states.
Divergence detection scans confirmed pivot lows/highs in the histogram (ta.pivotlow / ta.pivothigh) and compares them to the corresponding price pivot lows/highs. A regular bullish divergence is price making a lower low while the histogram makes a higher low — momentum not confirming the new price extreme. A hidden bullish divergence is the opposite structure: price makes a higher low while the histogram makes a lower low, suggesting the underlying trend is intact. Bear logic mirrors this on the highs side.
The probability read records the percentage return i_horizon bars after each confirmed signal cross and stores it in separate bull and bear arrays. Once the minimum sample threshold is met it reports win-rate, median return, and the 16th–84th percentile band — the spread, not just a headline number.
🟡 KEY FEATURES
4-state histogram colouring: rising/falling × above/below zero — shows whether momentum is building or fading, not just direction
Regular and hidden divergence on both bull and bear sides, drawn on confirmed pivots — non-repainting
Empirical forward-return distribution: records what happened after past signal crosses on this chart and displays a KDE bell curve
Probability projection cone on the most recent signal bar spanning the 16th–84th percentile band
Separate bull and bear outcome arrays — no dilution from pooling opposite-direction signals
Evidence-gated alerts that fire only when the chart's own history backed follow-through (win rate ≥ 55%, positive median)
Weighted signal dots with per-dot hover tooltips showing the read at fire time and the eventual outcome
Optional HTF MACD line as a faint display-only reference — does not gate signals
Probalist heat wave — the MACD line breathes hot/cold with histogram momentum strength
🟡 HOW TO USE
Use the histogram colour to gauge momentum quality — a bright gold bar above zero means momentum is building bullish; a dim gold bar means it's fading. Same logic in reverse below zero with blue.
Divergence labels (R Bull Div, H Bull Div, R Bear Div, H Bear Div) mark structural mismatches between price and momentum. Regular divergence hints at exhaustion; hidden divergence hints at continuation — neither is a standalone signal.
Signal crosses are the primary cue: crossover above signal line = bullish bias, crossunder = bearish. Use in the direction of higher-timeframe structure for better results.
Check the probability panel before acting on a cross: if the chart shows n < 20, the read is still gathering. Once populated, the 16th–84th band tells you how wide the distribution of past outcomes was — a narrow band with a high win-rate is a different situation from a wide band.
Enable evidence-gated alerts to be notified only when the chart's own history backed a cross at that win-rate threshold. Noisy charts will rarely fire these; trending charts will fire them more.
Set the HTF line to your bias timeframe (e.g. 4H or Daily when trading 1H). If the HTF MACD is below zero while you get a 1H bull cross, treat it as a countertrend setup — confluence or caution, your call.
🟡 PAIRS WELL WITH
MACD measures momentum but doesn't tell you where price is relative to structure. Pair it with a trend filter — a moving average or a Supertrend — so you can tell whether a bullish cross is with or against the prevailing direction. A volume indicator (relative volume or VWAP deviation) helps confirm whether the cross has conviction behind it; a low-volume cross in the middle of a range is a different read from a high-volume cross off a support level. On higher timeframes, a weekly or daily MACD posture gives context the 1H cross alone can't provide. MACD doesn't handle horizontal S/R — key levels from price action or pivot points help frame where the cross is happening in the market structure.
MACD Rewired gives you the classic momentum tool with the context it was always missing: a histogram that shows whether momentum is building or fading, divergence that flags the structural mismatches, and a probability read that keeps score of what this chart's own history said after past crosses. No predictions — just the evidence, shown honestly.
Open source under MPL-2.0. The probability layer describes past signals on your chart — it is a measurement, not a prediction, and nothing here is financial advice. Indicateur
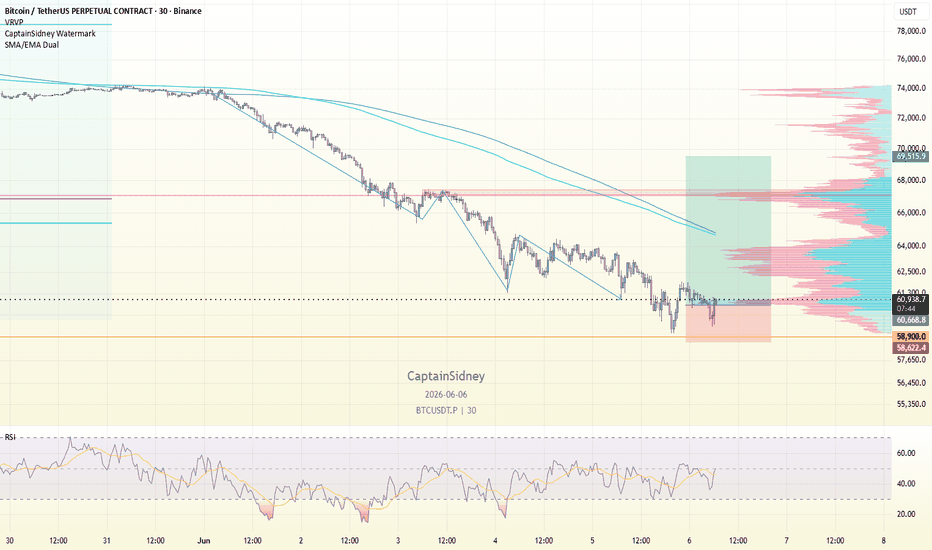
Combined SMA and EMA IndicatorDescription
This lightweight, multi-purpose indicator combines traditional Simple Moving Averages (SMA) and Exponential Moving Averages (EMA) into a single script, eliminating the need for multiple indicator slots on your chart.
Beyond simply plotting the standard lines, this script includes a dynamic secondary smoothing layer that can track either your SMA or EMA baseline, complete with optional Bollinger Band volatility channels.
Key Features:
Dual Display Mode: Choose to display only the SMA, only the EMA, or both simultaneously to analyze trend crossovers.
Targeted Smoothing: Apply a secondary filter to either the SMA or EMA baseline. Smoothing options include SMA, EMA, SMMA (RMA), WMA, or VWMA.
Integrated Bollinger Bands: Enable volatility bands directly over your smoothed moving average line to identify overextended price action and potential reversals.
Fully Configurable: Hide, show, or adjust lengths and source inputs for all components directly from the settings menu.
How to Use:
Trend Direction: Use the primary SMA/EMA crossover to determine the macro trend.
Dynamic Support/Resistance: Use the secondary Smoothed MA (Yellow) as a trailing trigger line for entries.
Volatility Breaks: Use the integrated Bollinger Bands to gauge when the baseline moving average is experiencing extreme expansion or contraction. Indicateur
Indicateur

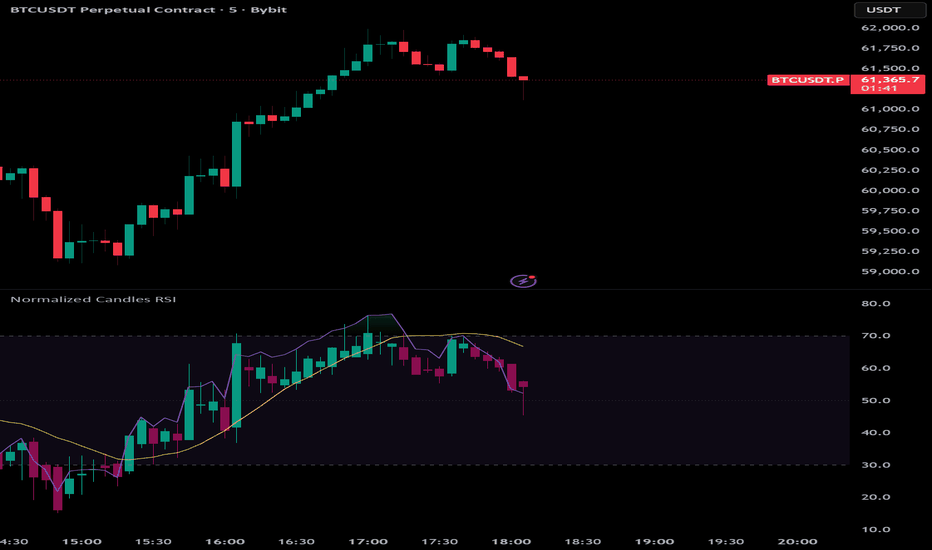
Normalized Candles RSI [Jamallo]🔹 Intro
The Normalized Candles RSI is a quantitative momentum and volatility indicator designed to transform raw, trending price action into a stationary 0-100 oscillator. By passing price data through a Fractional Differencing engine and a dynamic Z-Score normalization layer, it strips away market drift and presents pure, bounded candlestick momentum. This stationary price structure is then directly overlaid with a traditional RSI and Divergence engine for highly confluent signals.
🔹 Break down
Fractional Differencing (FFD): Transforms non-stationary price data into a stationary series while retaining deep historical memory (controlled by the "d" parameter). This prevents the data loss associated with standard period-to-period differencing.
Normalization Engine: Applies a rolling Z-Score to the differenced data, which is then passed through a Sigmoid compression function. This mathematically forces the resulting candlesticks into a strict 0-100 range without repainting.
RSI & Divergence Engine: Overlays a classic RSI with optional smoothing moving averages and Bollinger Bands. Built-in regular bullish and bearish divergence detection algorithms automatically scan for momentum exhaustion relative to the price.
🔹 Visual Guide: Indicator Anatomy
The true power of this indicator lies in its visual mapping. As shown in the snapshot, the indicator pane perfectly merges the structure of raw price action directly with a classic RSI oscillator.
1:1 Structural Mapping: Notice how the normalized candles in the middle pane mirror the raw price action in the main chart exactly (highlighted by the "1:1 with overlay candle sticks" annotation). You get the exact same highs, lows, and structural candlestick patterns, but stripped of drift and mathematically squashed into a stationary box.
Normalized Candles + Standard RSI: If you look at a standard RSI (bottom pane), you only see a floating line. By overlaying the normalized candles (middle pane), you can see exactly how the physical candlestick bodies and wicks behave relative to the RSI's 0-100 bounds and its smoothing moving average (the yellow line).
Actionable Context: When a localized top or bottom forms, you aren't just guessing based on a purple line peaking. You can see the actual candlestick structure exhausting itself, forming wicks and reversal patterns right against the upper (70+) or lower (30-) overextended boundaries.
🔹 Settings Parameters
- Diff Order (d) (0.01 - 0.99): The fractional differencing order. Higher values make the series more stationary but remove more historical memory.
- Z-Score Lookback: The rolling window used to calculate the mean and standard deviation for the 0-100 normalization engine.
- Sigmoid Compression Scale: Controls the elasticity of the 0-100 bounds. A higher value results in softer compression at the extremes, while a lower value makes it compress faster.
- RSI Settings & Smoothing: Standard parameters for the RSI length, smoothing moving averages (SMA, EMA, VWMA, etc.), Bollinger Bands, and the divergence lookback constraints.
🔹 Credits & Acknowledgements
The core RSI and Divergence engine utilized in this script is adapted from TradingView's built-in Relative Strength Index indicator code. Indicateur
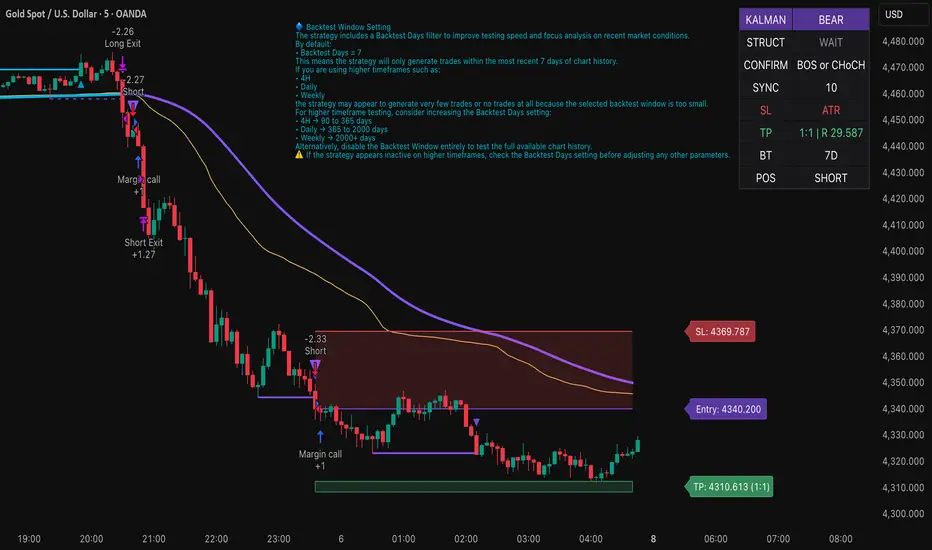
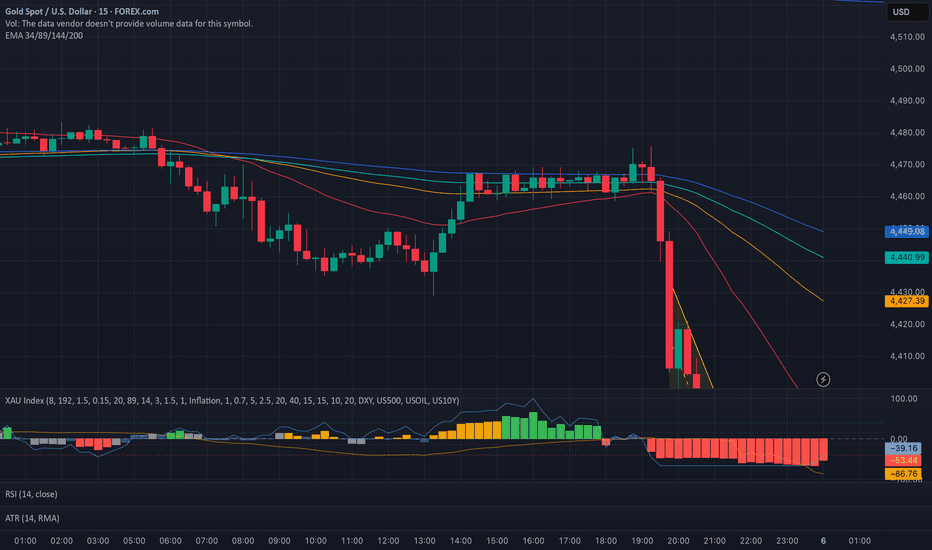
Smart Trend Strategy | julzALGO📘 Summary
Smart Trend Strategy | julzALGO is a trend-following strategy that combines adaptive trend analysis with market structure confirmation. The strategy uses a dual-stage smoothing engine to identify trend shifts while validating entries through Break of Structure (BOS) and Change of Character (CHoCH) events.
To improve adaptability across different market conditions, the strategy includes independent Risk:Reward settings for long and short positions, allowing bullish and bearish trades to be managed separately.
The result is a complete trend and structure-based trading system with automated entries, stop losses, take profits, visual trade management, and strategy backtesting.
📘 Features
✅ Adaptive Trend Detection
✅ Trend Flip Identification
✅ Bullish & Bearish Market Structure Analysis
✅ Break of Structure (BOS)
✅ Change of Character (CHoCH)
✅ Close or Wick Break Confirmation
✅ Trend & Structure Synchronization Engine
✅ Independent Long and Short Risk:Reward Targets
✅ Structure-Based Stop Loss
✅ ATR-Based Stop Loss
✅ Percentage-Based Stop Loss
✅ Automatic ATR Fallback Protection
✅ Dynamic Entry, Stop Loss & Take Profit Visualization
✅ Risk Zone Highlighting
✅ Target Projection Zones
✅ Position Management Dashboard
✅ Long & Short Trading Modes
✅ Opposite Signal Exit Logic
✅ Configurable Backtest Window
✅ Built-In Alerts
📘 Logic
🔷 Trend Engine
The strategy continuously evaluates price direction using an adaptive smoothing process designed to reduce market noise while maintaining responsiveness.
Bullish Trend
* Trend direction turns positive.
* Long setups become eligible.
Bearish Trend
* Trend direction turns negative.
* Short setups become eligible.
🔷 Market Structure Engine
The strategy monitors swing highs and swing lows to identify structural shifts.
Bullish Structure Signals
• Bull BOS
• Bull CHoCH
Bearish Structure Signals
• Bear BOS
• Bear CHoCH
These events help confirm whether momentum and structure are aligned with the current trend.
🔷 Trend & Structure Synchronization
A trade is only allowed when both:
• Trend Direction
and
• Market Structure Confirmation
occur within the user-defined synchronization window.
This reduces isolated signals and improves trade quality.
🔷 Split Risk:Reward System
Long and short trades can use separate profit targets.
Example:
Long Trades
* Risk:Reward = 1:2
Short Trades
* Risk:Reward = 1:1
This allows traders to adapt to directional market bias and optimize strategy performance.
🔷 Stop Loss Models
The strategy supports three stop loss methods:
Structure Stop
* Uses recent swing structure.
ATR Stop
* Uses market volatility.
Percent Stop
* Uses fixed percentage distance.
ATR fallback protection can automatically replace invalid structure stops.
🔷 Trade Management
Each active trade displays:
• Entry Price
• Stop Loss
• Take Profit
• Risk Zone
• Target Zone
• Active Risk:Reward
This provides complete visual trade management directly on the chart.
🔷 Dashboard
The built-in dashboard displays:
• Current Trend Direction
• BOS / CHoCH Status
• Entry Confirmation Mode
• Synchronization Setting
• Stop Loss Method
• Active Risk
• Active Risk:Reward
• Position Status
• Backtest Window Status
📘 Usage
🔷 Bullish Setup
1. Trend flips bullish.
2. Bull BOS or Bull CHoCH confirms.
3. Long signal appears.
4. Stop loss and target are calculated automatically.
5. Trade remains active until TP or SL is reached.
🔷 Bearish Setup
1. Trend flips bearish.
2. Bear BOS or Bear CHoCH confirms.
3. Short signal appears.
4. Stop loss and target are calculated automatically.
5. Trade remains active until TP or SL is reached.
Suggested Configuration
Long Risk:Reward
* 1:2
Short Risk:Reward
* 1:1
This configuration may be beneficial in markets with stronger bullish tendencies.
📘 Settings
🔷 Trend Engine
Source — Price source used for calculations.
ER Length — Controls adaptive sensitivity.
Fast Length — Fast smoothing component.
Slow Length — Slow smoothing component.
Process Noise — Trend responsiveness control.
Measurement Noise — Trend smoothing control.
🔷 BOS / CHoCH Confirmation
Structure Pivot Length — Swing sensitivity.
Break Confirmation — Close or Wick confirmation.
Entry Confirmation — BOS, CHoCH, or combined logic.
Sync Bars — Maximum distance between trend and structure confirmation.
Show Structure Lines — Display BOS/CHoCH levels.
Show Structure Marks — Display structure markers.
🔷 Split RR
Stop Loss Type — Structure, ATR, or Percent.
Long Risk:Reward — Profit target for long trades.
Short Risk:Reward — Profit target for short trades.
ATR Length — ATR calculation period.
ATR Multiplier — ATR stop distance.
Percent Stop — Fixed stop distance.
Structure Buffer — Additional stop padding.
ATR Fallback Protection — Uses ATR when structure stop becomes invalid.
🔷 Strategy
Allow Long — Enable long positions.
Allow Short — Enable short positions.
Close On Opposite Signal — Automatically closes opposite trades.
Backtest Window — Restricts historical testing period.
Backtest Days — Number of days included in testing.
🔷 Display
Show Signals — Displays entry markers.
Show RR Levels — Displays trade levels.
RR Label Offset — Label positioning distance.
TP Box Padding — Target zone size.
Show Dashboard — Enables dashboard.
Color Bars — Trend-colored candles.
📘 Disclaimer
This strategy is intended for educational and research purposes only. Past performance does not guarantee future results. Always perform independent testing and apply proper risk management before using any strategy in live market conditions.
Stratégie

EMA Distance Zone Move MatrixThis indicator answers one of the most practical questions in trading: "When price is X% away from the EMA, how likely is it to move at least Y% from that point?"
It builds a live probability matrix from historical data — no repainting, no predictions — just raw statistics from how price has actually behaved.
How It Works
The indicator measures the percentage distance between price and a selected EMA at every bar. It then groups historical bars into user-defined zones (e.g. "price is 3–5% above EMA") and tracks how often price made a significant move after entering each zone.
Example read:
If the 3 to 5% zone shows ▲≥5%: 62.3% — that means 62.3% of the time, after price entered that zone, it subsequently rallied at least 5% from the entry price within the tracking window.
Settings
EMA
EMA Length — period of the EMA (default: 20)
EMA Timeframe — use the chart timeframe or any higher timeframe
Lookback Bars — how many historical bars to analyse (default: 1000)
Bars to Track — how many bars after zone entry to watch for the move (default: 50)
From Zones (Rows) — 8 zones, each with:
Enable/disable toggle
Lo% and Hi% — the EMA distance band (supports negative values for below-EMA zones)
Label — custom name shown in the table row
Move Thresholds (Columns) — 10 thresholds, each with:
Enable/disable toggle
Direction — ▲ Up (price rises), ▼ Down (price falls), ↕ Either (either direction)
≥ % — minimum move size to count as a hit
Display
Show % or raw count
Heatmap color mode
Table position and text size
The Matrix Table
Rows = FROM zones (where price was when it entered)
Columns = move thresholds (how far it moved after)
Last column = total number of visits to that zone
Each cell shows the probability (%) or count of times price achieved that move after entering that zone.
Color coding (heatmap mode):
Red — highest probability (≥75% of max)
Orange — high (50–75%)
Yellow — moderate (25–50%)
Teal — low (below 25%)
Gray — zero / no data
Column headers are color-coded by direction:
Teal = Up move ▲
Red = Down move ▼
Purple = Either direction ↕
The footer row shows the currently active zone and the indicator settings summary.
Chart Background
The chart background is lightly shaded to show which zone price is currently in — making it easy to spot your current EMA distance zone at a glance without looking at the table.
Use Cases
Find which EMA distance zones historically lead to strong reversals or continuations
Identify asymmetric zones where up-move probability is much higher than down
Compare behavior at oversold vs overbought EMA distances
Build mean-reversion or momentum setups backed by historical statistics
Use with any EMA (20, 50, 100, 200) on any timeframe
Notes
overlay=true — draws directly on the main chart, no separate pane needed
A move is counted once per zone visit per threshold (first time it's hit within the tracking window)
Works on any instrument: stocks, crypto, forex, futures, indices
The matrix updates live on every bar — no need to refresh
Use a lookback of at least 500 bars for statistically meaningful results
Ensure the chart timeframe has enough history to cover the lookback window
Settings Quick Start (recommended defaults):
Zones: -10 to -5 · -5 to -3 · -3 to 0 · 0 to 3 · 3 to 5 · 5 to 10
Moves: ▲≥1% · ▲≥2% · ▲≥5% · ▲≥10% · ▼≥1% · ▼≥2% · ▼≥5% · ▼≥10%
Lookback: 1000 · Track window: 50 bars Indicateur

Lemorei Daily - All-In-OneLemorei Daily — All-in-One Daily Chart Context Tool
Lemorei Daily is a discretionary daily-chart analysis indicator designed to help traders quickly evaluate a stock’s broader trend, relative strength, volume quality, key levels, and long-side trading context.
This script is built for daily charts and is intended to support watchlist building, pre-market preparation, swing context, and intraday bias planning. It is not designed as a standalone buy/sell execution system. Instead, it helps answer one important question before trading: Is this stock strong enough to deserve attention?
The indicator combines several important daily-chart components into one clean visual layout:
20 EMA, 50 EMA, and 200 EMA trend structure
20/50 EMA cloud to quickly visualize bullish or bearish trend alignment
Weekly and Monthly anchored VWAP to identify whether price is above or below important institutional reference levels
Previous Day High and Previous Day Low levels with optional extended labels
ATR-based daily range analysis to classify the current day as quiet, normal, healthy, expanded, or extreme
Relative strength vs SPY to show whether the ticker is leading or lagging the market
Volume quality analysis using relative volume versus its average
Hot volume candle highlighting for unusual daily participation
Fast Daily dashboard summarizing bias, EMA position, VWAP status, relative strength, volume, range, and action context
Action engine that classifies the setup as A+ LONG, WAIT VWAP, PULLBACK, SELECTIVE, AVOID LONG, or CAUTION
Clean action note with plain-language guidance for the current daily context
Alerts for A+ daily long context, VWAP reclaim, wait-for-VWAP conditions, and hot daily volume
The goal of this indicator is to make daily chart analysis faster, cleaner, and more structured. It is especially useful for traders who focus on momentum stocks, large-cap leaders, continuation setups, VWAP reclaim setups, and stocks showing relative strength against the broader market.
Suggested use cases:
Building a daily watchlist
Filtering stocks before intraday trading
Identifying strong continuation candidates
Avoiding weak or extended names
Confirming whether a stock has bullish daily structure before looking for lower-timeframe entries
Monitoring important VWAP, EMA, volume, and range conditions
Important: This script is for educational and informational purposes only. It is not financial advice, investment advice, or a recommendation to buy or sell any security. Always combine this tool with your own analysis, risk management, market conditions, news awareness, and personal trading plan.
Indicateur

Indicateur
Stratégie