Stratégie

RSI DNARSI dna Oscillator is a momentum analysis tool built around RSI, divergence detection, multi-timeframe RSI readings, volume context, failure swings, higher timeframe bias, and RSI compression behavior.
The purpose of this indicator is to help traders read momentum conditions in a structured way. It is designed to show when RSI is bullish, bearish, overbought, oversold, compressed around the midline, or showing divergence against price action.
This script is an indicator only. It does not place trades, does not provide financial advice, and does not guarantee future results. It should be used together with price action, market structure, support and resistance, volume, and personal risk management.
────────────────────────────
MAIN FEATURES
────────────────────────────
RSI Engine
The core of the indicator is a standard RSI calculation. The RSI line, histogram, midline, overbought zone, and oversold zone help identify bullish or bearish momentum conditions.
Divergence Detection
The indicator can detect regular and hidden bullish or bearish divergences between price and RSI. Divergence lines and labels can be displayed directly inside the oscillator panel.
Volume-Confirmed Divergences
An optional volume filter can be used to validate divergences only when volume conditions are present. The filter can use volume spike, absorption wick behavior, volume fade, or a combination of these conditions.
Heiken Ashi RSI Mode
The script includes an optional Heiken Ashi smoothing mode calculated from RSI values. This can help reduce visual noise in the oscillator. Opposite RSI candles can also be masked when they conflict with the smoothed HA direction.
Failure Swing Engine
The indicator includes an optional RSI failure swing module. This is separated from classical divergence detection. It looks for RSI reversal structures based on RSI pivots, break levels, and confirmation.
MTF RSI Matrix
The dashboard can display RSI values from multiple timeframes. This helps compare short-term and higher-timeframe momentum from the same panel.
HTF Bias Filter
Signals can optionally be filtered by a higher timeframe bias using EMA, RSI, or EMA plus RSI. This can help avoid signals that go against the selected higher timeframe condition.
RSI Squeeze Mode
The indicator can detect when RSI compresses around the midline. A squeeze condition suggests that momentum is tight or undecided. Release signals can appear when RSI expands away from the compression area.
Volume Profile Display
A small volume profile-style column display is included in the oscillator panel. It shows relative volume strength compared to its moving average.
Candle Color Mode
The script can optionally color chart candles using different logic modes, including RSI midline, higher timeframe bias, or high/low structure. The high/low structure mode is designed to provide a simple bullish or bearish reading based on price making higher highs and higher lows, or lower highs and lower lows.
Alerts
The script includes alerts for RSI midline crosses, overbought and oversold entries/exits, divergences, Heiken Ashi RSI flips, volume spikes, failure swings, RSI squeeze, and squeeze releases.
────────────────────────────
INPUTS EXPLAINED
────────────────────────────
RSI ENGINE
RSI Length
Controls the RSI calculation period. A lower value makes RSI more reactive. A higher value makes RSI smoother.
Overbought
Defines the upper RSI level used to mark overbought conditions. The default value is commonly set around 70.
Oversold
Defines the lower RSI level used to mark oversold conditions. The default value is commonly set around 30.
Midline
Defines the center level used to separate bullish and bearish RSI zones. The default value is 50.
────────────────────────────
HEIKEN ASHI MODE
Enable HA Smoothing
Turns RSI Heiken Ashi smoothing on or off.
HA Smooth Length
Controls the smoothing length used in the RSI Heiken Ashi calculation.
Mask Opposite Candles
When enabled, the indicator softens or hides RSI candles that move against the current HA RSI direction. This can make the oscillator easier to read in trend conditions.
────────────────────────────
DIVERGENCE
Divergence Lookback
Controls the pivot length used to detect price and RSI pivot points. A smaller value detects more divergences. A larger value is stricter and produces fewer signals.
Show Regular Div
Shows or hides regular bullish and bearish divergences.
Show Hidden Div
Shows or hides hidden bullish and bearish divergences.
Show Divergence Lines
Shows or hides the lines connecting RSI pivot points during divergence signals.
Require Volume-Confirmed Divergence
When enabled, divergences must also match the selected volume confirmation condition.
Volume Confirmation Mode
Selects the type of volume behavior required:
* Spike
* Absorption
* Volume Fade
* Spike or Absorption
* Any
Divergence Volume Spike x MA
Defines how much volume must exceed its moving average to be considered a spike.
Absorption Wick Ratio
Defines the wick size required for absorption-style confirmation.
────────────────────────────
VOLUME PROFILE
Show Volume Profile
Shows or hides the relative volume columns in the oscillator panel.
Volume Profile Length
Controls the volume moving average length used to calculate relative volume.
Profile Bar Width
Controls the visual width of the volume profile columns.
────────────────────────────
DNA VISUAL
Show DNA Strands
Shows or hides the wave-style visual strands in the oscillator panel. This is disabled by default for a cleaner layout.
DNA Wave Frequency
Controls how fast the visual strands oscillate.
DNA Amplitude
Controls how far the visual strands move around the midline.
────────────────────────────
FAILURE SWING ENGINE
Enable Failure Swing Engine
Turns RSI failure swing detection on or off.
Show Failure Swing Break Lines
Shows or hides the break level line used by the failure swing engine.
RSI Failure Swing Pivot
Controls the pivot sensitivity used for failure swing detection.
Require OB/OS Origin
When enabled, bullish failure swings must begin from oversold conditions and bearish failure swings must begin from overbought conditions.
Failure Swing Label Size
Controls the size of failure swing labels.
────────────────────────────
MTF RSI MATRIX
Show MTF RSI Matrix In Dashboard
Shows or hides the multi-timeframe RSI values in the dashboard.
Matrix TF 1
First RSI timeframe displayed in the matrix.
Matrix TF 2
Second RSI timeframe displayed in the matrix.
Matrix TF 3
Third RSI timeframe displayed in the matrix.
Matrix TF 4
Fourth RSI timeframe displayed in the matrix.
Matrix TF 5
Fifth RSI timeframe displayed in the matrix.
These timeframes can be adjusted to match scalping, intraday, swing, or higher-timeframe analysis.
────────────────────────────
HTF BIAS FILTER
Enable HTF Bias Filter
Turns higher timeframe filtering on or off.
HTF Bias Timeframe
Selects the higher timeframe used for bias filtering.
HTF Bias Mode
Selects the filter method:
* EMA
* RSI
* EMA + RSI
HTF EMA Length
Controls the EMA length used for higher timeframe trend bias.
HTF RSI Bull Level
Defines the RSI level required for bullish higher timeframe confirmation.
HTF RSI Bear Level
Defines the RSI level required for bearish higher timeframe confirmation.
────────────────────────────
RSI SQUEEZE MODE
Enable RSI Squeeze Mode
Turns RSI compression detection on or off.
Squeeze Length
Controls the lookback length used to measure RSI compression.
Compression Distance Around Mid
Defines how close RSI must stay around the midline to be considered compressed.
Max RSI StdDev In Squeeze
Defines the maximum RSI standard deviation allowed during compression.
Release Distance From Mid
Defines how far RSI must move away from the midline to mark a release.
Post-Squeeze Release Window
Defines how many bars after compression can still qualify as a squeeze release.
────────────────────────────
CANDLE COLOR MODE
Candle Color Mode
Allows chart candles to be colored using the selected logic.
RSI Midline Mode
Colors candles based on whether RSI is above or below the midline.
HTF Bias Mode
Colors candles based on the selected higher timeframe bias.
High/Low Structure Mode
Colors candles using simple structure logic:
* Bullish when price makes a higher high and higher low
* Bearish when price makes a lower high and lower low
This mode is designed to be easy to read for beginners.
────────────────────────────
MINI TUTORIAL
────────────────────────────
1. Add the indicator to the chart.
2. Start with default settings.
3. Look at the RSI line:
* Above the midline means bullish RSI pressure.
* Below the midline means bearish RSI pressure.
* Above the overbought level means RSI is in an upper extreme zone.
* Below the oversold level means RSI is in a lower extreme zone.
4. Check the dashboard:
The dashboard shows the current RSI value, trend state, zone state, divergence status, volume behavior, higher timeframe bias, and multi-timeframe RSI values.
5. Watch for divergences:
A bullish divergence can appear when price makes a lower low while RSI makes a higher low.
A bearish divergence can appear when price makes a higher high while RSI makes a lower high.
6. Use volume confirmation carefully:
If volume-confirmed divergence is enabled, the divergence must also match the selected volume condition. This can reduce the number of signals.
7. Use the MTF RSI Matrix:
If most timeframes show RSI above the midline, momentum is generally stronger on the bullish side.
If most timeframes show RSI below the midline, momentum is generally weaker or bearish.
Mixed readings usually mean the market is less clear.
8. Use the HTF Bias Filter:
When this filter is enabled, signals are filtered by the selected higher timeframe condition. This can help focus only on signals aligned with the larger context.
9. Use RSI Squeeze Mode:
When RSI compresses around the midline, momentum is quiet. A release can show when RSI expands away from the compression zone.
10. Use candle color mode as a visual guide:
For beginners, High/Low Structure mode can make the chart easier to read by coloring candles based on simple structure behavior.
────────────────────────────
EXAMPLE USE CASES
────────────────────────────
Example 1: Momentum continuation
RSI is above the midline, the dashboard shows bullish momentum on multiple timeframes, and the HTF filter is bullish. This can help identify conditions where bullish continuation is stronger.
Example 2: Bearish divergence
Price makes a higher high, but RSI makes a lower high. A bearish divergence label appears. If volume confirmation is enabled, the signal must also match the selected volume behavior.
Example 3: Bullish reversal from oversold
RSI moves into oversold territory, then forms a bullish divergence or failure swing. The trader can use this as a warning that downside momentum may be weakening.
Example 4: RSI compression
RSI stays close to the midline and the squeeze background appears. A release signal can appear when RSI moves away from the compression zone.
Example 5: Beginner structure reading
Candle Color Mode is set to High/Low Structure. Candles become easier to read because bullish candles are based on higher highs and higher lows, while bearish candles are based on lower highs and lower lows.
────────────────────────────
BEST PRACTICES
────────────────────────────
Use this indicator as a momentum and context tool, not as a standalone trading system.
Use divergences together with support, resistance, trendlines, liquidity zones, or market structure.
Use higher timeframe confirmation when trading lower timeframes.
Use volume confirmation if you want fewer but more filtered divergence signals.
Avoid relying on signals during low-volume or highly volatile news-driven conditions.
Always test settings on the symbol and timeframe you trade.
────────────────────────────
LIMITATIONS
────────────────────────────
This script is an indicator, not a strategy.
It does not place orders.
It does not guarantee profitable results.
Divergences and failure swings can fail.
Pivot-based signals are confirmed only after the required number of bars.
Multi-timeframe readings depend on the selected timeframes.
Alerts depend on the alert settings selected by the user in TradingView.
Market context remains important. No oscillator should be used alone.
Indicateur

daPisa MA + RSIdaPisa + Simple RSI Div: Multi-Confluence Trend & Reversal Suite
The daPisa + Simple RSI Div (Pine Script v6) is an all-in-one technical analysis dashboard designed to blend structural trend-following with high-probability momentum exhaustion signals. By housing Dual Moving Averages, Bollinger Bands, an optimized RSI Divergence engine, and a Stochastic Oscillator within a single script, it provides traders with a clean, clutter-free workspace to identify confluence zones, trend reversals, and volatility breakouts.
🛠️ Key Components & Architecture
1. Primary Chart Elements (Force Overlay)
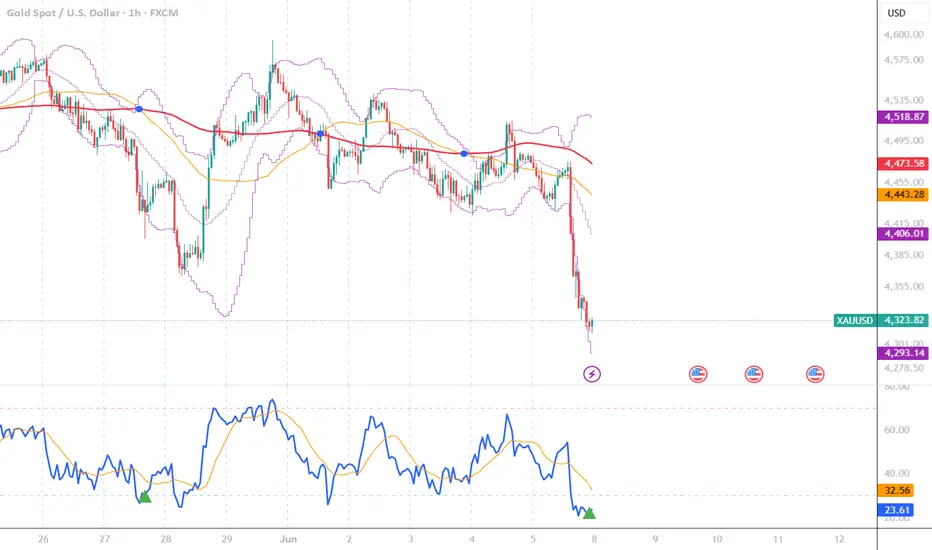
Dual Moving Averages: Tracks structural market direction utilizing a Fast MA (50) and a Slow MA (120). Trend shifts are explicitly highlighted on your main chart using Blue Intersection Marks at crossover/crossunder points.
Price Bollinger Bands: Displays standard volatility bands (20 Length, 2 StdDev) directly on the price chart to gauge squeeze phases and extension targets.
2. Advanced RSI Engine (Sub-Chart)
Native-Style RSI line: Built using TradingView's default algorithm for seamless continuity.
Flexible RSI-Based MA Options: Replicates default TV features by allowing you to choose between SMA, EMA, or Bollinger Bands applied directly to the RSI value. This helps filter out momentum noise and signals line crossovers or volatility bands expansion within the oscillator panel itself.
Filtered Divergence Alerts: Triggers clean Bullish and Bearish divergence markers.
3. Secondary Momentum Panel
Stochastic Oscillator: A fully adjustable Stochastic (%K, %D) line designed to act as a secondary trigger engine for fine-tuning entry windows when price interacts with major support/resistance or structural MA lines.
🎯 What Makes This Script Unique?
Anti-Clutter Divergence Logic: Traditional divergence indicators often suffer from "signal crowding" or over-plotting. This script utilizes precise, micro-pivot lookbacks (pivothigh/low 1, 1). Signals are evaluated exactly at the moment of pivot validation and plotted using a -1 bar offset to align perfectly with the exact price peak/trough.
Strict Exhaustion Filters: Divergences are only displayed if they occur within Overbought (≥70) or Oversold (≤30) territories. This drastically reduces false signals during choppy, sideways markets.
Customizable UI Toggles: Keep your chart workspace clean. You can toggle off the visual displays for the RSI or Stochastic panels individually with simple tick boxes in the settings menu.
💡 How to Trade with This Indicator
Trend Alignment: Identify the macro trend using the Fast and Slow MA crossovers. Look for price pullbacks toward the MA lines or the lower/upper Bollinger Bands.
Reversal Confirmation: Spot potential tops or bottoms when price prints higher highs/lower lows while the RSI plots a strict, overbought/oversold Divergence Arrow.
Execution Trigger: Use the Stochastic crossover (%K crossing %D) inside extreme zones to find the exact execution candle once the macro trend and RSI divergence have aligned.
🔔 Integrated Real-Time Alerts
This indicator comes pre-packaged with 6 essential alert conditions to keep you ahead of the market without constantly staring at the screen:
MA Golden Cross (Fast MA crosses above Slow MA)
MA Death Cross (Fast MA crosses below Slow MA)
RSI Bearish Divergence (Confirmed top reversal setup)
RSI Bullish Divergence (Confirmed bottom reversal setup)
Stoch Bullish Cross (%K crossing above %D)
Stoch Bearish Cross (%K crossing below %D)
Disclaimer: Past performance does not guarantee future results. Always practice proper risk management and utilize this script alongside your broader trading framework. Indicateur

SOL RSI DCA - Long IndicatorSOL RSI DCA - Long Indicator
🔷 What it does:
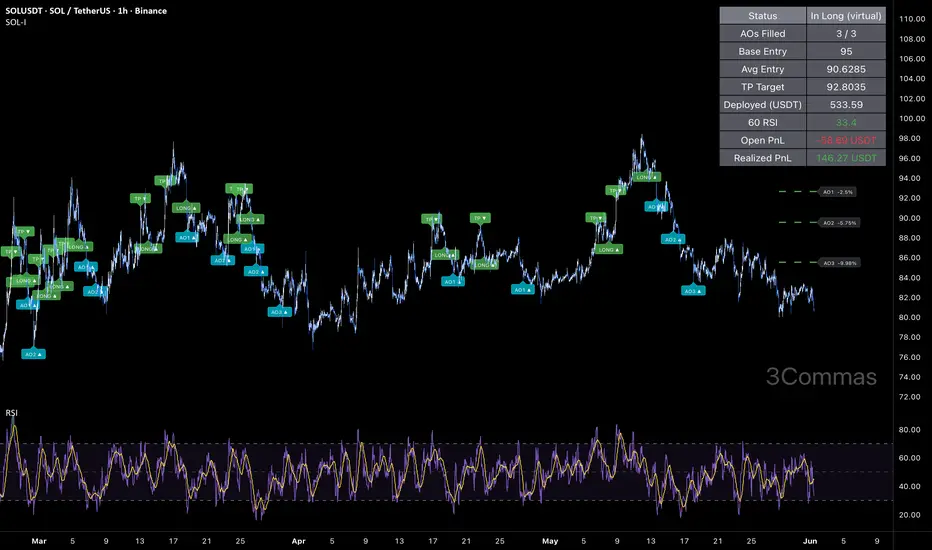
This is a signal-only indicator that mirrors a long-only DCA workflow on SOL. It tracks one virtual long position at a time, opened while higher-timeframe momentum is depressed, then averages the position down on a measured geometric price-deviation ladder with up to three averaging orders. The base entry arms whenever the 1-hour RSI(14) sits below a configurable level (default 44). Averaging is price-driven only — no extra momentum gate — matching the source bot configuration. Exit is a fixed Take Profit at 2.4% above average entry. Every event emits a webhook-ready JSON payload for a DCA Bot.
- HTF RSI entry gate: base order arms while 1h RSI(14) is below the threshold (Less Than condition).
- Geometric averaging ladder: deviations −2.50%, −5.75%, −9.98%; sizes 87.5, 109.4, 136.7 USDT on a 1.3× deviation step × 1.25× size step.
- Fixed Take Profit: 2.4% above running average entry, no trailing.
- Honest virtual bookkeeping: total cost and qty updated incrementally on every fill — avg entry, deployed capital, open PnL, and cumulative realized PnL displayed live.
- Five discrete events per cycle (entry + 3 AO fills + TP), each with its own webhook payload.
🔷 Who is it for:
- Swing traders running a DCA Bot on SOL who want systematic long exposure when momentum is soft, scaling in if the dip deepens.
- Bot operators who want a chart-driven signal source that emits per-event JSON ready for a DCA Bot.
- DCA-style traders who prefer a measured geometric ladder over an aggressive doubling schedule.
- Traders who want to monitor an evolving DCA position — base entry, owned AO levels, deployed capital, open PnL, realized PnL, live RSI reading — directly on the chart without the strategy-tester overhead.
🔷 How does it work:
Entry RSI Filter (HTF Oversold): A 1-hour RSI(14) is sampled via request.security with lookahead disabled (no repaint). The base order arms whenever this RSI is below the configured level (default 44). At host-bar close, if the indicator is flat, the virtual long position opens.
Averaging Order Ladder (Price-Driven): After the base fill, the indicator watches price deviation against the position. The k-th averaging order fires when close ≤ base entry × (1 − cumulative deviation). Cumulative deviation grows by the 1.3× step multiplier: 2.50%, 5.75%, 9.98%. Each averaging order's virtual size grows by the 1.25× size multiplier: 87.5, 109.4, 136.7 USDT. Averaging is gated by price only — no extra RSI condition, matching the source bot configuration.
Honest Virtual Bookkeeping: Total cost and qty are updated incrementally on every fill, so the avg entry, deployed capital, open PnL, and cumulative realized PnL displayed in the status table reflect the actual broker-equivalent position state — no shortcut from base entry, no synthetic averaging.
Exit: A fixed Take Profit at 2.4% above the running average entry. When close hits the TP target, the close webhook fires, the realized PnL accumulator banks the gain, and the virtual position resets.
🔷 Why it's unique:
- HTF RSI Entry Gate: The base order keys off a 1-hour RSI(14) rather than the chart timeframe, so entries are anchored to the higher-timeframe momentum picture instead of intrabar noise.
- Measured Geometric Ladder: A 1.3× deviation step paired with a 1.25× size step keeps the average entry compounding controlled — the position deepens gradually rather than ballooning, which keeps maximum deployment near 5% of equity.
- Fill-by-Fill Avg Entry: The orange avg-entry line is derived from running totals updated on every event — what you see is what the broker-equivalent position would actually have.
- Realized PnL Readout: The status table shows cumulative realized PnL banked across closed cycles, so the chart reflects how the workflow has performed over the visible history, not just the open position.
- Per-Event Webhook Ledger: Five distinct events per cycle, each with its own JSON alert payload. The indicator drives a DCA Bot end-to-end through a single TradingView alert.
🔷 Considerations Before Using the Indicator:
Market & Timeframe: Designed for liquid crypto pairs. Default thresholds are calibrated for BINANCE:SOLUSDT spot, with the RSI filter on 1h. Run on a 1h chart (or lower for finer averaging-order fills). Different pairs may need RSI level and deviation ladder tuning.
Entry Is a Level, Not a Cross: The base order uses a Less Than condition (RSI < 44), matching the source bot. After a Take Profit, if RSI is still below 44 the indicator can immediately reopen a new virtual deal. This produces more frequent re-entries than a cross-down trigger — intended behavior, but review it against your risk appetite.
Cross Detection Granularity: Entries and AO fills are evaluated on bar close. A bar that spikes through a level and returns within the same bar may be missed by design — this matches realistic polling behavior and avoids over-signaling on intra-bar wicks.
Live vs Historical State: The virtual position state is rebuilt from chart history each time the indicator is recompiled. If the indicator is added mid-deployment or the live bot diverges from the signal stream (manual interventions, partial fills), the indicator state may not match the live bot. Toggle the indicator off and on to reset.
Capital Deployment: If all three averaging orders fill, the virtual position scales from 200 USDT base to ~534 USDT total. Match the indicator's per-order allocation to your bot's configuration to keep the avg-entry display honest.
No Stop Loss: There is no exit signal on adverse moves beyond the 3-AO ladder. Risk is structurally capped on the bot side by the bounded position-size ladder. If a hard exchange-side stop is required, configure it on the bot directly.
Strong Downtrends: Like any dip-buying setup, this is positioned for mean reversions, not waterfall declines. In a sustained downtrend the ladder fills out and the position holds underwater until price recovers to the 2.4% TP above average. The bounded ladder limits the size of that exposure, but underwater hold time can still extend.
Backtesting Note: This is an indicator, not a strategy. There is no built-in P&L tester. For performance metrics over a ~3.5-month sample (29 closed trades, 86.21% win rate, 0.63% max drawdown, profit factor 22.256, +0.83% net return), use the companion strategy version on identical parameters. The 29-trade sample is well below the typical ≥100 floor for statistical confidence, and the high-win/low-frequency profile rests on a fixed 2.4% TP being hit most of the time — re-run on a 12+ month window for a more robust validation before drawing firm conclusions.
🔷 How to Use It:
🔸 Add the indicator to a 1h chart on the crypto pair you want to trade.
🔸 Review the entry RSI filter (timeframe / length / level), the 3-AO ladder parameters, and the Take Profit percentage. Defaults are calibrated for SOLUSDT 1h — recalibrate per asset before deploying.
🔸 Set Base Order Size and AO sizes to match your bot's configuration (the indicator's avg-entry display becomes meaningful when virtual sizing matches real sizing).
🔸 In the DCA Bot Webhook group, paste the Bot ID, Email Token, and Pair (QUOTE_BASE format, e.g., USDT_SOL).
🔸 Create an alert on the indicator with "Any alert() function call". Paste the DCA Bot's webhook URL into the alert's Webhook field. The indicator will emit JSON payloads for entry, each averaging order, and TP exit — formatted for direct DCA Bot consumption.
🔷 INDICATOR SETTINGS
Base Order Size (USDT): Virtual order size for the avg-entry / open-PnL computation.
Averaging Orders per Trade: Maximum number of averaging orders per cycle (default 3).
First AO Size (USDT): Virtual size of the first averaging order; subsequent AOs scale by the Size Multiplier.
Deviation to First AO (%): Distance from base entry at which AO1 becomes eligible.
Deviation Step Multiplier: Ladder factor that widens each subsequent deviation step.
Order Size Multiplier: Factor that grows each subsequent averaging order's USDT size.
Entry RSI Timeframe / Length / Level: Higher-timeframe RSI filter that arms the base entry (Less Than condition).
Take Profit (%): Fixed distance above the running average entry where the virtual long closes.
DCA Bot Webhook: Bot ID, Email Token, and Pair fields injected into every alert payload.
Visualization: Toggle AO Ladder, Avg / TP plot lines, fill labels, signal triangles, status table (including cumulative realized PnL).
Brand Watermark: Configurable text, position, size, and transparency.
👨🏻💻💭 We hope this tool helps enhance your trading. Your feedback is invaluable, so feel free to share any suggestions for improvements or new features you'd like to see implemented.
__
The information and publications within the 3Commas TradingView account are not meant to be and do not constitute financial, investment, trading, or other types of advice or recommendations supplied or endorsed by 3Commas and any of the parties acting on behalf of 3Commas, including its employees, contractors, ambassadors, etc. Indicateur

Gaspard98 - RSI Glissant# Gaspard98 ⊛ RSI Glissant — Sliding RSI projected on price
## Overview
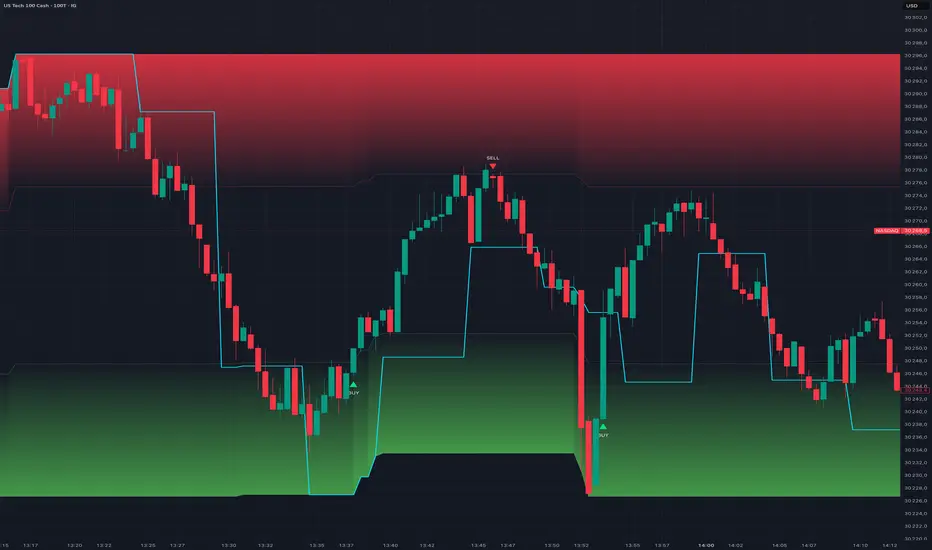
**RSI Glissant** ("Sliding RSI") is an on-chart overlay that takes a multi-timeframe RSI, re-scales it dynamically over a rolling window, and projects the result directly onto the price band. Instead of reading an oscillator in a separate sub-pane, you see an adaptive RSI curve riding inside the recent high/low range of price, with overbought and overload zones drawn as price levels you can actually trade against.
The goal is simple: keep your eyes on price, but with RSI context built into the chart itself.
---
## Concept — why "sliding"
A classic RSI moves between 0 and 100 against fixed thresholds. The problem is that in trending or low-volatility regimes the raw RSI rarely reaches those extremes, so 70/30 stop being meaningful.
This indicator solves that with two layers:
1. **Adaptive normalization.** The raw MTF RSI is re-normalized to a 0–100 scale over its own rolling range (the *Sliding Range*). The highest and lowest RSI readings of the lookback window become the new 100 and 0. The oscillator therefore always "breathes" across the full scale and stays responsive to the current regime.
2. **Projection onto price.** That normalized curve is then mapped onto the price band — defined by the highest high and lowest low of the same rolling window. A value of 0 sits on the band floor, 100 on the band ceiling. The overbought (default 70) and oversold (default 30) thresholds become two horizontal **price levels**, not abstract oscillator lines.
The result is a cyan curve and two zone lines that live on the candles, scaling automatically as the market range expands or contracts.
---
## Signals
Signals are triggered by **price closing back through the projected zone lines**, which keeps them anchored to actual price action rather than to the oscillator alone:
- **BUY** — price closes back **above** the projected oversold level (exit from the lower/green zone).
- **SELL** — price closes back **below** the projected overbought level (exit from the upper/red zone).
This is a mean-reversion logic: the indicator looks for price leaving an extreme zone rather than simply touching it.
### Optional signal filters
- **Heikin Ashi confirmation** — BUY only fires on a green HA candle, SELL only on a red HA candle.
- **Strict alternation** — never two BUYs (or two SELLs) in a row; the system waits for an opposite signal before repeating.
- **All signals (no filter)** — shows every qualifying close, ignoring alternation and the HA filter, for testing or discretionary reading.
---
## Visuals
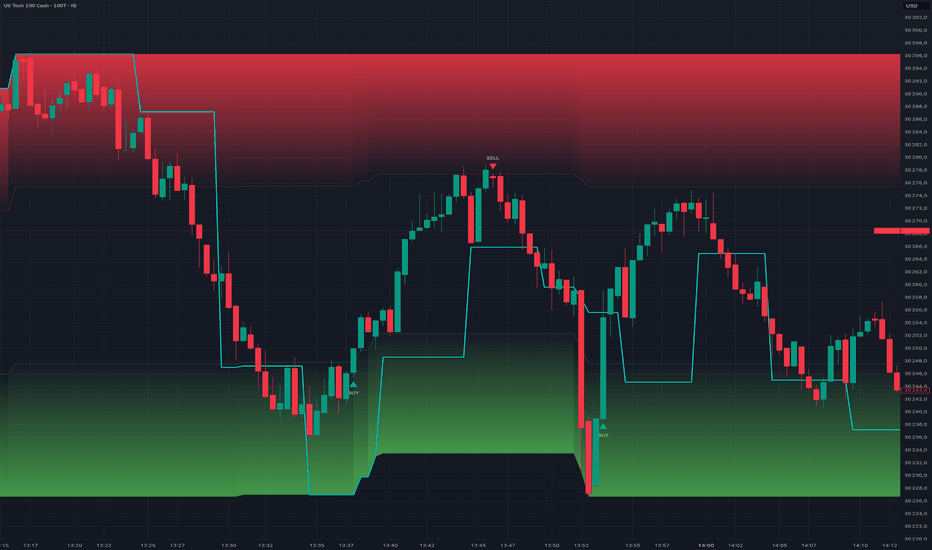
- **Cyan line** — the sliding RSI curve projected onto price.
- **Red / green guide lines** — the overbought and oversold thresholds projected onto price.
- **Gradient fill** — red intensifies above the overbought level, green intensifies below the oversold level, giving an instant read of how stretched price is inside its range.
- **BUY / SELL labels** — plotted on the bars that trigger.
---
## Settings
**RSI MTF**
- *Source* — price source for the RSI (default Close).
- *RSI Length* — RSI period (default 14).
- *RSI Timeframe* — the higher timeframe the RSI is computed on (default 5 min).
- *Anti-repaint* — see the repaint note below.
**OB / OS Zones**
- *Overbought level* (default 70) and *Oversold level* (default 30).
**Sliding Band**
- *Sliding Range (bars)* — lookback used for both the RSI re-normalization and the price band (default 150).
- *OB/OS guide lines* — show/hide the projected threshold lines.
- *Out-of-zone gradient* — show/hide the red/green fill.
**Signals**
- *Confirm with HA color*, *All signals*, *Strict BUY/SELL alternation* — as described above.
---
## How to use
1. Pick an RSI timeframe higher than your chart timeframe for cleaner context (e.g. 5 min RSI on a 1 min chart).
2. Adjust the *Sliding Range* to your style — shorter for reactive intraday work, longer for smoother swing context.
3. Treat the green/red zones as adaptive stretch zones: a BUY signal marks price leaving the lower zone, a SELL marks price leaving the upper zone.
4. Combine with your own trend filter or structure read — the signals are reversion-oriented and work best with confluence.
---
## Repaint disclosure
By default (*Anti-repaint* OFF), the indicator uses the live, in-progress value of the higher-timeframe RSI. While the current HTF bar is still forming, that value can change, so the most recent reading and signal **may repaint** until the HTF bar closes.
Turning *Anti-repaint* **ON** forces the indicator to use only the last **confirmed** higher-timeframe value (offset by one bar with `lookahead_off`). Signals are then non-repainting and confirmed, at the cost of being slightly later. Choose ON for honest backtesting and alert-driven workflows.
---
## Alerts
Two alert conditions are provided, **BUY — exit OS** and **SELL — exit OB**, plus built-in `alert()` calls that fire once per bar close. Set them to "Once per bar close" to match the indicator's confirmation logic.
---
## Disclaimer
This indicator is a technical analysis tool provided for educational and informational purposes only. It is not financial advice and does not guarantee any result. Past behavior of any signal does not predict future performance. Always do your own research and manage your own risk.
© Gaspard98 Indicateur
Stratégie
Zookoff-Zookonacci Cipher B + DivergencesThe Zook Ciphernator — Cipher B
The Zook Ciphernator is a multi-layer momentum, divergence, and reversal dashboard inspired by the classic Cipher B / VuManChu-style oscillator layout, but redesigned with cleaner visuals, improved toggle control, flexible display positioning, enhanced RSI divergence options, and a more refined dot/legend system.
This indicator is designed to help read momentum shifts, exhaustion, divergence, and possible reversal conditions in one pane. It is not intended to be used as a standalone buy/sell system. The signals are contextual tools and should be combined with price action, market structure, volume, risk management, and your own trading plan.
Core Components
WaveTrend
WaveTrend is the main momentum structure of the indicator.
It consists of:
Fast WaveTrend
Slow WaveTrend
The fast WaveTrend crossing above or below the slow WaveTrend can indicate a possible momentum shift.
In this version, the WaveTrend hills are rendered as layered blue/dark areas so the interaction between the fast and slow waves is easier to read visually.
WaveTrend is also used for standard buy/sell signals, WaveTrend divergence, and the Gold Dot logic.
Fast WT / VWAP
The VWAP layer in this indicator is not traditional price VWAP.
Here, it is calculated from the gap between the fast WaveTrend and the slow WaveTrend. In other words, it acts like a fast WaveTrend impulse layer.
When it rises, it suggests the fast WaveTrend is gaining strength relative to the slow WaveTrend. When it falls, it suggests momentum is weakening.
It can often give an earlier clue that momentum is starting to turn before the full WaveTrend structure becomes obvious.
Money Flow
The Money Flow area is a background pressure gauge.
It helps show whether the recent candle structure is leaning bullish or bearish.
Cyan Money Flow = bullish pressure
Red Money Flow = bearish pressure
This Money Flow is best used as context, not as a direct entry trigger. For example, a bullish reversal setup is usually cleaner if Money Flow is improving, flattening, or moving back toward positive territory.
Stochastic RSI
Stochastic RSI is included as a timing tool.
It is useful for identifying when momentum is stretched, bottoming, topping, or beginning to turn.
Typical use:
Low Stoch RSI beginning to curl up = possible early bullish timing clue
High Stoch RSI beginning to roll over = possible early bearish timing clue
Stochastic RSI can be displayed in the upper or lower half of the pane using the display-position controls.
RSI
RSI is included with optional smoothing, overbought/oversold guide levels, and divergence detection.
The RSI line uses dynamic colouring:
Gold = neutral RSI zone
Cyan = RSI oversold zone
Red = RSI overbought zone
The RSI smoothing line can be used as a quieter reference line to help see the broader RSI direction.
RSI can also be displayed in the upper or lower half of the pane.
RSI Divergence Engines
The indicator includes two RSI divergence modes.
1. Cipher Classic
This uses a stricter, confirmed-fractal style divergence method.
It tends to produce fewer signals, but they are cleaner and more selective.
2. Realtime Pivot
This uses a more responsive pivot-scanning divergence engine.
It can detect more RSI divergences and can pick them up earlier. Because it can work closer to the current candle, some signals may change or disappear before confirmation.
There is also an Auto mode:
When WaveTrend is visible, RSI divergences default toward the classic cipher style.
When WaveTrend is hidden, RSI divergences can use the realtime pivot style.
Schaff Trend Cycle
Schaff TC is an optional trend-cycle filter.
It is based on MACD-style momentum, then normalized into a cyclic oscillator. It can help show whether the broader momentum cycle is improving or weakening.
It is not a primary entry trigger, but it can be useful as a background confirmation tool.
Schaff TC can also be displayed in the upper or lower half of the pane.
Sommi Flag and Sommi Diamond
The indicator also includes the original Sommi-style Flag and Diamond pattern logic.
These are optional advanced signals that combine WaveTrend behaviour with higher-timeframe context.
Sommi Flag
The Sommi Flag is designed to highlight potential continuation or reversal-style conditions using:
Money Flow direction
WaveTrend position
WaveTrend cross direction
Higher-timeframe VWAP / Fast WT behaviour
A bearish Sommi Flag can appear when Money Flow is weak, WaveTrend is elevated and crossing down, and the higher-timeframe Fast WT / VWAP context is bearish.
A bullish Sommi Flag uses the opposite logic.
Sommi Diamond
The Sommi Diamond uses higher-timeframe Heikin Ashi candle direction together with WaveTrend crossing behaviour.
A bearish Sommi Diamond can appear when higher-timeframe Heikin Ashi candles are bearish and WaveTrend crosses down from a relevant level.
A bullish Sommi Diamond uses the opposite logic.
How to Use Sommi Signals
Sommi signals should be treated as optional confluence markers, not standalone trade signals.
They are most useful when they agree with the broader context shown by:
WaveTrend
Money Flow
VWAP / Fast WT
Stochastic RSI
RSI divergence
Price structure
Because this version of the Zook Ciphernator focuses mainly on WaveTrend, RSI, Stoch RSI, Money Flow, VWAP, and the dot system, the Sommi tools remain available as legacy/advanced features for users who like that style of signal filtering.
Display Position Controls
The indicator includes quick display controls for:
RSI
Stochastic RSI
Schaff TC
Each can be set to:
Auto
Upper
Lower
Auto uses the current adaptive layout rules. Upper and Lower allow manual override.
This makes it easier to avoid visual clashes between RSI, Stochastic RSI, WaveTrend, and Schaff TC.
Dot Legend
TOP ROW DOTS
Purple/pink dot = RSI bearish divergence
Price has made a higher high, but RSI has made a lower high. This suggests upside momentum may be weakening.
Red dot, slightly faded = Standard WaveTrend sell signal
The fast WaveTrend crosses down through the slow WaveTrend while WaveTrend is in an overbought area.
Red dot, brighter = Standard WaveTrend sell signal + confirmed WaveTrend bearish divergence
The normal WaveTrend sell signal has triggered and it coincides with a confirmed WaveTrend bearish divergence. This means price has pushed higher, but WaveTrend has failed to make a stronger high.
BOTTOM ROW DOTS
Lime dot = RSI bullish divergence
Price has made a lower low, but RSI has made a higher low. This suggests downside momentum may be weakening.
Cyan dot, slightly faded = Standard WaveTrend buy signal
The fast WaveTrend crosses up through the slow WaveTrend while WaveTrend is in an oversold area.
Cyan dot, brighter = Standard WaveTrend buy signal + confirmed WaveTrend bullish divergence
The normal WaveTrend buy signal has occurred and it coincides with a confirmed WaveTrend bullish divergence. This means price has pushed lower, but WaveTrend has failed to make a weaker low.
Gold dot, larger = Stronger bullish reversal setup
This is a higher-alert bullish reversal condition. It generally combines a bullish divergence / oversold WaveTrend structure with RSI oversold confirmation.
Important: the Gold Dot is not an instruction to buy immediately. It is a warning that a potentially stronger reversal setup may be forming. Confirmation from price action, structure, and your trading plan is still required.
DOTS ON THE WAVETREND HILLS
Red dot on WaveTrend hill = Fast WaveTrend crossing down through slow WaveTrend
This marks a possible bearish momentum shift.
Cyan dot on WaveTrend hill = Fast WaveTrend crossing up through slow WaveTrend
This marks a possible bullish momentum shift.
These hill dots mark all WaveTrend crosses. They are useful for reading momentum shifts, but they are not the same as the stronger top/bottom row buy/sell signals.
Visibility Behaviour
The top and bottom row dots are designed to remain in place even if the WaveTrend hills are hidden.
This allows you to hide the WaveTrend visual layer while still preserving the key signal information.
Similarly, RSI divergence dots can remain visible even if the RSI line itself is hidden.
Suggested Reading Framework
A simple way to read the indicator:
Stochastic RSI = timing and stretched momentum
WaveTrend = main momentum structure
VWAP / Fast WT = early impulse clue
Money Flow = background pressure
RSI divergences = momentum disagreement with price
Gold Dot = stronger bullish reversal warning
Schaff TC = optional trend-cycle confirmation
Sommi Flag / Diamond = optional higher-timeframe confluence markers
For bullish setups, look for oversold conditions, improving VWAP / Fast WT, Stoch RSI turning up, bullish divergence, and Money Flow stabilising or improving.
For bearish setups, look for overbought conditions, weakening VWAP / Fast WT, Stoch RSI rolling over, bearish divergence, and Money Flow weakening.
Future Development
This version focuses on the core Cipher B-style workflow: WaveTrend, VWAP / Fast WT, Money Flow, Stochastic RSI, RSI divergence, Schaff TC, Sommi tools, and the refined dot system.
Future iterations may include additional modules such as:
MACD-based confirmation
DSS Bressert
Further divergence refinements
Additional display and confluence options
These may be added in future versions if they improve the indicator without making the layout too cluttered.
Disclaimer
This indicator is for educational and analytical use only. It does not provide financial advice and should not be treated as a standalone trading system.
No signal is guaranteed. Always use proper risk management and make your own trading decisions.
Some examples of customisable views:
Stripping down to just RSI and Stoch RSI while dots are preserved:
Indicateur

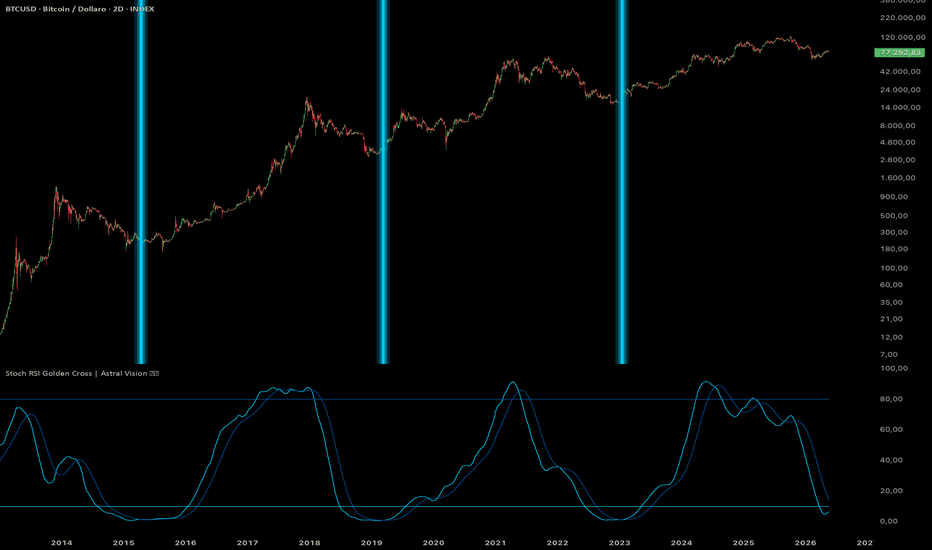
Stoch RSI Golden Cross | Astral Vision Stoch RSI Golden Cross | Astral Vision 🌠💠
This indicator applies a Stochastic RSI computed on a fixed 5-day timeframe, using deliberately long lookback periods that filter out short-term noise and produce a slowly-turning oscillator oriented toward identifying major cycle inflection points rather than frequent trading signals. Crossovers between the K and D lines are only considered valid when they occur within the oversold or overbought zones, ensuring that signals correspond to genuine momentum reversals from extreme positioning rather than midrange noise crosses.
Calculation ⚙️
The RSI is computed over 121 periods on the 5-day timeframe. The Stochastic of that RSI is then computed over 144 periods, measuring where the current RSI value sits within its highest-to-lowest range over the past 144 bars. This raw Stochastic is smoothed with a 33-period simple moving average to produce the K line. A second 25-period simple moving average is then applied to K to produce the D signal line.
The use of a 5-day timeframe with these long periods means each bar represents one trading week, and the full K lookback of 144 bars covers approximately 2.75 years of weekly data. This makes the oscillator insensitive to anything shorter than multi-month momentum shifts, functioning as a macro cycle tool rather than a swing trading indicator.
A bullish golden cross signal fires when K crosses above D while both lines are below the oversold threshold (default 10), meaning the crossover occurs from a position of statistically extreme pessimism. A bearish cross signal fires when K crosses below D while both lines are above the overbought threshold (default 80), meaning the crossover occurs from a position of statistically extreme optimism. Crosses that occur in the neutral zone between the two thresholds are ignored entirely.
Each valid signal draws a vertical line with a four-layer glow effect on the price chart, marking the exact bar at which the signal occurred and extending across the full chart height for maximum visibility.
Plots 📊
K line in the sub-panel
D signal line in the sub-panel
Oversold threshold line at 10
Overbought threshold line at 80
Glow vertical lines on the price chart at each valid bullish cross
Glow vertical lines on the price chart at each valid bearish cross (toggleable)
Inputs 🎛️
Show Only Bullish Golden Cross: toggle to hide bearish cross signals and show only bullish ones
Colors 🎨
5 Astral Vision presets + custom override. Default: Inferno.
Purpose 🎯
A standard Stochastic RSI with default parameters (14/14/3/3) generates dozens of signals per year, most of which are noise on a macro timeframe. This implementation uses a 5-day bar combined with extended lookback periods to reduce the signal count to a handful per multi-year cycle, corresponding only to the deepest oversold recoveries and most extreme overbought reversals. The zone filter adds a second condition that eliminates all midrange crosses, further concentrating the signal set on statistically meaningful structural turning points. The result is an indicator designed to fire rarely and only at potentially significant macro inflection points rather than as a continuous trading signal generator.
Disclaimer ⭕️
This indicator is for informational and educational purposes only. It does not constitute financial advice. Past performance is not indicative of future results. Always do your own research before making investment decisions. Indicateur
USDT Market Cap Stochastic RSI | Astral Vision USDT Market Cap Stochastic RSI | Astral Vision 🌠💠
Inspired by @GeoMetric_9 idea.
This indicator applies a Stochastic RSI to the market capitalization of USDT rather than to any price series, producing an oscillator that measures the momentum and cyclical positioning of stablecoin supply expansion and contraction. The underlying logic is that USDT market cap is a direct proxy for the pool of deployable capital sitting on the sidelines of the crypto market: tracking its momentum with a Stochastic RSI reveals whether that capital is accelerating into or out of the ecosystem, which historically precedes or coincides with significant directional moves in Bitcoin and the broader market.
Calculation ⚙️
The first step is computing a standard RSI on the USDT market cap series over a configurable lookback. The RSI formula measures the average gain relative to the average loss over the period: average gain divided by the sum of average gain and average loss, multiplied by 100. This transforms the raw market cap series into a momentum oscillator bounded between 0 and 100.
The second step applies the Stochastic formula to the RSI values rather than to price. The Stochastic takes the current RSI value, subtracts the lowest RSI value over the stochastic lookback window, and divides by the range between the highest and lowest RSI values over the same window, multiplied by 100. The result, called the raw K line, measures where the current RSI sits within its own recent range, producing a reading that oscillates between 0 and 100 and is more sensitive to short-term reversals than the RSI alone.
The raw K is then smoothed with a simple moving average over the K smoothing period, producing the final K line. A second simple moving average is applied to the smoothed K over the D smoothing period, producing the D signal line. The fill between K and D visualizes their divergence and convergence over time.
The indicator operates on a configurable timeframe independent of the chart, defaulting to weekly, which filters out daily noise in USDT market cap reporting and produces structurally cleaner signals. A configurable midline (default 50) separates bullish from bearish momentum regimes. A signal highlight window activates for a configurable number of bars after K crosses above the midline, marking the early phase of a potential regime shift on the price chart.
Plots 📊
K line: smoothed Stochastic of the USDT market cap RSI, colored by regime
D line: signal line smoothed from K
Fill between K and D
Midline reference
Background color in the sub-panel reflecting current bullish or bearish regime
Signal highlight on the price chart for a configurable number of bars after K crosses the midline
Candle coloring on the price chart reflecting the previous bar's K regime
Inputs 🎛️
RSI Length: lookback for the RSI applied to USDT market cap
Stochastic Length: lookback for the Stochastic applied to the RSI values
K Smoothing: SMA period applied to the raw Stochastic output
D Smoothing: SMA period applied to the smoothed K line
Timeframe: resolution of the USDT market cap data, independent of the chart
Midline: threshold separating bullish and bearish momentum regimes
Signal Highlight Bars: number of bars the price chart highlight remains active after a midline crossover
Colors 🎨
5 Astral Vision presets + custom override. Default: Paradiso.
Purpose 🎯
A standard Stochastic RSI applied to Bitcoin price measures Bitcoin's own momentum in isolation. This indicator measures the momentum of an entirely separate variable: the supply of capital available to enter the market. A K line crossing above the midline on weekly timeframe does not mean Bitcoin is going up immediately; it means the rate of stablecoin creation is accelerating relative to its own recent history, which is a structurally earlier and causally distinct signal. Applying the Stochastic RSI rather than a simpler momentum measure adds the cyclical positioning dimension: it shows not just whether USDT supply is growing, but whether that growth is at an extreme or early stage relative to its own historical oscillation range.
Disclaimer ⭕️
This indicator is for informational and educational purposes only. It does not constitute financial advice. Past performance is not indicative of future results. Always do your own research before making investment decisions. Indicateur

Indicateur

Hunters Reversal v2.3
Three independent reversal signals, each detecting a different type of turning point. When multiple signals cluster together within a short window, the probability of reversal increases significantly.
Part of the Hunters Framework ... WHERE / WHEN / WHY
SIGNAL 1: LIQUIDITY SWEEP
Detects when price wicks beyond a confirmed pivot high or low, triggers the stops sitting there, then closes back inside. This is the "stop hunt" pattern.
Unlike simple wick detection, this version requires:
- The level being swept must be a confirmed pivot (not just a rolling extreme)
- The sweep candle must penetrate the level by a minimum amount (filters noise) but not too far (filters breakouts)
- Post-sweep confirmation: price must stay below/above the sweep extreme for N bars before the signal fires
- Signal is plotted retroactively at the actual sweep bar once confirmed
This eliminates the majority of false sweeps that plague simpler implementations.
SIGNAL 2: RSI DIVERGENCE
Classic divergence between price and RSI at confirmed pivot points.
- Bearish: price makes a higher high but RSI makes a lower high
- Bullish: price makes a lower low but RSI makes a higher low
Requires a minimum distance between the two pivots being compared (default 15 bars) to filter out noise from pivots that are too close together.
SIGNAL 3: PIVOT + EXTENSION
Fires when price forms a confirmed pivot at an extreme distance from the EMA. This catches overextended moves that are likely to snap back.
Requirements:
- The pivot must be the highest high (or lowest low) within a lookback window
- The distance from the EMA must exceed a configurable ATR multiple (default 3x ATR)
These are the rubber-band snapback setups ... price stretched too far from the mean.
TIER CLASSIFICATION (BIG SIGNALS)
When two or more of the three signals fire within a short window (default 8 bars), a large "BIG" triangle appears. These cluster signals represent the highest confidence reversals because multiple independent conditions are confirming the same turning point.
For example: a liquidity sweep at an overextended pivot WITH RSI divergence ... that is three separate reasons saying "this move is done."
INVALIDATION
Every signal comes with a built-in invalidation check. If price moves too far beyond the signal level within a configurable window (default 8 bars, 0.6 ATR), an X marker appears showing the signal was invalidated. This keeps you honest ... no holding a losing position hoping the reversal still plays out.
COOLDOWN
A per-direction cooldown (default 20 bars) prevents signal spam. After a bear signal fires, no new bear signals for 20 bars. Bull signals are tracked independently.
SETTINGS OVERVIEW
Pivot Detection:
- Left/Right bars for pivot confirmation (default 15/5)
- Minimum prominence filter (pivot must stand out from surrounding price by at least 1 ATR)
Liquidity Sweep:
- Pivot lookback for sweep targets (default 100 bars)
- Min/max penetration in ATR (0.1 to 1.0 ... filters both noise and breakouts)
- Confirmation bars (default 3 ... price must hold for 3 bars after sweep)
RSI Divergence:
- Standard RSI settings (default 14)
- Lookback and minimum distance between pivot pairs
Extension:
- EMA length (default 50)
- Minimum ATR distance from EMA (default 3x)
- Pivot must be extreme within N bars (default 30)
HOW IT FITS THE FRAMEWORK
Hunters Reversal answers WHEN ... specifically, when is a move likely exhausted and ready to reverse?
Used alongside:
- Liquidity Hunter ... shows WHERE the key levels are (the targets being swept)
- Trend Hunter ... shows the broader trend context (is this a counter-trend reversal or a pullback entry?)
- RSI+StochRSI ... provides additional momentum confirmation
The strongest setups: a Hunters Reversal BIG signal at a Liquidity Hunter zone with Trend Hunter showing momentum divergence on the higher timeframe.
ALERTS
8 alertconditions covering all signal types:
- Bear/Bull Liquidity Sweep
- Bear/Bull RSI Divergence
- Bear/Bull Pivot Extension
- Bear/Bull BIG (cluster signal ... highest priority)
EOF
grep -c "..." /home/claude/tv_publish_hunters_reversal.txt && echo "EM DASHES" || echo "Clean" Indicateur

Indicateur

Indicateur

Indicateur

Indicateur

Aura RSP Matrix [Pineify] Pineify - Aura RSP Matrix - Relative Strength Phase Momentum
Aura RSP Matrix compares the chart symbol with a benchmark and classifies it into four relative-strength phases: Leading, Weakening, Lagging, and Improving. It shows whether relative performance is gaining or fading.
Key Features
Benchmark-relative RS Ratio and RS Momentum centered around 100.
Phase coloring for the oscillator, bars, markers, and dashboard.
Leading and Lagging labels fire only on the first bar of a new phase.
How It Works
The script requests the benchmark close on the timeframe, divides chart close by benchmark close, then normalizes the result with a WMA . This creates RS Ratio, where values above 100 show relative strength above its recent baseline.
RS Momentum compares RS Ratio with its own WMA baseline. Both series are smoothed with an EMA before phase detection. Smoothing reduces one-bar noise but adds lag.
How the Components Work Together
RS Ratio shows whether the symbol is strong or weak versus the benchmark. RS Momentum shows whether that position is improving or fading. Leading means both are above 100; Weakening means strength remains above 100 while momentum slips; Lagging means both are below 100; Improving means momentum turns up before RS Ratio confirms.
Trading Ideas and Insights
Use Leading as confluence for bullish setups, not as an automatic entry.
Watch Weakening after strong runs; it may show fading follow-through.
Use Improving to find names recovering against a benchmark.
Treat Lagging as a caution filter when stronger alternatives exist.
Signals are phase-change markers, not performance guarantees. In choppy markets the matrix can rotate around 100, and live bars may change until close.
Unique Aspects
Two-stage WMA normalization separates relative strength from relative momentum.
One four-state matrix keeps labels, bars, oscillator color, and dashboard status aligned.
The benchmark input supports market, sector, crypto pair, or cross-asset comparison.
How to Use
Add the indicator and choose a benchmark for your trading universe.
Read the phase from bar color, oscillator color, and dashboard.
Combine phases with price structure, volume, and higher-timeframe context.
Customization
Calculation Window (default: 20) - WMA normalization period. Higher is smoother; lower is faster.
Benchmark Ticker (default: SPX) - Relative strength comparison symbol.
Smoothing Factor (default: 3) - EMA smoothing after RS calculations.
Phase Colors and Toggles - Adjust colors, labels, and bar coloring.
Conclusion
Aura RSP Matrix is a relative strength context tool for rotation, watchlist filtering, and benchmark-relative trade selection. Use it with price action and risk controls, not as a standalone forecasting system. Indicateur

smart Stochastic Embedded RSI with HA, Supertrend & UT Bot Short Description
Advanced Stochastic + Embedded RSI with Heiken Ashi, Supertrend & UT Bot voting system for cleaner momentum detection and reduced fake signals. Designed for scalpers, intraday and swing traders.
Full Publish Description
SS PRO RSI is a smart momentum oscillator built to reduce noise and filter weak signals by combining multiple confirmations into a single streamlined indicator.
This indicator merges:
Smart Stochastic
Embedded Stochastic RSI
Heiken Ashi trend logic
Supertrend confirmation
UT Bot filtering
Momentum-based coloring
Buy/Sell trigger system
Instead of relying on a basic stochastic crossover alone, the script uses a voting system between multiple trend filters to improve signal quality and reduce fake reversals during choppy markets.
Features
✔ Embedded Stochastic RSI mode
✔ Heiken Ashi trend confirmation
✔ Supertrend filter integration
✔ UT Bot confirmation logic
✔ Bull/Bear momentum coloring
✔ Dynamic trigger color modes
✔ Oversold & Overbought zones
✔ Cleaner buy/sell signals
✔ Adjustable sensitivity settings
✔ Designed for low-noise trading
Best Usage
Intraday trading
Swing trading
Index options
Crypto
Forex
Trend continuation setups
Recommended Timeframes
1H → Balanced signals
4H → Strong low-noise confirmations
15m → Faster entries with moderate noise
Suggested Settings (Low Noise)
K Length: 14
K Smoothing: 5
D Length: 5
RSI Length: 21
Momentum Sensitivity: 1.5
Important
⚠️ Disclaimer
This indicator is intended for educational and informational purposes only and should not be considered financial advice. Trading involves risk, and no indicator can guarantee profits or eliminate losses.
The signals generated by this script are based on technical analysis logic, momentum behavior, and multiple confirmation filters including Heiken Ashi, Supertrend, and UT Bot voting systems. Market conditions can change rapidly, and false signals may still occur.
Always use proper risk management, confirm trades with your own analysis, and test strategies before using them in live markets.
The creator of this script is not responsible for any financial losses or trading decisions made using this indicator.
Indicateur
SHK CCI RSI StochRSI Fisher Blended Oscillator divergence╔══════════════════════════════════════════════════════════════╗
SHK Blended Oscillator
CCI + RSI + Stoch RSI + Fisher
╚══════════════════════════════════════════════════════════════╝
A professional-grade momentum oscillator that blends four powerful
indicators — CCI, RSI, Stochastic RSI, and Fisher Transform — into
one single weighted signal line. No clutter, no multiple panes.
Just one clean oscillator with maximum confluence.
━━━━━━━━━━━━━━━━━━━━━━━━━━━━━━━━━━━━━━━━
🔷 HOW IT WORKS
━━━━━━━━━━━━━━━━━━━━━━━━━━━━━━━━━━━━━━━━
Each indicator is normalized to the CCI scale (±100/±200) and
blended using user-defined weights. The result is a single line
that represents the combined momentum of all four indicators.
A signal MA line is plotted over the blended line for crossover
confirmation.
━━━━━━━━━━━━━━━━━━━━━━━━━━━━━━━━━━━━━━━━
📊 4 BLENDED INDICATORS
━━━━━━━━━━━━━━━━━━━━━━━━━━━━━━━━━━━━━━━━
① CCI — Commodity Channel Index (core base, always active)
② RSI — Relative Strength Index (normalized to CCI scale)
③ Stoch RSI — Stochastic RSI K line (normalized to CCI scale)
④ Fisher Transform — Price distribution oscillator (normalized)
Each indicator can be enabled/disabled independently.
Each has its own blend weight (0.1 to 3.0) to control influence.
━━━━━━━━━━━━━━━━━━━━━━━━━━━━━━━━━━━━━━━━
📐 11 SIGNAL MA TYPES
━━━━━━━━━━━━━━━━━━━━━━━━━━━━━━━━━━━━━━━━
Choose any of 11 moving average types for the signal line:
▸ SMA — Simple MA
Equal weight to all bars. Slowest. Best for clean baselines.
▸ EMA — Exponential MA
More weight on recent bars. Balanced lag. Best general purpose.
▸ WMA — Weighted MA
Linear weight to recent bars. Slightly faster than SMA.
▸ RMA — Wilder's Smoothed MA
Same smoothing method used inside RSI and ATR. Very smooth,
minimal noise. Best for swing trades.
▸ HMA — Hull MA
Fastest MA with least lag. Reactive to price changes.
Best for intraday Nifty/BankNifty options scalping.
▸ VWMA — Volume Weighted MA
Weights bars by volume. Gives more importance to high-volume
moves. Best for volume-heavy stocks like Reliance, TCS.
▸ SWMA — Symmetrically Weighted MA
Fixed 4-bar symmetric weighting. No length setting needed.
Smooth and balanced.
▸ DEMA — Double EMA
2×EMA − EMA(EMA). Reduces lag significantly compared to EMA.
Good for trend-following entries.
▸ TEMA — Triple EMA
3×E1 − 3×E2 + E3. Very fast, aggressive lag reduction.
Best for strong trending markets.
▸ LSMA — Least Squares MA (Linear Regression)
Fits a regression line to price. Excellent for identifying
clean trend direction. Best for daily/weekly charts.
▸ ALMA — Arnaud Legoux MA
Gaussian-weighted MA with customizable Offset and Sigma.
Low lag + low noise. Best for commodity options (Gold, Crude).
━━━━━━━━━━━━━━━━━━━━━━━━━━━━━━━━━━━━━━━━
🎯 SIGNAL SYSTEM
━━━━━━━━━━━━━━━━━━━━━━━━━━━━━━━━━━━━━━━━
▲ Bull Signal — appears when:
• Blended line is above signal MA (strength confirmed)
• AND any one of these fires:
- Blended crosses above zero
- RSI exits oversold zone
- StochRSI K exits oversold zone
- Fisher exits oversold level
▼ Bear Signal — appears when:
• Blended line is below signal MA (strength confirmed)
• AND any one of these fires:
- Blended crosses below zero
- RSI exits overbought zone
- StochRSI K exits overbought zone
- Fisher exits overbought level
Only ONE ▲ and ONE ▼ symbol per bar — no clutter.
━━━━━━━━━━━━━━━━━━━━━━━━━━━━━━━━━━━━━━━━
🔍 DIVERGENCE DETECTION
━━━━━━━━━━━━━━━━━━━━━━━━━━━━━━━━━━━━━━━━
✦ CCI Divergence — draws solid lines on the blended oscillator
• Bullish: price lower low + blended higher low → Lime line
• Bearish: price higher high + blended lower high → Red line
✦ RSI Divergence — draws dashed lines on RSI (normalized)
• Bullish divergence → Aqua dashed line
• Bearish divergence → Orange dashed line
✦ Labels auto-printed:
"CCI Bull Div" / "CCI Bear Div"
"RSI Bull Div" / "RSI Bear Div"
"CCI&RSI Bull Div" when both confirm together
━━━━━━━━━━━━━━━━━━━━━━━━━━━━━━━━━━━━━━━━
🎨 VISUAL FEATURES
━━━━━━━━━━━━━━━━━━━━━━━━━━━━━━━━━━━━━━━━
• Strength Histogram — color-coded background bars behind the line
• Blended Line Color:
Bright Lime = above zero + above MA (strong bull)
Faded Lime = below zero but above MA (weak bull)
Bright Red = below zero + below MA (strong bear)
Faded Red = above zero but below MA (weak bear)
• Signal MA Color:
Green = Heikin Ashi bullish candle
Red = Heikin Ashi bearish candle
• Extreme Zone BG Highlight:
Green background = blended above +100 and above MA
Red background = blended below -100 and below MA
• Horizontal Levels: ±200 (OB/OS), ±100, Zero line
• Blue filled zone between +100 and -100 (normal range)
━━━━━━━━━━━━━━━━━━━━━━━━━━━━━━━━━━━━━━━━
🔔 30+ ALERT CONDITIONS
━━━━━━━━━━━━━━━━━━━━━━━━━━━━━━━━━━━━━━━━
Blended Alerts:
• Strong Bullish / Strong Bearish
• Zero line cross up / down
• Above +100 / Below -100
• Hit Overbought / Oversold
• Exit Overbought / Exit Oversold
RSI Alerts:
• RSI above OB / below OS
• RSI cross above/below 50
StochRSI Alerts:
• K cross above oversold / below overbought
• K cross above / below D
Fisher Alerts:
• Fisher cross above/below oversold/overbought
• Fisher cross above/below zero
Combined:
• Any Bull Signal fired
• Any Bear Signal fired
Heikin Ashi:
• HA turned Bullish / Bearish
Divergence:
• CCI Bull/Bear Div
• RSI Bull/Bear Div
• CCI & RSI both confirmed
━━━━━━━━━━━━━━━━━━━━━━━━━━━━━━━━━━━━━━━━
⚙️ SETTINGS GROUPS
━━━━━━━━━━━━━━━━━━━━━━━━━━━━━━━━━━━━━━━━
• CCI Settings — length, source, MA type, MA length, ALMA params
• Levels — OB/OS and ±100 levels fully adjustable
• RSI Settings — length, source, OB/OS, blend weight
• StochRSI Settings — RSI len, Stoch len, K/D smooth, OB/OS, weight
• Fisher Settings — length, OB/OS levels, blend weight
• Features — toggle divergences, histogram, signals, extremes
• Divergence — lookback bars and threshold sensitivity
━━━━━━━━━━━━━━━━━━━━━━━━━━━━━━━━━━━━━━━━
🇮🇳 BEST FOR INDIAN MARKETS
━━━━━━━━━━━━━━━━━━━━━━━━━━━━━━━━━━━━━━━━
✔ Nifty 50 / BankNifty intraday options (HMA or TEMA)
✔ Sensex daily swing trades (ALMA or RMA)
✔ MCX Gold / Crude Oil options (ALMA or LSMA)
✔ NSE large-cap stocks (VWMA)
✔ All timeframes — 1m to Monthly
━━━━━━━━━━━━━━━━━━━━━━━━━━━━━━━━━━━━━━━━
⚠️ DISCLAIMER
━━━━━━━━━━━━━━━━━━━━━━━━━━━━━━━━━━━━━━━━
━━━━━━━━━━━━━━━━━━━━━━━━━━━━━━━━━━━━━━━━
⚠️ IMPORTANT DISCLAIMER — READ BEFORE USE
━━━━━━━━━━━━━━━━━━━━━━━━━━━━━━━━━━━━━━━━
FOR EDUCATIONAL PURPOSES ONLY
This indicator is not financial advice, investment advice, or
a recommendation to buy or sell any financial instrument.
All signals, alerts, and visual outputs are informational only.
NO GUARANTEE OF ACCURACY
Technical indicators are mathematical calculations based on
historical price data. They are lagging by nature and cannot
predict future price movements. Signals may be false, delayed,
or unreliable during high volatility, news events, or low
liquidity conditions.
RISK OF LOSS
Trading financial markets involves substantial risk. Options
and derivatives carry even higher risk due to leverage — you
can lose your entire invested capital. Never trade with money
you cannot afford to lose.
YOUR RESPONSIBILITY
• You are solely responsible for all your trading decisions.
• Never use this as your only reason to enter or exit a trade.
• Always apply stop-loss, proper position sizing, and risk
management on every single trade.
• Consult a SEBI-registered advisor before making significant
financial decisions.
• The author accepts NO liability for any losses incurred
from the use or misuse of this indicator.
INDIA MARKET NOTE
NSE, BSE, and MCX markets are subject to SEBI regulations,
RBI policy decisions, Budget announcements, and circuit
breakers — all of which can cause sudden moves that no
indicator can anticipate. Always check news calendars.
Past performance shown on historical charts does NOT
guarantee future results under any circumstances.
─────────────────────────────────────────
© SHK — All rights reserved.
Unauthorized copying or resale of this script is strictly
prohibited under TradingView House Rules.
───────────────────────────────────────── Indicateur

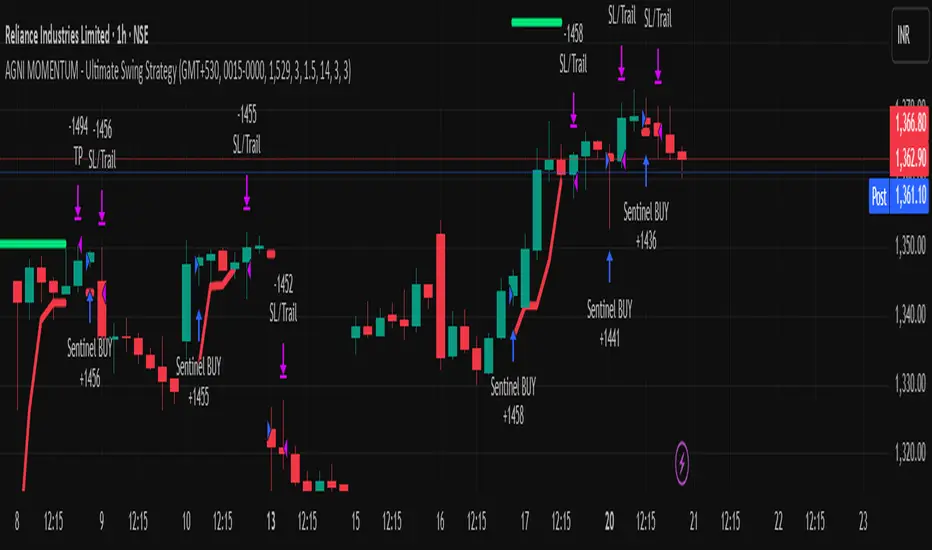
AGNI MOMENTUM - Ultimate Swing StrategyThe AGNI MOMENTUM is a high-performance swing trading system developed by The Stock Yogi. Designed specifically for the 1-Hour, 4-Hour, and Daily timeframes, this strategy is built to identify and ride major market waves while maintaining professional-grade risk controls.
Why "AGNI" Momentum?
In the Indian markets, catching a trend at the right moment is like capturing fire. This strategy uses a triple-layered approach to ensure you only enter when the "spark" is confirmed and the trend has the fuel to continue.
Technical Pillars:
The Institutional Anchor (VWAP): We only look for Long opportunities when the price is trading above the Volume Weighted Average Price, ensuring we are on the side of institutional money.
The Momentum Trigger (Stochastic RSI): A precision-tuned oscillator that identifies overextended markets and triggers entries exactly as momentum shifts in our favor.
The Volatility Shield (ATR): Instead of fixed-point stops, we use Average True Range. This allows your stop loss to adjust automatically based on market "Garam-Hawa" (volatility), preventing unnecessary stop-outs.
The Trailing Sentinel: A built-in trailing stop follows the price, protecting your "Kamai" (earnings) as the trade progresses.
Key Features:
Optimized for Indian Markets: Defaulted to IST (GMT+5:30) with customizable session windows.
Aggressive Reward: Set to a default 1:3 Risk-to-Reward ratio to ensure long-term profitability.
Clean Visuals: Thick Target/SL lines and "AGNI Stickers" ($) make the trade status clear at a glance.
Toggle Flexibility: Easily switch off Sell trades to focus on a "Buy Only" trending market.
How to Use:
Preferred Timeframes: 1H, 4H for aggressive swings, 1D for structural wealth building.
Assets: Optimized for Nifty, BankNifty, and high-volume Blue-chip stocks. Stratégie

Indicateur
Stratégie

EagleEye-DashboardIndicator Description & Disclaimer
This indicator has been developed independently for educational and personal learning purposes, based on hands-on trading experience and continuous research into multi-timeframe analysis.
What this indicator does:
This tool consolidates three of the most widely used technical indicators — MACD, RSI, and Stochastic Oscillator — into a single, clean dashboard view. Rather than switching between multiple charts and timeframes manually, traders can now see the status and alignment of all three indicators across multiple timeframes (MTF) at a single glance. This helps in quickly identifying trend confluence, momentum shifts, and potential entry/exit zones without cluttering your chart.
Key features:
Multi-Timeframe (MTF) dashboard view in one unified panel
Real-time status display for MACD, RSI, and Stochastic
Designed for clarity, speed, and ease of interpretation
Suitable for indices, equities, forex, and crypto markets
Disclaimer:
This indicator is strictly developed for learning and informational purposes only. It does not constitute financial advice, investment recommendation, or a solicitation to buy or sell any financial instrument. Past performance of any signal generated by this indicator does not guarantee future results. Trading in financial markets involves substantial risk, and you may lose more than your initial investment. Always conduct your own due diligence, apply proper risk management, and consult a certified financial advisor before making any trading decisions.
The author holds no responsibility for any trading losses incurred through the use of this indicator. Use at your own risk.
Future Roadmap:
This indicator is actively being refined. Upcoming versions will aim to improve signal accuracy, add additional confirmation layers, and expand timeframe flexibility based on user feedback and ongoing research.
Developed with passion for the trading community.
Regards,
Ramesh Vaishya
Independent Trader & Indicator Developer Indicateur

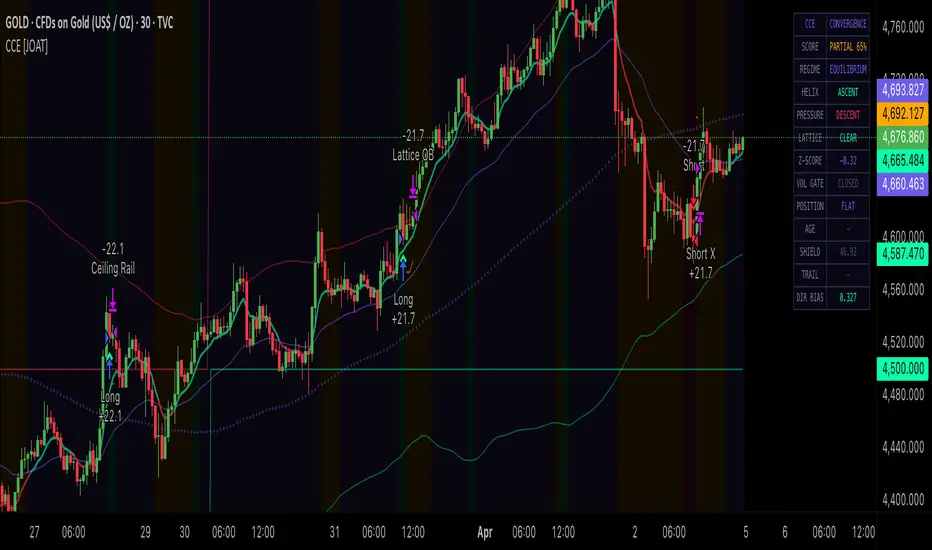
Crucible Convergence Engine [JOAT]Crucible Convergence Engine
Introduction
The Crucible Convergence Engine is an open-source multi-module convergence strategy that requires alignment across five independent analytical engines before entering a trade. It fuses a Regime Arbiter (market state classification), Directional Helix (trend direction), Pressure Reactor (volume-weighted momentum), Deviation Lattice (statistical band filter), and Fortress Grid (dynamic S/R levels) into a unified convergence scoring system. Entries only fire when all required modules agree — regime confirms a trending state, trend direction aligns, momentum confirms, price is not at a statistical extreme, and volume exceeds its gate threshold. Exits are managed through ATR-based stops and targets, an optional trailing shield, regime flip detection, lattice extreme reversal, and rail interaction exits.
This strategy exists because most trading systems rely on one or two confirmation layers. A moving average crossover with an RSI filter, for example, still enters trades in ranging markets, against macro trends, or at statistical extremes. CCE addresses this by requiring convergence across five fundamentally different analytical dimensions before committing capital. The trade-off is fewer trades — but each trade has multi-dimensional confirmation behind it.
Module Architecture
Module 1: Regime Arbiter
The Regime Arbiter classifies the market into four states using ATR percentile ranking, custom directional movement scoring, and EMA trend alignment:
Kinetic Ascent: ATR percentile above the kinetic threshold, positive directional bias, fast EMA above slow EMA
Kinetic Descent: Same volatility conditions but with negative directional bias
Turbulence: ATR percentile above the turbulence threshold — high volatility without clear direction
Equilibrium: Low volatility, no strong directional bias — ranging market
A two-bar confirmation filter prevents single-bar regime flicker. When the Regime Gate is active (default), the strategy only enters trades during Kinetic Ascent or Kinetic Descent — it sits out during Turbulence and Equilibrium, avoiding the choppy conditions that destroy most trend-following systems.
Module 2: Directional Helix
A fast and slow moving average (EMA or SMA, configurable) determine trend direction. The strategy requires the helix to agree with the regime — a long entry needs both the regime in Kinetic Ascent AND the fast MA above the slow MA.
Module 3: Pressure Reactor
Volume-weighted momentum is calculated using the same logarithmic volume impact function found in the Ferrum Pressure Gauge indicator:
float vwM = pChg * math.log(1 + vR * momVolSens)
float mF = ta.ema(vwM, momFast)
float mS = ta.ema(vwM, momSlow)
float mIdx = ta.ema(mF - mS, 5)
The Pressure Reactor must confirm the trade direction — bullish momentum for longs, bearish momentum for shorts. This ensures that volume-weighted price action supports the entry, not just trend direction.
Module 4: Deviation Lattice
A statistical band system (mean +/- standard deviation * multiplier) acts as an extreme filter. The strategy will NOT enter a long if price is already at or above the upper band (overbought), and will NOT enter a short if price is at or below the lower band (oversold). This prevents chasing extended moves that are statistically likely to revert.
Module 5: Volume Gate
A simple but effective filter requiring short-term volume to exceed a configurable multiple of average volume (default 1.1x). This ensures entries occur during periods of meaningful market participation, not during thin, unreliable conditions.
Convergence Scoring
Each module contributes a weighted score to the overall convergence percentage:
Regime Arbiter: 25 points (trending state confirmed)
Directional Helix: 25 points (trend direction aligned)
Pressure Reactor: 25 points (momentum confirmed)
Deviation Lattice: 15 points (not at statistical extreme)
Volume Gate: 10 points (sufficient market participation)
The convergence score is classified as FULL LOCK (90%+), STRONG (70%+), PARTIAL (50%+), or WEAK (below 50%). The dashboard displays this score in real-time so you can see how close the market is to triggering an entry even before it fires.
Entry conditions require ALL modules to align simultaneously. Entries are edge-triggered — they fire only on the transition from non-convergent to convergent, preventing re-entry on the same signal.
Risk Architecture
ATR Shield (Stop Loss): Initial stop placed at entry price minus ATR * Shield Multiple (default 2.0x ATR). This adapts stop distance to current volatility.
ATR Objective (Take Profit): Target placed at entry price plus ATR * Objective Multiple (default 3.0x ATR). The default 1:1.5 risk-reward ratio (2.0 stop vs 3.0 target) provides positive expectancy even with moderate win rates.
Trailing Shield: When enabled, an ATR-based trailing stop ratchets in the direction of the trade. For longs, the trail is set at close minus ATR * Trail Multiple, and it only moves up, never down. This locks in profits during extended moves.
Regime Flip Exit: If the Regime Arbiter flips to the opposite state (e.g., from Kinetic Ascent to Kinetic Descent while in a long), the position is closed immediately. This is a structural exit — the market environment that justified the entry no longer exists.
Lattice Extreme Exit: If price reaches the opposite statistical extreme (upper band for longs, lower band for shorts), the position is closed. This captures profits at statistically extended levels.
Rail Interaction Exit: If price enters the proximity zone of the opposing Fortress Grid rail (ceiling for longs, floor for shorts), the position is closed. This respects dynamic support/resistance levels.
Strategy Default Properties
These are the default settings used in the strategy's Properties dialog:
Initial Capital: TradingView default
Order Size: 10% of equity per trade (percent_of_equity)
Pyramiding: 0 (no stacking — one position at a time)
Commission: Not set by default — users should configure realistic commission for their instrument
Slippage: Not set by default — users should add realistic slippage for their instrument
Margin: margin_long=0, margin_short=0 (v5-equivalent behavior)
Calc on Every Tick: false (confirmed bars only)
Process Orders on Close: true
Important: Users should set realistic commission AND slippage values in the strategy Properties before evaluating backtest results. The default results without commission/slippage will overstate performance. A commission of 0.04-0.1% per side and 1-3 ticks of slippage is reasonable for most liquid instruments.
Command Panel (Dashboard)
A 13-row monospace dashboard displays the complete strategy state:
SCORE: Convergence classification with percentage (FULL LOCK / STRONG / PARTIAL / WEAK)
REGIME: Current market state (Kinetic Ascent, Kinetic Descent, Turbulence, Equilibrium)
HELIX: Trend direction (Ascent / Descent)
PRESSURE: Momentum direction (Ascent / Descent)
LATTICE: Band filter state (Clear / Ceiling Hit / Floor Hit)
Z-SCORE: Current statistical deviation from mean
VOL GATE: Volume gate status with current ratio (Open / Closed)
POSITION: Current trade status (Long / Short / Flat)
AGE: Bars since entry
SHIELD: Current ATR-based stop distance
TRAIL: Current trailing stop price (if active)
DIR BIAS: Raw directional movement bias score
Input Parameters
Regime Arbiter:
Dispersion Epoch / Rank Horizon / Kinetic Threshold / Turbulence Threshold / Regime Gate Active
Directional Helix:
Lead Filament / Anchor Filament / Filament Type (EMA or SMA)
Pressure Reactor:
Ignition Cycle / Sustain Cycle / Flux Epoch / Flux Amplifier
Deviation Lattice:
Lattice Depth / Sigma Aperture / Lattice Extreme Exit toggle
Fortress Grid:
Grid Anchor / Grid Increment / Proximity Radius / Rail Interaction Exit toggle
Risk Architecture:
Shield Multiple (stop) / Objective Multiple (target) / Risk Epoch (ATR period) / Trailing Shield toggle / Trail Multiple
Volume Gate:
Require Volume Confirmation / Volume Gate Threshold
How to Use This Strategy
Start by setting realistic commission and slippage in the strategy Properties before evaluating any backtest results.
Adjust the Grid Increment in the Fortress Grid module to match your instrument (500-1000 for BTC, 50-100 for stocks, etc.).
Monitor the Convergence Score in the dashboard — it shows how close the market is to triggering an entry. STRONG readings (70%+) that haven't yet reached FULL LOCK often precede entries by a few bars.
The Regime Gate is the most impactful filter. Disabling it will produce more trades but in lower-quality market conditions. Keep it enabled unless you have a specific reason to trade ranging/volatile markets.
Experiment with the Shield and Objective multiples to find the risk-reward ratio that matches your trading style. Higher Objective multiples produce fewer but larger winners; lower multiples produce more frequent but smaller wins.
The Trailing Shield is most valuable in trending markets where moves extend beyond the initial target. In choppy markets, it may give back profits. Consider disabling it if the instrument tends to mean-revert quickly.
Limitations and Honest Assessment
Multi-module convergence produces fewer trades. On some instruments and timeframes, the strategy may go extended periods without a signal. This is by design — it prioritizes quality over quantity.
Backtest results are hypothetical and do not account for real-world execution challenges including partial fills, requotes, and market impact.
The strategy uses process_orders_on_close=true, which means orders execute at the close of the signal bar. In live trading, you would need to enter at the open of the next bar, which introduces slippage.
Past performance shown in backtests does not guarantee future results. Market conditions change, and strategies that worked historically may underperform in different regimes.
The default settings are not optimized for any specific instrument or timeframe. Users should test across multiple datasets and adjust parameters to their specific use case.
The Regime Arbiter and all other modules use lagging indicators. Entries will always occur after a trend has begun, not at the exact bottom or top.
No strategy works in all market conditions. CCE is designed for trending markets and will underperform during extended ranging or highly volatile periods.
Originality Statement
This strategy is original in its five-module convergence architecture. While individual components (ATR regime classification, MA crossovers, volume-weighted momentum, statistical bands, EMA-derived levels) are established concepts, CCE is justified because:
The five-module convergence scoring system requires alignment across fundamentally different analytical dimensions (volatility regime, trend, momentum, statistics, structure) before entering — a more rigorous entry filter than typical dual-confirmation systems.
The weighted convergence score provides a quantified readiness metric that communicates how close the market is to a valid entry, even when not all conditions are met.
Four distinct exit mechanisms (ATR stop/target, trailing shield, regime flip, lattice extreme, rail interaction) provide layered risk management that adapts to different exit scenarios.
The Regime Arbiter gate prevents trading during Turbulence and Equilibrium states, addressing the primary failure mode of trend-following strategies.
Edge-triggered entries with two-bar regime confirmation prevent re-entry on the same signal and eliminate single-bar flicker.
The comprehensive 13-row dashboard provides full transparency into every module's state, the convergence score, and the current risk parameters.
Disclaimer
This strategy is provided for educational and informational purposes only. It is not financial advice or a recommendation to buy or sell any financial instrument. Trading involves substantial risk of loss and is not suitable for all investors. Backtest results are hypothetical, do not represent actual trading, and do not guarantee future performance. Past results in no way guarantee future results. Commission, slippage, and other real-world costs will reduce actual performance below what backtests show. Always use proper risk management, including position sizing appropriate for your account and risk tolerance. Never risk more than you can afford to lose. The author is not responsible for any losses incurred from using this strategy.
-Made with passion by officialjackofalltrades
Stratégie