Liquidity Map & Order Blocks [MQLSoftware]Liquidity Map & Order Blocks reads swing structure into a density map of where stop-liquidity rests, then projects which pool price is most likely drawn toward next. Equal highs and lows are grouped into bands whose brightness scales with a multi-factor Liquidity Score, sweeps mark where those pools were hunted, and a forward-looking model expresses the most likely draw as a self-calibrating historical hit-rate rather than a fixed number. A compact right-side panel adds chart and higher-timeframe structure, the net liquidity pull, the draw target, and pool counts.
This is a visual analytical tool intended for chart reading and liquidity mapping. It does not execute trades and does not provide financial advice. It does not generate buy or sell signals and makes no claim about profitability or win rate. The draw percentage describes how often similar pools were reached in the past over the loaded data; it is a descriptive statistic, not a prediction, and past behavior does not guarantee future results.
Key Features
Resting liquidity drawn as density bands from ATR-normalized clustering of equal highs and lows, so nearby levels merge into one pool instead of a stack of lines
Band brightness driven by a Liquidity Score that blends a saturating touch count, age decay, relative volume at the forming pivots, and rejection-wick depth
Draw on Liquidity projection: a directional arrow to the pool with the strongest modelled pull, muted automatically when the model's confidence is low
Draw percentage shown as a self-calibrating empirical hit-rate — how often pools of a similar profile were actually reached over the loaded history, marked provisional while the sample is thin
Sweep detection when price wicks beyond the last significant swing and closes back within it, with recent sweeps labelled and older ones marked compactly
Protected-swing structure engine marking Break of Structure and Change of Character, with an optional plain-language label mode
Order blocks drawn only when they originate a Break of Structure, plus an optional Fair Value Gap layer; both fade once mitigated
Multi-timeframe panel with chart and higher-timeframe bias, liquidity pull, draw target with its hit-rate, and pool counts, read non-repainting
Core Concept
Most liquidity and order-block tools on TradingView take one of two approaches. They either draw raw equal-high / equal-low lines and mark every order block and gap without ranking them, which clutters the chart and leaves the reader to judge which level matters, or they label structure (swings, breaks of structure) without projecting where liquidity is likely to pull price next. Both stop short of a scored, forward-looking read.
This indicator builds on a different base: cluster swing levels into scored density bands, gate order blocks by structure, and add a model for the next likely draw that is calibrated against realized history. It adds three specific algorithmic elements on top of that base.
1. ATR-Normalized Liquidity Clustering with a Multi-Factor Score. Swing highs and lows are not drawn as individual lines. They are grouped along the price axis by a clustering pass whose merge distance scales with ATR, so equal-ish levels collapse into a single pool and the behavior stays consistent across instruments. Each pool carries a Liquidity Score built multiplicatively from a saturating touch count, an age-decay term, relative volume at the forming pivots, and rejection-wick depth, so a band's brightness reflects how heavy and how fresh the resting liquidity is rather than only how many times the level was touched.
2. Draw on Liquidity Projection. Each unmitigated pool is treated as an attractor. Its pull is the product of its Liquidity Score, an exponential proximity kernel in ATR units, a structural prior that favors pools lying in the trend's continuation direction relative to current price, and a path-clearance term that discounts a pool when other strong pools sit between it and price. The strongest-pull pool is projected as the draw target, and the projection is deliberately muted when confidence is low, so a weak draw never reads like a strong one.
3. Self-Calibrating Empirical Hit-Rate. The draw percentage is not a fixed weight. Each draw is profiled into a bucket defined by Liquidity Score, distance, and structural alignment, and as the chart's history is processed the script records how often pools of that profile were actually reached within a configurable horizon. The displayed figure is the empirical reach frequency of that bucket, smoothed with a weak prior so thin samples are shown as provisional rather than over-read. It calibrates per symbol and timeframe with no fixed accuracy claim attached.
Anatomy of the Display
Liquidity bands are the horizontal zones spanning each pool, colored for buy-side (above) and sell-side (below) liquidity; the brighter a band, the higher its Liquidity Score. Swept pools dim to grey so a hunted level is visually retired.
The draw projection is the arrow from current price to the strongest-pull pool, with a price-side chip and an arrowhead pointing the modelled direction. Its weight scales with the hit-rate: a high-confidence draw is bold, a low-confidence one is thin and faded. The label reads the target level, the hit-rate (shown as a provisional `~NN% (n…)` while its sample is small), and whether the pool is buy-side or sell-side liquidity.
Sweeps mark a stop-hunt of the last significant swing: a wick beyond it that closes back within. The two most recent are labelled; older ones are compact marks so the chart stays clean.
Structure is drawn as Break of Structure and Change of Character lines from a protected-swing state machine; a toggle renders these in plain language (Trend break / Reversal) for readers new to the terminology.
Order blocks are the boxes drawn at the last opposite candle before a Break of Structure, so only structure-originating blocks appear; the optional Fair Value Gap layer marks three-candle imbalances aligned with the break. Both fade once price mitigates them.
The right-side panel lists chart structure, the net liquidity pull and its strength, the draw target with its hit-rate, pool counts per side, and a per-row higher-timeframe bias scan with a strength bar.
Multi-Timeframe Panel
The panel reads three higher timeframes of your choice for structural bias and trend strength, using the same protected-swing engine as the chart. Higher-timeframe values are read with `lookahead=barmerge.lookahead_off` and a one-bar offset, which is the standard non-repainting pattern for higher-timeframe context. A divergence between the chart's structure row and the liquidity pull is informative rather than contradictory: structure up while the draw points down with a high hit-rate, for example, frames an expected pullback toward a strong pool below.
Notes on Repainting
Confirmed liquidity pools, sweeps, structure breaks, and order blocks do not repaint. They are built from confirmed pivots (`ta.pivothigh` and `ta.pivotlow` with a right-bars parameter), so once committed they stay anchored.
Pivot detection has an inherent delay equal to the right-bars parameter (default 3 bars). The most recent swing is provisional until that many bars close past it. This is a property of all pivot-based indicators, not specific to this script.
The draw percentage is a learning statistic. It updates as the script accumulates observations over the loaded history. This is not a repaint of historical bars; the same bar can show a different figure when the chart is reloaded with a different amount of history, because more or fewer observations are available.
Mitigation is one-directional. Once an order block or gap is mitigated it stays marked as such.
Multi-timeframe panel data uses `lookahead=barmerge.lookahead_off` with a one-bar offset, the canonical non-repainting pattern for higher-timeframe context.
Alerts are gated by `barstate.isconfirmed` and fire once per closed bar, never intra-bar.
Typical Analysis Workflow
A common analytical workflow may include:
Reading the band map to see where the heaviest resting liquidity sits above and below price, with brighter bands as the higher-quality pools
Reading the draw projection as a hypothesis for where liquidity may pull price next, weighting it by its hit-rate and whether it aligns with structure
Noting sweeps as stop-hunts that often precede a move, and watching whether price reclaims or rejects the swept level
Treating order blocks as origin zones for the move that broke structure, and the panel's higher-timeframe rows as top-down context
Reading a structure-versus-pull divergence as a possible pullback rather than a contradiction, then managing any decision with other forms of analysis and risk management
Configuration
Structure Engine - ATR length, pivot left / right bars, and the swing filter that sets how significant a swing must be. Right Bars also sets the confirmation delay.
Liquidity Pools - lookback, cluster epsilon (how aggressively levels merge), minimum touches, age half-life, and whether volume contributes to the score.
Draw on Liquidity - proximity, structural prior strength, path clearance, the empirical-calibration toggle, and the calibration horizon.
Sweeps & Structure - sweep penetration, show sweeps, show structure, and the plain-language label toggle.
Order Blocks / FVG - show order blocks, show gaps, the order-block scan window, and the maximum number of boxes.
Visuals - colors for buy-side and sell-side liquidity, draw target, and structure, plus a minimum band height so pools read as bands rather than threads.
Multi-Timeframe HUD - show / hide the panel, the three higher timeframes, and panel position.
Markets and Timeframes
The indicator can be applied across multiple markets and timeframes:
Cryptocurrencies
Forex
Stocks and Indices
Commodities
Because the clustering distance, proximity kernel, and score are all ATR-based, the visual behavior stays consistent across instruments and timeframes. The volume component of the Liquidity Score contributes most on instruments with reliable volume (crypto, futures, equities) and falls back gracefully where volume is thin. The empirical hit-rate reads best on charts with enough history for its buckets to fill.
Alerts
Buy-side liquidity swept - fires when a buy-side pool's level is hunted
Sell-side liquidity swept - fires when a sell-side pool's level is hunted
Bullish Break of Structure - fires on a confirmed upside structure break
Bearish Break of Structure - fires on a confirmed downside structure break
All timeframes bullish - fires when every higher-timeframe row is bullish
All timeframes bearish - fires when every higher-timeframe row is bearish
All alerts evaluate on confirmed bars to avoid intra-bar oscillation. Indicateur

FVG Imbalance Tracker TGFXFVG Imbalance Tracker
OVERVIEW
FVG Imbalance Tracker automatically detects, draws and tracks Fair Value Gaps (FVG), also known as imbalances. It marks each gap as a zone, extends it until price returns, and tells you when the gap has been mitigated (filled). An optional 50% midline (Consequent Encroachment / CE) and a higher-timeframe table give you context at a glance.
WHAT IS A FAIR VALUE GAP
A Fair Value Gap is a three-candle pattern where the first and third candles do not overlap, leaving a price range that was crossed in a single, one-sided move:
- Bullish FVG: the low of candle 3 is above the high of candle 1.
- Bearish FVG: the high of candle 3 is below the low of candle 1.
That untraded range is an imbalance. Price frequently returns to it later to "rebalance" before continuing, which is why these zones are useful as potential reaction areas.
HOW IT WORKS
1. On the close of every third candle, the script checks for a gap between candle 1 and candle 3.
2. If a gap is found (and passes the optional ATR size filter), a zone is drawn from the pattern to the right.
3. Each zone keeps extending until it is mitigated. You choose what mitigation means:
- Full fill: price fully closes the gap.
- 50% (CE): price reaches the midpoint (Consequent Encroachment).
- Touch: price reaches the near edge of the gap.
4. Once mitigated, the zone is dimmed and stops extending (or is removed, if you prefer).
HOW TO READ IT
- Green zones = bullish Fair Value Gaps (potential demand / support areas).
- Red zones = bearish Fair Value Gaps (potential supply / resistance areas).
- Solid, extending zone = still unmitigated.
- Dimmed zone = already mitigated.
- Dotted midline = the 50% (CE) level of the gap.
- Multi-timeframe table: shows the latest imbalance direction on three higher timeframes (Bull / Bear / –) for higher-timeframe context.
SETTINGS
- Detection: optional ATR filter to ignore small gaps, ATR length, minimum gap size (× ATR), and maximum gaps kept per side.
- Mitigation: choose Full fill, 50% (CE) or Touch, and whether mitigated gaps stay dimmed or are removed.
- Visual: colors for bullish/bearish gaps, box transparency, optional border, optional 50% midline, optional labels, label size.
- Multi-timeframe table: enable/disable, the three timeframes, and table position.
REPAINTING
Gaps are confirmed on the close of the third candle, so a zone does not appear and then disappear intrabar.
ALERTS
Three alerts are available: "New bullish FVG", "New bearish FVG" and "FVG mitigated". Add them from the alert dialog and set them to trigger once per bar close.
NOTES
This script is an original implementation of standard, public price-action concepts (Fair Value Gaps and Consequent Encroachment). It is a visualization and context tool — it does not generate buy/sell signals and makes no claim about future performance. Fair Value Gaps work best combined with your own analysis (market structure, liquidity, higher-timeframe context, risk management) rather than used in isolation. Indicateur

Liquidity Sweeps EQH EQL TGFXLiquidity Sweeps — EQH / EQL
OVERVIEW
Liquidity Sweeps — EQH / EQL is a price-action tool that highlights resting liquidity on the chart and shows when that liquidity is taken. It automatically detects clusters of equal swing highs (EQH) and equal swing lows (EQL), draws them as liquidity levels, and flags the moment price runs through a level and closes back on the other side — a liquidity sweep (also called a stop run or liquidity grab).
THE IDEA BEHIND IT
Stop orders tend to build up just beyond obvious swing highs and lows. When several swings form at roughly the same price, they create a visible pool of resting orders:
- Equal highs (EQH) sit above price and represent buy-side liquidity (buy stops / breakout buy orders).
- Equal lows (EQL) sit below price and represent sell-side liquidity (sell stops / breakout sell orders).
Price is often drawn toward these pools. A sweep occurs when price spikes through the level to trigger those orders and then closes back inside the range — frequently a sign that the move beyond the level lacked follow-through.
HOW IT WORKS
1. Swings are detected with confirmed Williams pivots (configurable left/right length).
2. When two consecutive pivot highs (or lows) form within an adaptive, ATR-based tolerance, they are treated as "equal" and a liquidity level is drawn at the extreme. The tolerance can also be set as a fixed tick distance.
3. Each level extends to the right until price reaches it.
4. A sweep is confirmed on bar close:
- Bearish sweep: a bar's high trades above an EQH but the bar closes back below it (buy-side liquidity taken).
- Bullish sweep: a bar's low trades below an EQL but the bar closes back above it (sell-side liquidity taken).
The swept level is then dimmed and stops extending, and a "SWEEP" label is placed.
HOW TO READ IT
- Red levels / "EQH" labels = buy-side liquidity resting above price.
- Green levels / "EQL" labels = sell-side liquidity resting below price.
- Solid line = level still intact (liquidity untouched).
- Dotted/dimmed line = level already swept.
- Red "SWEEP" above a candle = buy-side liquidity taken and rejected.
- Green "SWEEP" below a candle = sell-side liquidity taken and reclaimed.
- Multi-timeframe table: shows the most recent sweep direction on three higher timeframes (Bull / Bear / –) for higher-timeframe context at a glance. On each higher timeframe a sweep is measured as breaking the N-bar high/low and closing back inside.
SETTINGS
- Swing detection: pivot left/right bars control how large a swing must be before it counts. Lower = more, smaller swings (more sensitive); higher = fewer, more significant ones.
- Equal levels: tolerance mode (ATR or ticks), ATR length and multiplier, and a tick tolerance. A larger tolerance treats more pivots as "equal".
- Sweeps: show/hide sweep labels, and whether swept levels stay on the chart (dimmed) or are removed.
- Visual: colors for buy-side/sell-side, line width, label size, show/hide level labels.
- Multi-timeframe table: enable/disable, the three timeframes, the higher-timeframe sweep lookback, and the table position.
REPAINTING
Levels are built only from pivots that are already confirmed, so a level never appears and then disappears once drawn (by definition, a pivot is confirmed a number of bars after it forms, equal to the "right bars" setting). Sweeps are evaluated on bar close, so sweep labels and alerts do not change intrabar.
ALERTS
Two alerts are available: "Bullish liquidity sweep" and "Bearish liquidity sweep". Add them from the alert dialog and set them to trigger once per bar close.
NOTES
This script is an original implementation of standard, public price-action concepts (Williams pivots, equal highs/lows, liquidity sweeps). It is a visualization and context tool — it does not generate buy/sell signals and makes no claim about future performance. Sweeps are best combined with your own analysis (market structure, higher-timeframe context, risk management) rather than used in isolation. Indicateur

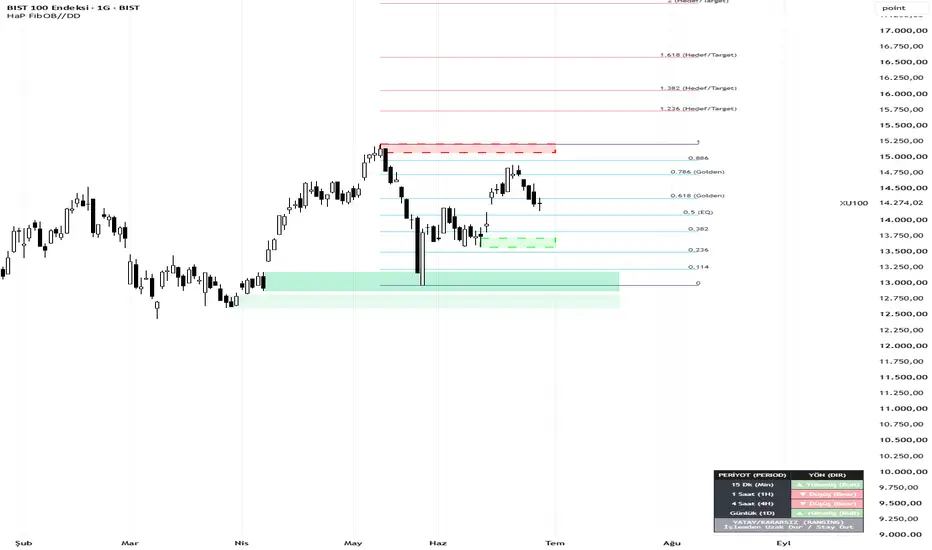
HaP Adaptive SuperFibo MTFWhat is the HaP Adaptive SuperFibo MTF?
The biggest weakness of the traditional SuperTrend indicator is the false signals it generates in ranging markets. To solve this, the HaP Adaptive SuperFibo MTF uses a dynamic algorithm that self-adjusts based on market volatility by combining ADX (Average Directional Index) and Dual ATR (Average True Range). Furthermore, it plots noise-filtered automated Fibonacci levels based on SuperTrend swings and displays the macro trend direction using a Multi-Timeframe (MTF) Dashboard.
How Does It Work Under the Hood? (Technical Core)
1. Smart SuperTrend Multiplier:
Instead of a standard fixed multiplier, the indicator calculates the volatility ratio between a Short ATR (10) and a Long ATR (50). Then, ADX (14) steps in to measure trend strength:
If ADX < 20 (Ranging Market): The indicator increases the calculated multiplier by 30% (widens the band) to avoid false breakouts and whipsaws.
If ADX > 25 (Trending Market): The indicator tightens the multiplier by 15% to trail the trend more closely and protect profits.
Users can turn off "Smart Mode" and use a fixed multiplier if desired.
2. Noise-Filtered Auto Fibonacci:
The script draws Fibonacci levels using SuperTrend reversal points (zigzag logic). What makes it unique is the ATR Filter. To ignore minor price fluctuations, it looks for the user-defined "Min Wave Length (ATR Multiplier)" condition. It anchors the Fibonacci only between the first valid strong swing points that meet this ATR condition. Users can choose between "Short Term" or "Long Term" (Weekly data-based) drawing modes.
3. MTF Dashboard:
It analyzes the smart SuperTrend direction across 4 customizable timeframes (e.g., 15m, 1H, 4H, Daily) and generates a total score. The dashboard summarizes the macro picture of the market (Strong Bull, Ranging/Neutral, Strong Bear, etc.).
How to Use It? (Trading Strategy)
Trend Confluence: Before entering a trade, check the Dashboard. If the panel says "STRONG BULL," only look for Long opportunities.
Entries: Look for reversal candles when the price pulls back to the automatically drawn 0.382, 0.500, or 0.618 Fibonacci support/resistance levels in the direction of the main trend.
Take Profit: Use the 1.236, 1.618, and higher extension levels (red colored lines) as your take-profit targets. You can trail your stop loss slightly above/below the SuperTrend line.
Key Settings:
Smart Multiplier Mode: Toggle the ADX+ATR dynamic algorithm.
ADX Ranging/Trending Limits: Adjust the ADX thresholds (Default 20-25).
Fibo Min Wave Length: Higher values ignore more market noise; lower values plot fibs on smaller swings.
Panel Timeframes: Fully customizable 4 distinct timeframes for macro analysis.
Disclaimer: This indicator is designed for educational and analytical purposes only. It does not provide financial advice. Past performance is not indicative of future results. Indicateur

Adaptive Support & Resistance Pro with EMA Momentum Filter## Description
This indicator is an advanced tool designed to identify adaptive Support and Resistance (S/R) zones and combine them with an Exponential Moving Average (EMA) momentum filter. Unlike static S/R lines, this script uses a combination of momentum oscillators and dynamic pivot calculations to find high-probability reversal zones on higher or current timeframes.
The core philosophy of this indicator is to prevent "knife-catching." Instead of firing a signal immediately when a support or resistance level is formed, it waits for the price to confirm a change in momentum by crossing the EMA line in the direction of the trade.
---
## How It Works (Under the Hood)
### 1. Support & Resistance Detection
The script uses a multi-layered filter to detect true pivot points:
* **Legacy RSI & Modified RSI:** It evaluates overbought (>75) and oversold (<25) conditions using a 9-period Relative Strength Index.
* **Chande Momentum Oscillator (CMO) based on HMA:** It applies a 1-period CMO logic over Hull Moving Averages (HMA 5 and HMA 12) to detect immediate shifts in market velocity.
* **Close Pivots:** It uses deviation-free highest/lowest calculations (`ta.highest` and `ta.lowest`) combined with `ta.valuewhen` to fetch precise structural levels.
A **Support Zone** is formed only when the RSI is oversold, the CMO shows an upward momentum shift (>50), and a local low pivot is confirmed.
A **Resistance Zone** is formed when the RSI is overbought, the CMO shows a downward shift (<-50), and a local high pivot is confirmed.
### 2. S/R Timeframe Flexibility
Through the `request.security` function, users can plot these adaptive levels from higher timeframes (HTF) onto their current chart. To prevent **repainting** and back-shifting signals, the script strictly uses `barmerge.lookahead_off`.
### 3. EMA Momentum Trigger (The Confirmation Filter)
To filter out false breakouts and premature entries during heavy trend extensions, an EMA filter is introduced:
* **BUY Signal:** Triggered only when a new Support level has been established AND the price successfully closes above the EMA (`ta.crossover`).
* **SELL Signal:** Triggered only when a new Resistance level has been established AND the price successfully closes below the EMA (`ta.crossunder`).
**Strict Discipline:** The script uses an internal state machine (`waitForBuyBreak` / `waitForSellBreak`) ensuring that **only ONE signal** is fired per newly created S/R level. This completely eliminates the "whipsaw" effect (multiple false signals) when the price is consolidating or chopping around the moving average.
---
## Settings & Customization
* **Line Width / Colors:** Fully customize the visual thickness and color styling of your Support and Resistance zones.
* **S/R Timeframe:** Leave it blank for the current chart timeframe, or select higher timeframes (e.g., 4H or 1D) for macro level analysis.
* **Enable EMA Filter:** Toggle this option ON to use the momentum confirmation logic, or OFF to see signals immediately upon S/R level creation.
* **EMA Length:** Adjust the period of the confirmation line (Default is 50, but can be set to 20 for faster entries or 200 for macro trend-following).
---
## Alerts
The script includes three built-in alert conditions for automation:
1. `New S/R line` - Triggers whenever a new support or resistance level is plotted.
2. `BUY Signal` - Triggers when the EMA crossover confirms the support bounce.
3. `SELL Signal` - Triggers when the EMA crossunder confirms the resistance rejection.
## Disclaimer
This indicator is meant for educational and analytical purposes only. Past performance does not guarantee future results. Always practice proper risk management. Indicateur

VD Gann LevelsVD Gann Levels — by Vinith Dcosta & | Financepedia
A time-based Gann level indicator that automates what would otherwise be a manual charting process.
What it does
On the daily timeframe, the indicator identifies a significant unbroken swing high or low within a 6–12 month window and uses that pivot as an anchor. From the anchor date, it projects a series of Gann solar-degree intervals (90, 120, 144, 180, 216, 240, 270, 360) forward in time, converting each degree into a calendar date using mean solar motion (1° ≈ 1.0146 days). For every projected date that has already occurred, the indicator marks that day's high and low as horizontal levels.
Levels are calculated on the daily timeframe but render on all timeframes, so you can move down to intraday and see where price sits relative to each level.
The table
A summary table lists every degree, its classification (Major/Minor), the projected date, and the high/low of that date's candle. Dates that haven't occurred yet still show their projected date, with the high/low marked as "unplotted" until the candle forms. Each row carries an accuracy note: Minor degrees resolve to an exact date, while Major (cardinal) degrees may differ by up to one day due to seasonal variation in solar motion.
Inputs
Anchor: Auto-detect (default) selects the most extreme unbroken swing in the window, or switch to Manual to choose any anchor date from the calendar.
Pivot Lookback: Adjusts swing-detection sensitivity in auto mode.
Visual settings: Colors for the anchor and degree lines, line width, and a right-extension toggle.
How to use it
The plotted levels are intended as potential points of interest for confluence with your own analysis. The anchor and its degree projections give you a time-and-price map derived from a single significant swing. Use it alongside your existing method rather than in isolation.
Notes
Designed for the daily timeframe as the calculation base; displays across all timeframes.
The solar-degree dates approximate the classical Gann time method; cardinal degrees carry a ±1 day tolerance as noted in the table.
This script is for educational and informational purposes only. It does not produce buy or sell signals and is not financial advice. Trading decisions and their outcomes are solely your own responsibility. Always apply independent analysis and sound risk management.
Built by The Liquidity Architect" Indicateur

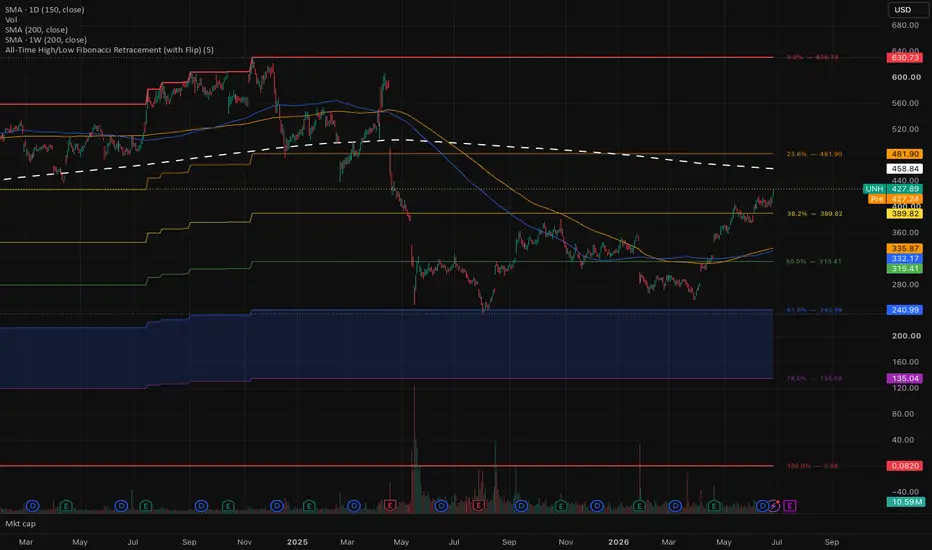
All-Time High/Low Fibonacci Retracement (with Flip)Tired of manually dragging the Fibonacci tool across macro charts every time an asset makes a new high or low? This indicator automates the entire process. It scans the absolute historical data of any asset to identify its true All-Time High (ATH) and All-Time Low (ATL), then dynamically projects standard Fibonacci retracement levels between them.
Whether you are analyzing a stock's decades-long macro cycle or looking for major historical support and resistance levels, this script keeps your charts perfectly anchored without the manual clutter.
Key Features
100% Automated Tracking: Uses historical state variables (var) to lock onto the ultimate lowest and highest prices ever printed on your current chart.
Real-Time Dynamic Updates: If the asset breaks out into price discovery (new ATH) or capitulates to a new bottom (new ATL), the script recalculates and shifts all Fibonacci lines instantly.
One-Click Flip Toggle: Built-in calculation flip. Measure retracements from the top down (bearish retracement) or flip it from the bottom up (bullish expansion) right from the settings menu.
Clean Visuals: Hard-coded with classic Fibonacci ratios (23.6%, 38.2%, 50.0%, 61.8%, 78.6%) using a subtle, non-intrusive color gradient that won't crowd your daily price action.
How to Use the Settings
Flip Retracement (Checkbox): * Unchecked (Default): Places 0% at the All-Time High and 100% at the All-Time Low (Ideal for finding support levels during a pullback from macro highs).
Checked: Places 0% at the All-Time Low and 100% at the All-Time High (Ideal for tracking major resistance levels and targets on the way back up).
💡 Pro-Tip: Because TradingView loads a limited number of historical bars on lower timeframes (like 5-minute or 15-minute charts), always load this indicator on a Daily (D), Weekly (W), or Monthly (M) chart first. This ensures the script catches the true historical inception highs and lows of the asset! Indicateur

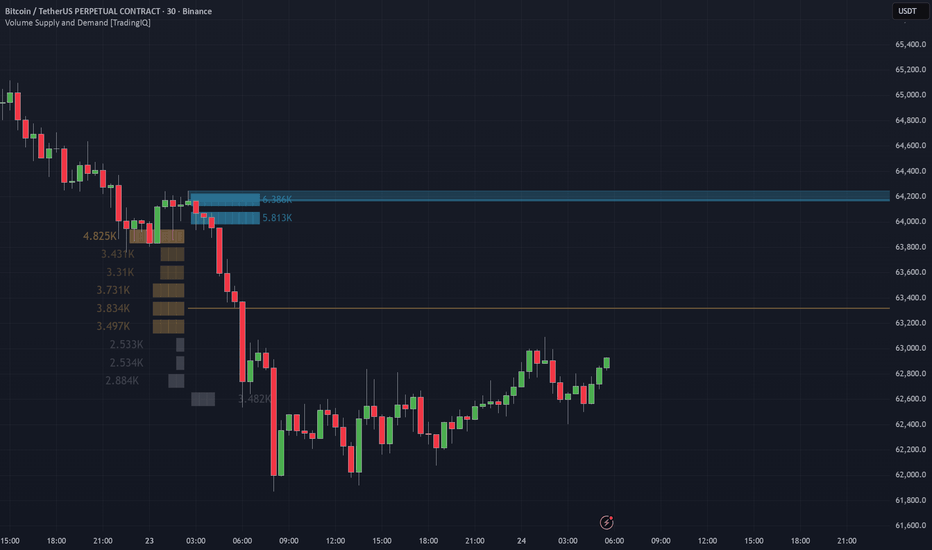
Volume Supply and Demand [TradingIQ]The Next Generation of Supply and Demand
You haven't seen a single good Supply and Demand indicator until today.
Let's be honest: almost every S/D indicator you've tried is either too late, constantly repaints, or simply flags every single random pivot on the chart as a "zone." That is not how institutional trading works. Traditional support and resistance might teach you to draw lines at every turning point, but if you've been trading for more than two weeks, you know that not every pivot holds weight in the future.
This tool was built to fix that. It is designed to filter out the low-quality noise, bypass the common structural flaws of basic chart metrics, and isolate nothing but genuine liquidity shock events where massive market orders actually took place.
Welcome to the Volume Supply and Demand engine.
---
How the Algorithm Works (The "Why")
Easier said than done, right? Finding a level that actually has institutional defense behind it requires deep mathematical screening. Instead of just looking for simple highs and lows, this algorithm detects explosive price moves via an advanced multi-step screening system.
First, the script calculates the True Range of consecutive candles to establish a baseline of normal market volatility. Once that baseline is set, it actively scans for sudden, abnormal expansions in price. It analyzes the specific angle, slope, and velocity of the expansion to ensure the move is statistically anomalous.
Demand Zones: These are flagged when extreme buying pressure forces a rapid, high-velocity move upwards, leaving behind a massive footprint of unfilled passive limit orders.
Supply Zones: These are flagged when intense selling aggression ramps up instantly, completely rejecting higher prices and driving the market down with severe negative velocity.
We strictly filter out the low-quality, minor pivot points. Once the strict qualifications of velocity and range expansion are met, the zone is detected and locked in instantly.
---
Structure vs. Normal Support & Resistance
To trade effectively, you must understand why these zones behave differently than standard horizontal support and resistance lines.
Traditional support and resistance lines can theoretically be drawn anywhere the market decides to turn around, regardless of the volume or speed behind the move. This creates messy charts cluttered with hundreds of psychological lines that offer no real edge.
This engine is different because it maps out an entire premium or discount zone based on the exact candle structural properties where the initial institutional imbalance occurred. It targets the literal origin of the reaction , creating a highly precise boundary where a major market participant stepped in aggressively to flip the auction control.
---
Deep-Dive Order Flow Features
We didn't just build a box-drawing tool. We added an entirely new dimension of volume analysis to help you gauge the actual internal strength of these levels.
Origin Volume Profiles: This is the game-changer. For every valid Supply or Demand zone generated, the indicator dynamically projects a micro Volume Profile directly inside the specific structural move that created the zone . You get an immediate, visually clear picture of exactly where the heavy volume was transacted during that specific liquidity event.
Delta & POC Lines: The algorithm identifies the Point of Control (POC) for both the buy-volume side and the sell-volume side independently. By plotting these lines, you can see precisely where the buyers or sellers exhibited their maximum aggression right before the major expansion occurred.
Time-Based Profiles: Volume isn't the only metric that matters. You can change the profile type inside the settings to "Time" to generate a profile that maps out exactly where the price spent the most time consolidating before exploding out of the zone.
Auto Hit-Deletion: The more a level is traded into, the weaker it gets as the resting passive orders are continuously matched and filled. To prevent you from trading dead levels, the indicator includes an automated hit-deletion toggle. The moment the price decisively pierces through a zone, the script recognizes the liquidity exhaustion and wipes the zone from your chart.
---
Settings & Optimization Guidelines
Because this script relies on heavy historical array calculations and complex request structures, proper optimization is essential for a smooth charting experience:
S/D Zone Style (Wick, Body, Candle): This dictates the strictness of your zone boundaries.
Wick (Default & Strongly Recommended): Draws the zone across the precise wick of the origin candle, capturing the maximum premium/discount extremity.
Body / Candle: Alternative constraints that alter the vertical width of the boxes based on the candle open and close values.
Max Zone Age (Bars): A zone created hundreds of bars ago losing its relevance because the participants holding those orders have likely closed their positions. This setting expires old zones to keep your chart fresh. If your chart experiences loading delays, lower this setting to roughly 200 bars.
Calculated Bars: To manage the calculation weight of the Epanechnikov kernel filtering and volume slice matrices, you can adjust the total calculation window. If your chart shows a red runtime error, lower this setting from 5000 down to 2000 bars.
Show Volume at Level: Turning this on overlays the raw numerical transaction data over each individual profile block, allowing for precise order flow calculation.
---
The Core Trading Logic
When a zone is formed by a massive imbalance of aggressive market orders, institutional participants frequently leave resting passive limit orders behind because the market moved too quickly to fill their entire block. When price returns to this exact zone for the first time, those resting orders are triggered. This acts as a defense line, forcing an aggressive, fast reversal.
If price returns to a zone multiple times, or if it begins to grind and spend a long time consolidating inside a box, that is a major warning sign. It means liquidity is actively depleting, the passive orders are being entirely consumed, and a massive liquidity shock breakout is right around the corner.
Disclaimer: This is not financial advice. Always test the mechanics against your own personal edge, backtest thoroughly, and integrate it properly within your broader risk management plan. Indicateur
5 Advanced MAs MTF🔵 OVERVIEW
5 Advanced MAs MTF is a professional moving averages indicator designed for traders who need to see multiple trend layers on a single chart simultaneously, each one with its own independent configuration and — above all — its own timeframe.
Unlike typical "ribbon" or "multi-MA" indicators on the market, which display several averages all computed on the active chart's timeframe, this indicator allows each of the 5 averages to have its own timeframe. You can have your EMA 8 on the 15-minute chart, your EMA 20 on the 1-hour, your EMA 50 on the 4-hour, and your SMA 200 on the daily, all plotted on the same 15-minute chart. That turns the indicator into a complete multi-timeframe control panel without needing to open four separate charts or saturate your installed indicators list.
🔶 KEY FEATURES
• 5 fully independent moving averages — each one configured separately and enabled or disabled individually.
• True multi-timeframe per MA — the core differentiator. Each MA can read its value from a higher, lower, or equal timeframe relative to the active chart. Leave it empty to use the chart's current timeframe.
• 9 moving average types — SMA, EMA, WMA, RMA, HMA, VWMA, TEMA, KAMA, and JMA. The last three (TEMA, KAMA, JMA) are implemented with their original formulas, no shortcuts. JMA uses Mark Jurik's standard defaults (Phase = 50, Power = 2).
• Configurable source per MA — Close, Open, High, Low, hl2, hlc3, ohlc4.
• Full visual styling per MA — color, width (1 to 10), and line style (solid, dashed, or dotted).
• Smart labels — each MA can show its label directly on the line, with configurable content (type, length, timeframe, or any combination of the three). Adjustable horizontal bar offset and text size.
• Interactive summary table — placed at any of the 9 chart anchors, displaying color column, type, length, timeframe, and price distance from each MA (in percentage and absolute value). Toggle to include or exclude hidden MAs.
• 22-alert system — 10 for Price↔MA crosses (bullish and bearish for each MA), 10 for MA↔MA crosses across 5 configurable slots (you pick which MA pairs to monitor), and 2 wildcard "any cross detected" alerts. All compatible with webhooks and automation.
• Works on any market and any timeframe — equities, futures, crypto, forex, commodities. From tick charts to monthly charts.
🔹 USE CASES BY TRADER STYLE
▪️ Day trader / scalper
Configure the first 3 MAs as short EMAs (8, 20, 50) on the chart's timeframe (5m or 15m) and leave MAs 4 and 5 as SMA 200 and VWMA 100 but reading them from a higher timeframe (1H, 4H, or daily). Result: you see your fast entry signals and the higher-timeframe bias at the same time without switching charts.
▪️ Swing trader
Recommended setup: EMA 20 and EMA 50 on the active chart (1H or 4H) + SMA 200 read from daily + VWMA 100 read from weekly. This lets you watch pullbacks against the EMA 20 on your operative timeframe with immediate confirmation that the higher-timeframe bias is aligned, plus the weekly VWMA as a volume-weighted "fair price" reference.
▪️ Position trader / long-term
Enable all 5 MAs on daily or weekly to build a complete structural map of the asset. The default configuration (EMA 8, EMA 20, EMA 50, SMA 200, and VWMA 100, all on daily) covers everything from fast momentum to the institutional level, combining pure-price references (SMA 200) with volume-weighted references (VWMA 100). The summary table shows the exact distance of price from each one.
▪️ Systematic crossover trader
The MA↔MA alert slots let you configure up to 5 specific crossovers simultaneously. Classic Golden Cross / Death Cross setup: Slot 1 with MA 3 (EMA 50) crossing MA 4 (SMA 200) on daily, with an automatic alert sent to your bot's webhook or notification system.
▪️ Multi-timeframe confluence trader
The most differentiating use case. Assign each MA to a different timeframe: MA 1 on 5m, MA 2 on 15m, MA 3 on 1H, MA 4 on 4H, MA 5 on daily or weekly. The summary table shows you in real time the distance of current price from the key level of each of those timeframes. When several MAs from different timeframes converge on the same price zone, that zone becomes a high-density structural level — one of the most-used concepts among institutional traders.
⚙️ INPUTS & CUSTOMIZATION
The entire indicator is 100% configurable from the Inputs panel. Each MA has its own expandable group with 14 controls. The summary table is also fully customizable (position, text size, background/border/text colors). The JMA global parameters (Phase and Power) live in their own section so advanced users can adjust them without cluttering the individual groups.
By default, all 5 MAs are enabled with a configuration tailored for daily and swing use: EMA 8 (blue, 1D), EMA 20 (red, 1D), EMA 50 (yellow, 1D), SMA 200 (green dashed, 1D), and VWMA 100 (pink dotted, 1D). The user can modify any of the parameters or reassign the MAs to other timeframes at any moment.
🔔 ALERTS
The indicator ships with 22 precompiled alerts ready to use:
• 5 alerts "Price crosses above MA N"
• 5 alerts "Price crosses below MA N"
• 10 alerts across 5 configurable slots for MA↔MA crossovers (bullish and bearish per slot)
• 2 wildcard alerts "any cross detected"
All messages include the {{ticker}} and {{close}} placeholders so they are directly parseable by webhooks, bots, and automation systems.
❓ FAQ
Does the indicator repaint?
No. The moving averages are computed on confirmed historical data. Cross alerts fire on the bar of the cross and values are not modified retroactively. To avoid signals that appear and disappear intra-bar, set the alerts to "Once per bar close".
Does it work on any timeframe?
Yes. From tick charts to monthly. In addition, each MA can have its own higher, lower, or equal timeframe relative to the active chart. The default timeframe is the current chart's timeframe.
Why 9 MA types?
Because each type behaves differently. SMA is the pure average; EMA weights recent bars more; HMA virtually eliminates lag; KAMA adapts to volatility; JMA is the smoothest while staying responsive; VWMA weights by volume. Having all of them available lets you use the right tool for each analysis without installing several separate indicators.
What are the 5 MA↔MA alert slots for?
They let you configure specific crossovers between any pair of MAs without having to create all possible combinations. In each slot you pick the fast MA and slow MA from dropdowns and receive alerts for the bullish and bearish crossovers of that pair. Example: Slot 1 = MA 3 crosses MA 4 (classic Golden Cross / Death Cross when MA 3 = EMA 50 and MA 4 = SMA 200).
What is the best MA combination?
There is no single "best" — it depends on the trading style and the asset. The Use Cases section above includes recommended configurations for the 5 most common profiles.
Is it compatible with webhooks and automation?
Yes. The 22 alerts use {{ticker}} and {{close}} placeholders in their messages, making them directly compatible with TradingView Webhooks, copy-trading platforms, Telegram/Discord bots, and any system that parses JSON.
Is it free to use?
Yes. Open-source indicator under the Mozilla Public License 2.0. You can review the full code, use it freely on TradingView, and create derivative copies while respecting the license terms.
⚠️ DISCLAIMER
This indicator is a technical analysis tool provided solely for educational and informational purposes. It does not constitute financial advice, an investment recommendation, or an invitation to trade any instrument. Moving averages are reactive (not predictive) indicators: they are based on historical data and, by their nature, can produce delayed signals in markets with sharp trend changes. In ranging or low-volatility market contexts, crossovers can be frequent and not particularly informative. Every trading decision is the sole responsibility of the trader. Past performance does not guarantee future results.
© 2026 Lic. Farias Foresi, Leandro M. — License: Mozilla Public License 2.0
Indicateur

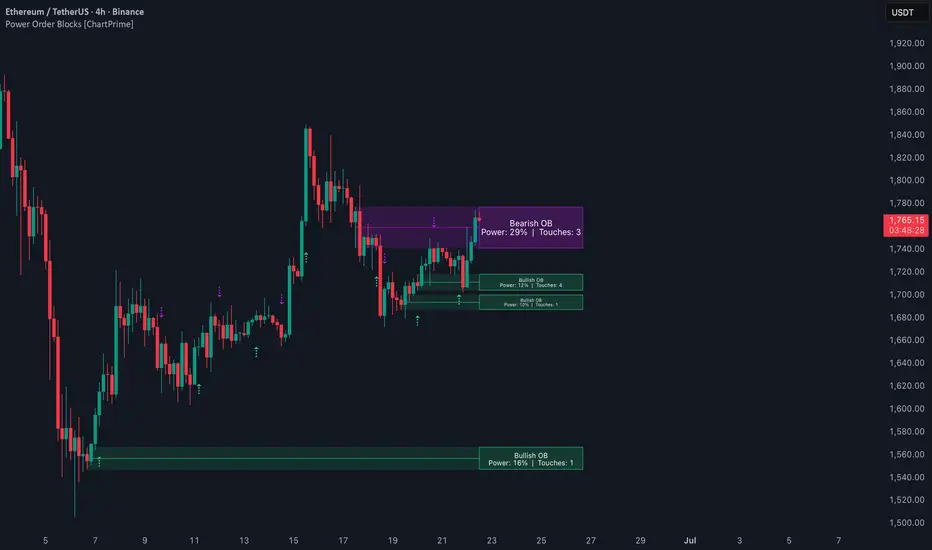
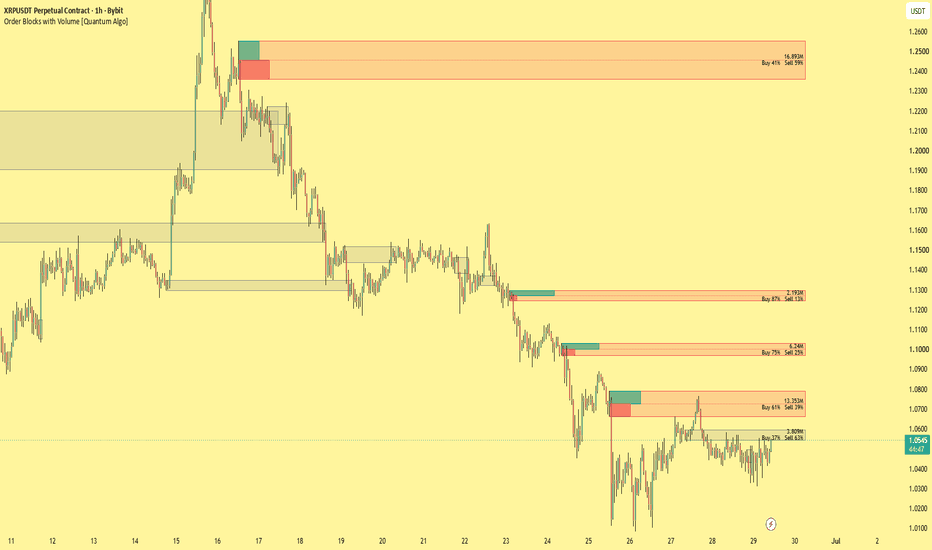
Order Blocks with Volume [Quantum Algo]Order Blocks with Volume
OVERVIEW
This indicator finds order blocks — the candles where a directional move originated before price broke market structure — and measures the buy and sell volume that traded inside each one. Every zone is drawn as a box that extends forward until price returns to it, and each active zone is labelled with its total volume and its buy/sell split, so you can tell at a glance which blocks were built on heavy participation and which were not.
It is built entirely from price and volume on the chart you apply it to. There is no repainting of confirmed zones: detection runs only on closed bars.
HOW DETECTION WORKS
1. Market structure. Confirmed swing highs and swing lows are located using a pivot of configurable length (Swing Length). A larger value isolates more significant structure and produces fewer, larger zones.
2. Break of structure. When a candle closes above the most recent confirmed swing high (bullish) or below the most recent confirmed swing low (bearish), the indicator treats it as a break of structure and looks for the order block that produced the move.
3. The order block candle. Starting from the breakout, the script steps back over the impulse candles and marks the last opposite-close candle before the move began — the last down-close candle for a bullish block, the last up-close candle for a bearish block. This is the origin of the displacement and the level price often revisits.
4. Zone range. The block is drawn from that candle using either its full high-to-low range (Wick) or its open-to-close body (Body).
VOLUME ENGINE
For each order block candle the indicator estimates how much of the traded volume was buying versus selling, using where the candle closed within its own range:
- Buy volume is weighted by how close the candle closed to its high.
- Sell volume is weighted by how close it closed to its low.
This split is shown two ways:
- Buy / Sell volume bars: two horizontal bars anchored at the left of the zone — buy on the top half, sell on the bottom half — with lengths proportional to each side. The Volume Bar Length setting controls how long they can extend (they are automatically kept inside the zone).
- Volume label: written inside the zone on the right edge, showing the total volume of the block and the buy% / sell% balance.
Volume strength is the block's volume divided by the average volume over a configurable baseline (Volume Baseline Length). It is used by the optional filter below to keep only the heaviest blocks.
ZONE LIFECYCLE
- Active. A live zone extends to the current bar and shows its volume bars and label.
- Mitigation. When price first trades back into a zone, the 50% line marks the equilibrium and an alert can fire.
- Invalidation. A zone is invalidated when price moves through its far edge. The source can be a wick touch or a candle close (Invalidation Source).
- Breaker. If "Flip Broken Zones to Breaker Blocks" is on, an invalidated zone is kept and re-coloured as a breaker, since broken support can act as resistance and vice versa.
- Historic. If "Keep Invalidated Zones (Historic)" is on, finished zones are frozen at the bar they died, re-coloured neutral, and their volume bars and text are removed to keep the chart clean.
- If neither option is on, invalidated zones are removed.
To avoid clutter the indicator will not stack a new zone on top of an existing active zone in the same area, limits the number of active zones per side, and automatically drops any zone older than the drawing range.
ON-CHART ELEMENTS
- Coloured boxes: bullish and bearish order blocks (and a neutral colour for breaker/historic).
- Two inner bars per active zone: buy (top) and sell (bottom) volume.
- A dotted line through the middle of active zones: the 50% mitigation / equilibrium level.
- Text inside active zones: total volume and buy% / sell%.
SETTINGS
Structure & Detection
- Swing Length — pivot length used to define structure. Higher = larger, more significant zones.
- Impulse Lookback (bars) — how far back to search for the origin candle after a break of structure.
- Zone Range — Wick (full range) or Body (open-to-close).
- Max Active Zones / Side — cap on simultaneously active zones per direction.
Invalidation
- Invalidation Source — Wick (a high/low piercing the zone) or Close (a candle closing beyond it).
- Flip Broken Zones to Breaker Blocks — keep and re-colour broken zones as breakers.
- Keep Invalidated Zones (Historic) — freeze finished zones instead of deleting them.
Volume Engine
- Show Volume Label — write volume and buy/sell% inside active zones.
- Show Buy / Sell Volume Bars — draw the proportional buy/sell bars.
- Volume Baseline Length — averaging length used to rate volume strength.
- Volume Bar Length (bars) — maximum length of the buy/sell bars.
Filters
- Only Show High-Volume Zones — hide blocks below the strength threshold.
- Min Volume Strength (x avg) — threshold as a multiple of average volume.
- Filter Oversized Zones — skip blocks taller than the ATR limit.
- Max Zone Height (ATR x) — the height limit, in multiples of ATR.
Style
- Bullish Zone, Bearish Zone, Buy Volume, Sell Volume, Breaker / Historic, Text — colours.
- Zone Extension (bars) — how far active zones project past the current bar.
- Show 50% Mitigation Line — toggle the equilibrium line.
ALERTS
Alerts are raised through the alert() function for two events: an order block being tapped (mitigation) and an order block being broken (breaker formed). To use them, create an alert on the indicator and choose the "Any alert() function call" condition.
HOW TO USE
Order blocks mark areas where significant orders were likely placed. Traders commonly watch for price to return to an un-mitigated block and react there, and use the buy/sell volume split and strength to judge how meaningful a block is — a block built on high, one-sided volume is generally treated as more significant than a thin one. Combine the zones with your own confirmation and risk management; this tool highlights levels, it does not generate buy or sell signals.
DISCLAIMER
Nothing here is financial advice or a guarantee of any outcome. Past behaviour of price around order blocks does not predict future results. Always do your own research and manage risk. Indicateur
Sweep Reclaim Entry Engine [trade_w_samet]🎯 Sweep Reclaim Entry Engine
Sweep Reclaim Entry Engine is a structured liquidity-sweep and reclaim analysis indicator designed to help traders study confirmed swing levels, controlled liquidity penetrations, reclaim strength, setup quality, directional alignment, and visual risk/reward models directly on the price chart.
This script focuses on one main concept:
Confirmed swing sweep and reclaim-based entry visualization.
It is not designed to mark every wick beyond every nearby high or low.
It is not designed to treat every penetration as a valid liquidity sweep.
It is not designed to create constant buy/sell labels.
Instead, the goal of Sweep Reclaim Entry Engine is to confirm structural swing levels, monitor their lifecycle, detect controlled penetrations beyond those levels, validate directional reclaims, apply configurable quality and market filters, and visualize accepted setups using one Entry level, one protective Stop Loss level, and one configurable risk/reward target.
The indicator includes:
• Confirmed swing-high and swing-low detection
• Reactive, Balanced, Structural, and Custom swing modes
• ATR-normalized level merging and proximity logic
• Fresh, Armed, Swept, Reclaimed, and Consumed level states
• Wick Only, Wick or Body, and Body Required sweep modes
• Minimum and maximum ATR-normalized sweep-depth filters
• First-penetration-only logic
• Multi-level sweep selection
• Dual-side sweep protection
• Same Candle, Fast, Flexible, and Custom reclaim windows
• Loose, Balanced, Strict, and Custom reclaim-strength modes
• Reclaim close-buffer, close-location, body-strength, and wick-rejection checks
• A transparent 0–100 setup-quality score
• A+, A, and B setup grades
• Loose, Balanced, Strict, and Custom quality-filter modes
• Relative-volume quality context
• Highest Quality and Nearest Level candidate-selection modes
• Direction, cooldown, cluster, duplicate-bar, and opposite-conflict controls
• Chart EMA, confirmed higher-timeframe EMA, and Combined EMA bias
• Optional volatility and market-efficiency filtering
• Entry ATR and Sweep Extreme stop-loss models
• A configurable 0.25R to 15R target
• One-active-trade-at-a-time logic
• Stop First and Target First same-bar assumptions
• Active TP / SL boxes and Entry / TP / SL lines
• SL-specific visual cleanup
• Important-only sweep-label filtering
• Full, Clean, Minimal, and Mobile chart profiles
• Full, Compact, Trade Only, and Off dashboard modes
• Adjustable marker, label, result, and dashboard sizes
• Crimson, Ice Blue, Monochrome, and fully custom colors
• Static TradingView alert conditions
• Optional dynamic alert() messages
• Compact bottom-right dashboard
• Confirmed-close permanent signals
• Confirmed higher-timeframe data handling
The purpose of this script is to help users visually study where a confirmed swing-level sweep is followed by a qualified directional reclaim.
It should be treated as a chart-analysis and educational decision-support tool.
It is not financial advice.
It is not an automated trading system.
It does not guarantee profitable trades.
It does not execute broker orders.
It does not replace personal analysis, risk management, or trade validation.
━━━━━━━━━━━━━━━━━━━━━━
📌 OVERVIEW
━━━━━━━━━━━━━━━━━━━━━━
At a high level, Sweep Reclaim Entry Engine does the following:
• Detects confirmed bullish and bearish swing pivots.
• Stores accepted swing highs and swing lows in separate internal level memories.
• Prevents near-duplicate levels using ATR-based merge tolerance.
• Tracks whether each level is Fresh, Armed, Swept, Reclaimed, or Consumed.
• Arms a level when price moves within the selected ATR distance.
• Detects a new penetration beyond an eligible swing level.
• Measures penetration depth relative to ATR.
• Classifies the sweep as wick-based or body-based.
• Applies minimum depth, maximum depth, first-interaction, multi-level, and dual-side rules.
• Moves the accepted level into the Swept state.
• Waits for price to reclaim the level within the selected reclaim window.
• Checks reclaim close buffer, close location, candle body strength, candle direction, and wick rejection.
• Calculates a 0–100 setup-quality score.
• Assigns an internal A+, A, or B grade.
• Applies the selected minimum-quality requirement.
• Compares multiple eligible reclaim candidates.
• Applies direction, trend-bias, market, cooldown, clustering, duplicate, and conflict rules.
• Confirms final BUY and SELL reclaim signals only after candle close.
• Projects Entry, Stop Loss, and one configurable take-profit target.
• Maintains one active visual trade model at a time.
• Tracks TP and SL events after the entry candle.
• Applies the selected same-candle TP / SL assumption.
• Preserves successful models when historical display is enabled.
• Deletes failed-model boxes, lines, and original signal labels after SL.
• Leaves only a small CLOSED SL HIT label for failed models.
• Displays engine, bias, quality, signal, and trade information in the bottom-right dashboard.
• Provides sweep, signal, grade, trade-open, TP, and SL alerts.
The script is intentionally built as a structured sequence.
It does not include machine-learning prediction.
It does not claim that every sweep will reverse.
It does not treat the quality score as a probability.
It provides a transparent way to study confirmed swing sweeps, directional reclaims, and their visual trade lifecycle.
━━━━━━━━━━━━━━━━━━━━━━
🧠 CORE IDEA
━━━━━━━━━━━━━━━━━━━━━━
The core idea behind Sweep Reclaim Entry Engine is based on the difference between a liquidity penetration and a confirmed reclaim.
A sweep occurs when price trades beyond a previously confirmed swing high or swing low.
A reclaim occurs when price returns through that level and closes with enough directional strength to satisfy the active rules.
The engine does not treat the sweep itself as an entry.
Instead, it separates the process into distinct stages:
Confirmed swing
→ managed level
→ level approach
→ valid penetration
→ sweep classification
→ reclaim window
→ reclaim confirmation
→ quality scoring
→ final filtering
→ confirmed entry model
For a bullish setup, the engine studies a penetration below a confirmed swing low and a later close back above that level.
For a bearish setup, the engine studies a penetration above a confirmed swing high and a later close back below that level.
The reclaim can occur on the same candle or within a configurable number of bars.
The final setup can then be evaluated using:
• sweep depth
• reclaim close quality
• wick rejection
• candle-body strength
• level freshness
• relative volume
• displacement
• market condition
• level cleanliness
• chart EMA alignment
• confirmed higher-timeframe EMA alignment
• cooldown and cluster rules
• opposite-signal conflict handling
The goal is not to maximize signal quantity.
The goal is to create an understandable process that explains how a stored swing level becomes a sweep candidate, how that sweep becomes a reclaim candidate, and how the final entry model is accepted or rejected.
━━━━━━━━━━━━━━━━━━━━━━
🧩 WHY THIS SCRIPT IS NOT A SIMPLE BUY/SELL INDICATOR
━━━━━━━━━━━━━━━━━━━━━━
Sweep Reclaim Entry Engine is not intended to be used as a blind buy/sell system.
The script is structured as a visual review workflow:
A pivot becomes confirmed
→ the swing level is stored
→ duplicate levels are filtered
→ price approaches the level
→ the level becomes Armed
→ price creates a new penetration
→ penetration type and depth are validated
→ the level becomes Swept
→ the reclaim window opens
→ reclaim strength is evaluated
→ a quality score is calculated
→ the setup receives a grade
→ eligible candidates are compared
→ execution filters are checked
→ the signal must remain valid at candle close
→ Entry, SL, and TP are projected
→ the active model is monitored
→ the model closes at TP or SL
→ the visual result is archived or cleaned
Each stage serves a specific purpose.
The confirmed-pivot engine defines the structural reference.
The level-memory engine prevents the script from treating all historical highs and lows as permanently active.
The Armed state separates a distant level from a level that price is actively approaching.
The sweep engine distinguishes a controlled penetration from a deep breakout.
The reclaim engine defines what qualifies as a directional return through the level.
The quality engine combines several independent setup characteristics.
The execution engine prevents clustered, duplicate, conflicting, or bias-opposed entries.
The trade model standardizes the visual Entry, risk, and reward references.
The dashboard explains the engine state and active model.
This makes the script a structured sweep-reclaim analysis tool, not a guaranteed signal generator.
━━━━━━━━━━━━━━━━━━━━━━
⚙️ HOW THE SCRIPT WORKS
━━━━━━━━━━━━━━━━━━━━━━
The script operates through several connected systems.
First, it confirms swing highs and swing lows using the selected pivot sensitivity.
Reactive mode uses shorter pivot lengths.
Balanced mode uses medium pivot lengths.
Structural mode uses wider pivot lengths and is the default.
Custom mode allows manual left-side and right-side pivot lengths.
float confirmedSwingHigh = ta.pivothigh(high, swingLeft, swingRight)
float confirmedSwingLow = ta.pivotlow(low, swingLeft, swingRight)
int confirmedHighBar = bar_index - swingRight
int confirmedLowBar = bar_index - swingRight
After confirmation, accepted swing levels are stored in separate high-side and low-side arrays.
Each level stores contextual information including:
• level price
• original pivot bar
• lifecycle state
• interaction count
• sweep bar
• sweep depth
• sweep extreme
• sweep type
• reclaim bar
• visual line reference
When price approaches a stored level, the level can move from Fresh to Armed.
When price creates a new penetration beyond the level, the engine checks:
• penetration mode
• minimum ATR depth
• maximum ATR depth
• first-attempt permission
• multi-level selection
• dual-side sweep protection
f_isValidHighSweep(float levelPrice, int attempts) =>
float depthATR = (high - levelPrice) / safeATR
int kind = f_highSweepKind(levelPrice)
bool depthValid = depthATR >= minSweepDepthATR and depthATR <= effectiveMaxSweepDepthATR
bool attemptValid = not firstInteractionOnly or attempts == 0
bool valid = f_isNewHighPenetration(levelPrice) and depthValid and attemptValid and f_modeAcceptsKind(kind)
valid
f_isValidLowSweep(float levelPrice, int attempts) =>
float depthATR = (levelPrice - low) / safeATR
int kind = f_lowSweepKind(levelPrice)
bool depthValid = depthATR >= minSweepDepthATR and depthATR <= effectiveMaxSweepDepthATR
bool attemptValid = not firstInteractionOnly or attempts == 0
bool valid = f_isNewLowPenetration(levelPrice) and depthValid and attemptValid and f_modeAcceptsKind(kind)
valid
A valid sweep moves the level into the Swept state.
The reclaim engine then waits for price to close back through the level within the selected window.
The reclaim must pass every enabled strength requirement.
The accepted candidate receives a quality score and grade.
If more than one candidate qualifies, the active Candidate Selection mode chooses the final candidate.
The final signal must also pass direction, bias, market, cooldown, cluster, duplicate-bar, and conflict rules.
Only after the bar closes with all conditions still valid can the permanent BUY or SELL reclaim signal and visual trade model appear.
━━━━━━━━━━━━━━━━━━━━━━
🟢 BULLISH SWEEP RECLAIM LOGIC
━━━━━━━━━━━━━━━━━━━━━━
A bullish sweep-reclaim setup begins with a confirmed swing low.
The swing low must be stored and remain eligible.
Price can then move close enough to place the level in the Armed state.
A bullish sweep is created when price penetrates below the swing-low level and the penetration satisfies the active sweep rules.
The engine may require:
• a wick-only penetration
• a wick or body penetration
• body participation beyond the level
• a minimum ATR-normalized depth
• a maximum ATR-normalized depth
• the first valid penetration attempt
• selection as the nearest valid level
• no simultaneous high-side sweep
After the low-side sweep, the bullish reclaim must occur inside the selected reclaim window.
The reclaim can require:
• a close above the swept level
• an ATR-based close buffer above the level
• a high close location inside the candle
• minimum body strength relative to ATR
• a bullish candle body when enabled
• minimum lower-wick rejection for same-candle reclaims
• a final score above the active quality threshold
• permission from the selected signal direction
• bullish chart and/or HTF EMA alignment
• permission from the active market-condition filter
• cooldown and cluster permission
• no stronger bearish conflict
f_isValidLowReclaim(int index) =>
bool valid = false
if index >= 0 and index < array.size(lowPrices) and barstate.isconfirmed
int state = array.get(lowStates, index)
int sweepBar = array.get(lowSweepBars, index)
if state == STATE_SWEPT and sweepBar >= 0
float levelPrice = array.get(lowPrices, index)
int barsAfterSweep = bar_index - sweepBar
bool windowPass = barsAfterSweep >= 0 and barsAfterSweep <= reclaimWindowBars
bool closePass = close >= levelPrice + safeATR * reclaimCloseBufferATR
bool locationPass = f_bullCloseLocation() >= reclaimCloseLocationThreshold
bool bodyPass = f_bodyATR() >= reclaimBodyStrengthATR
bool directionPass = not requireDirectionalCandle or close > open
bool sameBar = barsAfterSweep == 0
bool wickPass = not requireSameCandleWick or not sameBar or f_lowerWickRatio() >= reclaimWickThreshold
valid := windowPass and closePass and locationPass and bodyPass and directionPass and wickPass
valid
When every enabled rule passes at candle close, the script displays a BUY RECLAIM label.
If the visual trade model is enabled and no trade is active, the setup creates:
• Entry at the confirmed signal-bar close
• Stop Loss below entry or below the sweep extreme
• TP above entry
• blue/cyan reward box
• red risk box
• thick white Entry line
• blue TP line
• red SL line
This does not mean price must continue upward.
It means the configured bullish sweep-reclaim conditions were confirmed at the close of that candle.
━━━━━━━━━━━━━━━━━━━━━━
🔴 BEARISH SWEEP RECLAIM LOGIC
━━━━━━━━━━━━━━━━━━━━━━
A bearish sweep-reclaim setup begins with a confirmed swing high.
The swing high must be stored and remain eligible.
Price can then move close enough to place the level in the Armed state.
A bearish sweep is created when price penetrates above the swing-high level and the penetration satisfies the active sweep rules.
The engine may require:
• a wick-only penetration
• a wick or body penetration
• body participation beyond the level
• a minimum ATR-normalized depth
• a maximum ATR-normalized depth
• the first valid penetration attempt
• selection as the nearest valid level
• no simultaneous low-side sweep
After the high-side sweep, the bearish reclaim must occur inside the selected reclaim window.
The reclaim can require:
• a close below the swept level
• an ATR-based close buffer below the level
• a low close location inside the candle
• minimum body strength relative to ATR
• a bearish candle body when enabled
• minimum upper-wick rejection for same-candle reclaims
• a final score above the active quality threshold
• permission from the selected signal direction
• bearish chart and/or HTF EMA alignment
• permission from the active market-condition filter
• cooldown and cluster permission
• no stronger bullish conflict
When every enabled rule passes at candle close, the script displays a SELL RECLAIM label.
If the visual trade model is enabled and no trade is active, the setup creates:
• Entry at the confirmed signal-bar close
• Stop Loss above entry or above the sweep extreme
• TP below entry
• blue/cyan reward box
• red risk box
• thick white Entry line
• blue TP line
• red SL line
This does not mean price must continue downward.
It means the configured bearish sweep-reclaim conditions were confirmed at the close of that candle.
━━━━━━━━━━━━━━━━━━━━━━
💎 SWEEP RECLAIM QUALITY FILTER SYSTEM
━━━━━━━━━━━━━━━━━━━━━━
The script includes a multi-component quality system to reduce low-context reclaim signals.
This is important because not every sweep has the same structural meaning and not every reclaim candle has the same directional strength.
The quality engine evaluates eight components:
Sweep Depth — maximum 15 points
Measures where the penetration sits inside the active minimum-to-maximum sweep range.
The score favors a controlled sweep depth rather than automatically rewarding the deepest penetration.
Reclaim Close — maximum 20 points
Measures the directional location of the candle close.
A bullish setup receives more points when the reclaim closes near the top of the candle.
A bearish setup receives more points when the reclaim closes near the bottom.
Wick Rejection — maximum 15 points
Measures the directional rejection wick.
For multi-bar reclaims, the engine can also consider the stored sweep type and current reclaim structure.
Level Freshness — maximum 10 points
Newer levels generally receive more freshness points than levels that have remained active for a long time.
Relative Volume — maximum 10 points
Compares current volume with the selected baseline length.
When useful volume is not available, the engine avoids treating the setup as automatically invalid.
Displacement — maximum 15 points
Combines candle-body strength and the distance reclaimed through the level.
Market Condition — maximum 10 points
Uses candle range and ATR-regime information.
Level Cleanliness — maximum 5 points
Rewards levels with fewer prior interaction attempts.
The total is rounded and limited to 0–100.
float qualityScore = math.min(100.0, math.max(0.0, math.round(
sweepScore + closeScore + wickScore + freshnessScore +
volumeScore + displacementScore + marketScore + cleanlinessScore
)))
The quality score is not a win probability.
It is not a verified accuracy percentage.
It is an internal measurement of how closely the completed setup matches the selected structural rules.
━━━━━━━━━━━━━━━━━━━━━━
📏 SWEEP / ATR FILTER
━━━━━━━━━━━━━━━━━━━━━━
The sweep-depth filter measures the penetration beyond a swing level relative to ATR.
For a high-side sweep:
Sweep Depth = (High − Swing High) / ATR.
For a low-side sweep:
Sweep Depth = (Swing Low − Low) / ATR.
Minimum Sweep Depth rejects penetrations that may be too small to represent a meaningful liquidity event.
Maximum Sweep Depth rejects penetrations that may be too deep to represent a controlled sweep and may instead behave more like a breakout.
The default values are:
Minimum Sweep Depth = 0.05 ATR.
Maximum Sweep Depth = 0.80 ATR.
ATR normalization allows the threshold to adapt to changing volatility.
A 0.20 ATR sweep represents a relative move rather than a fixed number of points.
This helps the engine operate across different price scales.
However, ATR normalization does not make one configuration universally suitable.
A symbol with session gaps, irregular volume, or unusual volatility can still behave differently from another market.
A deeper sweep is not automatically a better setup.
Sweep depth is only one component of the complete reclaim process.
━━━━━━━━━━━━━━━━━━━━━━
🕯️ DISPLACEMENT QUALITY FILTER
━━━━━━━━━━━━━━━━━━━━━━
The displacement component evaluates whether the reclaim candle moves with enough directional force.
The engine considers:
• candle-body size relative to ATR
• distance closed beyond the reclaimed level
• bullish or bearish directional recovery
For bullish setups, stronger displacement generally means:
• a larger bullish body
• a close further above the reclaimed swing low
For bearish setups, stronger displacement generally means:
• a larger bearish body
• a close further below the reclaimed swing high
Reclaim Strength Mode can also impose a minimum body-size requirement before the setup reaches the quality-scoring stage.
Loose mode allows smaller directional bodies.
Balanced mode uses moderate requirements.
Strict mode requires stronger completed-candle behavior.
Custom mode exposes the manual threshold.
Displacement is not used as a prediction.
It is used to measure whether the completed reclaim candle demonstrates the selected degree of directional response.
━━━━━━━━━━━━━━━━━━━━━━
📊 REACTION STRENGTH FILTER
━━━━━━━━━━━━━━━━━━━━━━
The reaction-strength layer evaluates the candle that confirms the reclaim.
The active rules can include:
• close through the swept level
• ATR-based close buffer
• directional close location
• body strength relative to ATR
• bullish or bearish candle direction
• same-candle rejection wick
Reclaim Strength Mode provides:
Loose
Uses lower close-buffer, close-location, body-strength, and wick-rejection requirements.
Balanced
Uses moderate thresholds.
Strict
Uses the strongest built-in thresholds and is the default.
Custom
Uses the manual values selected by the user.
Strict mode applies:
• 0.05 ATR reclaim close buffer
• 0.70 directional close-location threshold
• 0.15 ATR minimum body strength
• 0.28 same-candle wick-rejection ratio
Require Directional Candle Body can additionally require:
• close above open for bullish reclaims
• close below open for bearish reclaims
Require Same-Candle Wick Rejection applies the wick requirement when the sweep and reclaim occur on the same candle.
The reaction-strength system is designed to distinguish a simple touch from a stronger completed directional response.
━━━━━━━━━━━━━━━━━━━━━━
🧼 CONFIRMED RECLAIM FILTER
━━━━━━━━━━━━━━━━━━━━━━
The reclaim layer requires the setup to remain valid at candle close.
Available reclaim windows include:
Same Candle
The penetration and reclaim must complete on the same candle.
Fast
The reclaim can occur on the sweep candle or the next candle.
Flexible
The reclaim can occur within three bars and is the default.
Custom
The user selects the maximum number of bars.
The engine stores the sweep bar and compares the current bar with the allowed reclaim window.
The sweep state timeout is automatically prevented from becoming shorter than the active reclaim window.
A reclaimed setup can also be blocked by:
• insufficient close buffer
• weak close location
• weak candle body
• missing directional body
• missing same-candle wick rejection
• low quality score
• direction restriction
• chart EMA misalignment
• higher-timeframe EMA misalignment
• market-condition failure
• active-trade restriction
• cooldown
• same-direction clustering
• duplicate-bar protection
• opposite-direction conflict
Final permanent BUY and SELL signals require confirmed-bar logic.
This means an unfinished realtime candle can temporarily trade beyond a level, but it does not become a permanent reclaim signal unless the conditions remain valid when the bar closes.
━━━━━━━━━━━━━━━━━━━━━━
🎯 ENTRY MODEL
━━━━━━━━━━━━━━━━━━━━━━
When a final BUY or SELL reclaim signal passes every enabled condition, the script can create a visual entry model.
The Entry reference is the close of the confirmed signal candle.
The engine stores:
• trade direction
• entry bar
• entry price
• stop price
• risk distance
• selected RR
• target price
• setup quality
• setup grade
The trade model opens only when:
• Enable Trade Model is active
• no visual trade is already active
• the final reclaim signal is confirmed
• the calculated risk distance is larger than the symbol’s minimum tick
• same-bar reopening is permitted when the previous model closed on the same candle
if enableTradeModel and not tradeActive and (allowSignalOnExitBar or not tradeClosedThisBar)
if buyReclaimSignal
float sweepExtreme = array.get(lowSweepExtremes, selectedLowReclaimIndex)
float candidateStop = stopLossMode == "Entry ATR Multiplier" ?
close - safeATR * stopATRMultiplier :
sweepExtreme - safeATR * stopBufferATR
float candidateRisk = close - candidateStop
The entry model is a visual analysis reference.
It is not a broker market order.
It does not include spread, slippage, commission, latency, or partial fills.
━━━━━━━━━━━━━━━━━━━━━━
🛑 ATR STOP-LOSS MODEL
━━━━━━━━━━━━━━━━━━━━━━
The script includes two stop-placement models.
Entry ATR Multiplier
For BUY setups:
Stop = Entry − ATR × multiplier.
For SELL setups:
Stop = Entry + ATR × multiplier.
This is the default mode.
The default Entry ATR Stop Multiplier is 2.00 ATR.
The multiplier can be adjusted from 0.10 to 15.00.
Sweep Extreme + ATR Buffer
For BUY setups:
Stop = stored low-side sweep extreme − ATR buffer.
For SELL setups:
Stop = stored high-side sweep extreme + ATR buffer.
The default Sweep-Extreme Buffer is 0.10 ATR.
float candidateStop = stopLossMode == "Entry ATR Multiplier" ?
close - safeATR * stopATRMultiplier :
sweepExtreme - safeATR * stopBufferATR
The selected stop determines the visual risk distance.
That risk distance also determines the take-profit distance.
The displayed stop is a planning reference only.
It does not place or manage a broker stop order.
━━━━━━━━━━━━━━━━━━━━━━
🎯 TAKE-PROFIT RR MODEL
━━━━━━━━━━━━━━━━━━━━━━
The script uses one configurable take-profit target.
The target is calculated from the distance between Entry and Stop Loss.
For BUY models:
TP = Entry + Risk × RR.
For SELL models:
TP = Entry − Risk × RR.
The Risk / Reward Target can be adjusted from:
0.25R to 15.00R.
The default is 2.00R.
activeTradeRisk := candidateRisk
activeTradeRR := tradeRiskReward
activeTradeTarget := close + candidateRisk * tradeRiskReward
The displayed RR controls the geometric distance of the projected target.
It does not represent a performance claim.
It does not guarantee that price will reach the target.
Changing the stop model or stop multiplier changes the target distance because both levels are based on the same initial risk.
━━━━━━━━━━━━━━━━━━━━━━
📦 ACTIVE TP / SL BOX SYSTEM
━━━━━━━━━━━━━━━━━━━━━━
When a confirmed reclaim model opens, the script can draw:
• blue/cyan TP box
• red SL box
• thick white Entry line
• blue TP line
• red SL line
• BUY RECLAIM or SELL RECLAIM label
The active boxes and lines extend to the right as new candles appear.
The Entry line is intentionally pure white and visually thicker than the TP and SL references.
When TP is reached:
• the trade model closes
• active boxes and lines stop at the closing bar
• the TP result label appears
• completed visuals can remain when Show Historical Trades is enabled
• completed visuals can be faded using Completed Trade Transparency
When SL is reached:
• the TP box is deleted
• the SL box is deleted
• the Entry line is deleted
• the TP line is deleted
• the SL line is deleted
• the original BUY or SELL signal label associated with that trade is deleted
• only a small CLOSED SL HIT label remains
This SL-specific cleanup keeps failed models visually concise.
The active trade model is educational and bar-based.
It does not simulate real broker execution.
━━━━━━━━━━━━━━━━━━━━━━
🚦 ONE ACTIVE TRADE AT A TIME
━━━━━━━━━━━━━━━━━━━━━━
The script includes one-active-trade-at-a-time logic.
If a visual trade model is active, the engine does not open another trade model until the current model closes.
Block Signals During Active Trade can also prevent new final signal labels from being accepted while the active model is open.
Allow New Signal on Exit Bar controls whether a new model can open on the same candle that closes the current model.
The default is disabled.
This design separates:
• market-level calculation
• sweep and reclaim detection
• permission to create a new trade model
The engine can continue updating structural levels and market context while a model is active.
However, the one-active-model rule prevents overlapping TP / SL boxes and conflicting lifecycle states.
This is a visual-management rule.
It is not a restriction on the user’s personal trading activity.
━━━━━━━━━━━━━━━━━━━━━━
⚠️ SAME-CANDLE TP / SL HANDLING
━━━━━━━━━━━━━━━━━━━━━━
The script begins checking TP and SL after the entry candle.
If both TP and SL are touched on the same later candle, standard OHLC data does not reveal the actual intrabar sequence.
The script therefore provides two selectable assumptions:
Stop First
The stop is processed before the target.
This is the default and more conservative assumption.
Target First
The target is processed before the stop.
This is the more optimistic assumption.
Neither option reproduces exact tick-level broker execution.
The model does not include:
• bid/ask spread
• slippage
• order latency
• partial fills
• queue priority
• execution venue rules
• intrabar tick order
Same-candle handling is a modeling choice required by the limits of standard bar data.
━━━━━━━━━━━━━━━━━━━━━━
🏷️ SWEEP RECLAIM LABELS
━━━━━━━━━━━━━━━━━━━━━━
The script uses separate labels for sweep events, reclaim signals, and trade results.
Sweep labels can display:
SWEEP HIGH
or:
SWEEP LOW
The Sweep Label Filter can show:
Important Only
Only sweeps that meet the active importance threshold receive visible labels.
All Valid
Every accepted sweep can receive a visible label.
The default Minimum Sweep Importance is 65.
BUY and SELL reclaim labels can use three display styles:
Full
Example:
▲ A+ BUY RECLAIM ▲
QUALITY • 87/100
or:
▼ A+ SELL RECLAIM ▼
QUALITY • 84/100
Compact
Displays a shorter direction, grade, and score format.
Icon
Displays a minimal directional icon and optional score.
Show Grade on Signal Labels controls A+, A, or B display.
Show Score on Signal Labels controls the 0–100 score display.
All dynamic label text uses bold and italic formatting.
Independent size controls are available for:
• sweep labels
• BUY / SELL signal labels
• TP / SL result labels
• confirmed pivot triangle markers
━━━━━━━━━━━━━━━━━━━━━━
📍 SWING LEVEL DISPLAY MODES
━━━━━━━━━━━━━━━━━━━━━━
The indicator includes several level-display modes.
All Active
Displays eligible Fresh, Armed, Swept, and Reclaimed swing levels according to the active color and line-style rules.
Armed + Events
Focuses on Armed, Swept, and Reclaimed levels.
Events Only
Shows levels primarily when a sweep or reclaim event has occurred.
Hidden
Keeps the level engine active while removing swing-level lines from the chart.
Level Line Style provides:
Adaptive
Changes the line appearance according to level state.
Solid
Uses solid lines.
Dashed
Uses dashed lines.
Dotted
Uses dotted lines.
Show Swing-High Levels and Show Swing-Low Levels can independently control each side.
Fade Older Levels can reduce the opacity of older stored levels.
Level Width controls line thickness.
The display mode affects chart presentation only.
It does not change the underlying sweep and reclaim calculations.
━━━━━━━━━━━━━━━━━━━━━━
🧹 LEVEL INVALIDATION
━━━━━━━━━━━━━━━━━━━━━━
Stored levels do not remain eligible forever.
A level can be removed or retired because:
• it exceeds Maximum Level Age
• a confirmed breakout exceeds the allowed invalidation distance
• its sweep state exceeds the active timeout
• it completes its reclaimed hold period
• its first penetration is rejected while First Penetration Only is active
• it is consumed after failing a final execution filter
• the maximum active-level capacity removes an older level
Breakout Invalidation uses ATR-normalized distance.
This helps distinguish a controlled sweep from a confirmed close that travels too far beyond an unswept level.
Sweep State Timeout limits how long a Swept level can wait for reclaim.
Reclaimed Level Hold Bars controls how long the line remains highlighted after a successful reclaim.
Consume Filtered Reclaims determines whether a reclaim candidate rejected by direction, bias, market, cooldown, cluster, or conflict rules is permanently retired.
Removing stale or invalid levels helps reduce repeated signals from outdated price references.
━━━━━━━━━━━━━━━━━━━━━━
📟 DASHBOARD
━━━━━━━━━━━━━━━━━━━━━━
The script includes a dashboard positioned in the bottom-right corner.
Dashboard modes include:
Full
Displays the broadest engine diagnostics.
Compact
Shows a reduced selection of important engine and trade information.
Trade Only
Focuses on the active trade lifecycle.
Off
Hides the dashboard.
The Full dashboard can display:
• active swing and reclaim configuration
• quality-filter mode
• Fresh, Armed, Swept, and Reclaimed level counts
• last sweep side
• last sweep type
• sweep depth
• last reclaim signal
• reclaim delay
• close location
• candle-body strength
• setup grade
• setup-quality score
• quality-component information
• selected candidate mode
• signal direction
• cooldown state
• trend-bias state
• market state
• active level
• latest block reason
• trade state
• Entry
• Stop
• Target
• risk distance
• selected RR
• total visual models
• wins and losses
• internal net R
• last model result
• current and best internal streaks
The dashboard is not TradingView Strategy Tester.
Its trade counters are based on the indicator’s own educational bar-based model.
They do not include spread, commission, slippage, latency, or real broker execution.
━━━━━━━━━━━━━━━━━━━━━━
🚨 ALERT SYSTEM
━━━━━━━━━━━━━━━━━━━━━━
Sweep Reclaim Entry Engine includes static TradingView alert conditions for:
• Swing High Swept
• Swing Low Swept
• Any Swing Sweep
• BUY Reclaim Confirmed
• SELL Reclaim Confirmed
• Any Reclaim Signal
• A+ Sweep Reclaim
• A Sweep Reclaim
• B Sweep Reclaim
• Sweep Reclaim Trade Opened
• Sweep Reclaim TP Hit
• Sweep Reclaim SL Hit
The script also includes optional dynamic alert() messages.
Dynamic messages can include:
• direction
• symbol
• timeframe
• grade
• quality score
• reclaimed level
• signal close
• Entry
• Stop Loss
• TP
• RR
• stop mode
• final model result
Dynamic Signal Alerts: A+ Only can restrict dynamic final-signal alerts to A+ setups.
Alert filtering affects alert delivery only.
It does not change chart calculations.
Alerts are monitoring tools.
They do not execute trades or place broker orders.
━━━━━━━━━━━━━━━━━━━━━━
🔔 HOW TO USE ALERTS
━━━━━━━━━━━━━━━━━━━━━━
A practical alert workflow:
1. Add Sweep Reclaim Entry Engine to the chart.
2. Select the desired swing, sweep, reclaim, quality, bias, and trade-model settings.
3. Open TradingView’s Create Alert window.
4. Select the indicator as the alert condition.
5. Choose the required static condition.
6. Use BUY Reclaim Confirmed or SELL Reclaim Confirmed for direction-specific signals.
7. Use Any Reclaim Signal for either direction.
8. Use A+, A, or B conditions when grade-specific monitoring is needed.
9. Enable Dynamic alert() Messages when detailed runtime messages are preferred.
10. Select Any alert() function call for dynamic messages.
11. Choose an alert frequency suitable for confirmed-candle monitoring.
12. Test the alert before depending on it.
13. Confirm every event with personal analysis and risk management.
Alert delivery can depend on:
• TradingView servers
• the user’s alert settings
• symbol data availability
• chart timeframe
• realtime feed status
• webhook destination availability
The indicator cannot guarantee alert delivery or external execution.
━━━━━━━━━━━━━━━━━━━━━━
🧪 HOW TO USE THE INDICATOR
━━━━━━━━━━━━━━━━━━━━━━
A practical workflow:
1. Add Sweep Reclaim Entry Engine to a standard candlestick chart.
2. Begin with the default Structural swing mode.
3. Keep Reclaim Strength Mode on Strict while learning the engine.
4. Keep Quality Filter Mode on Strict when a selective default is preferred.
5. Confirm that the selected higher timeframe is above the chart timeframe.
6. Observe the stored swing-high and swing-low levels.
7. Watch for a level to move from Fresh to Armed.
8. Review whether the penetration appears controlled rather than excessively deep.
9. Wait for the reclaim candle to close.
10. Review the BUY or SELL label, grade, and quality score.
11. Check the bottom-right dashboard for bias, market state, block reason, and active trade.
12. Treat Entry, SL, and TP as visual references only.
13. Compare the setup with personal structure, liquidity, session, volatility, and risk rules.
14. Use alerts for monitoring rather than blind execution.
15. Test the exact symbol, timeframe, session, and settings personally used.
16. Review historical TP models and concise CLOSED SL HIT labels to understand the visual lifecycle.
The indicator is best used as a structured sweep-reclaim review tool.
It should not be used as an automatic decision-maker.
━━━━━━━━━━━━━━━━━━━━━━
⚙️ SETTINGS REFERENCE
━━━━━━━━━━━━━━━━━━━━━━
⚙️ Core Swing Engine
Swing Mode
Selects Reactive, Balanced, Structural, or Custom.
Custom Left Bars
Controls left-side pivot sensitivity in Custom mode.
Custom Right Bars
Controls right-side pivot confirmation in Custom mode.
ATR Length
Controls ATR normalization throughout the engine.
━━━━━━━━━━━━━━━━━━━━━━
📍 Level Management
Maximum Active Levels Per Side
Limits stored swing highs and lows separately.
Maximum Level Age
Removes old inactive levels.
Level Merge Tolerance — ATR
Prevents near-duplicate swing levels.
Armed Distance — ATR
Controls how close price must move before a Fresh level becomes Armed.
Breakout Invalidation — ATR
Controls the confirmed-close distance that invalidates an unswept level.
━━━━━━━━━━━━━━━━━━━━━━
🌊 Sweep Detection
Sweep Penetration Mode
Selects Wick Only, Wick or Body, or Body Required.
Minimum Sweep Depth — ATR
Rejects insignificant penetrations.
Maximum Sweep Depth — ATR
Rejects excessively deep penetrations.
First Penetration Only
Allows only the first interaction attempt.
Multi-Level Sweep Handling
Selects Nearest Valid Level or All Valid Levels.
Block Dual-Side Sweep Bars
Prevents one candle from registering both a high-side and low-side sweep.
Sweep State Timeout
Controls how long a Swept level can wait for reclaim.
━━━━━━━━━━━━━━━━━━━━━━
✅ Reclaim Confirmation
Reclaim Window
Selects Same Candle, Fast, Flexible, or Custom.
Custom Reclaim Bars
Controls the reclaim window in Custom mode.
Reclaim Strength Mode
Selects Loose, Balanced, Strict, or Custom.
Custom Close Buffer — ATR
Controls reclaim distance beyond the level.
Custom Close Location
Controls directional close quality.
Custom Body Strength — ATR
Controls minimum reclaim-candle body size.
Custom Wick Rejection Ratio
Controls same-candle rejection-wick quality.
Require Directional Candle Body
Requires bullish or bearish candle direction.
Require Same-Candle Wick Rejection
Requires the active wick threshold for immediate reclaims.
Block Dual-Side Reclaim Bars
Prevents both directions from confirming on one candle.
Reclaimed Level Hold Bars
Controls how long a reclaimed level remains highlighted.
━━━━━━━━━━━━━━━━━━━━━━
💎 Quality Engine
Quality Filter Mode
Selects Loose, Balanced, Strict, or Custom.
Custom Minimum Quality
Controls the manual minimum from 50 to 100.
Include Relative Volume
Adds the relative-volume component.
Relative Volume Length
Controls the volume baseline.
Volatility Regime Length
Controls the ATR-regime baseline.
Show Grade on Signal Labels
Displays A+, A, or B.
Show Score on Signal Labels
Displays the 0–100 quality score.
━━━━━━━━━━━━━━━━━━━━━━
🎯 Signal Execution
Signal Direction
Selects Both, Long Only, or Short Only.
Candidate Selection
Selects Highest Quality or Nearest Level.
Cooldown Mode
Selects Off, Any Signal, or Same Direction.
Signal Cooldown Bars
Controls the time-based delay.
Use Same-Direction Cluster Filter
Blocks nearby repeated signals.
Minimum Signal Distance — ATR
Controls the required distance from the previous same-direction signal.
Block Duplicate Signal Bar
Prevents repeated final signals on one candle.
Opposite-Signal Conflict
Selects Block Both, Higher Quality, BUY Priority, or SELL Priority.
Consume Filtered Reclaims
Retires reclaim candidates rejected by final execution filters.
━━━━━━━━━━━━━━━━━━━━━━
🧭 Bias & Market Filters
Trend Bias Mode
Selects Off, Chart EMA, Higher Timeframe EMA, or Combined EMA.
Chart EMA Length
Controls current-timeframe trend bias.
Higher Timeframe
Selects the HTF context.
Higher-Timeframe EMA Length
Controls the confirmed HTF EMA.
Require EMA Slope Agreement
Adds directional EMA slope.
Market Condition Filter
Selects Off, Volatility, Efficiency, or Combined.
Efficiency Length
Controls directional-efficiency calculation.
Minimum Efficiency
Controls the required efficiency ratio.
Minimum ATR Regime Ratio
Sets the lower volatility boundary.
Maximum ATR Regime Ratio
Sets the upper volatility boundary.
The default HTF layer uses previous completed higher-timeframe values.
float confirmedHTFClose = request.security(
syminfo.tickerid,
higherTimeframe,
close ,
gaps = barmerge.gaps_off,
lookahead = barmerge.lookahead_on
)
float confirmedHTFEMA = request.security(
syminfo.tickerid,
higherTimeframe,
ta.ema(close, higherTimeframeBiasLength) ,
gaps = barmerge.gaps_off,
lookahead = barmerge.lookahead_on
)
━━━━━━━━━━━━━━━━━━━━━━
📈 Trade Model
Enable Trade Model
Enables Entry, SL, TP, and lifecycle visualization.
Stop-Loss Mode
Selects Entry ATR Multiplier or Sweep Extreme + ATR Buffer.
Sweep-Extreme Buffer — ATR
Controls protective distance beyond the sweep extreme.
Entry ATR Stop Multiplier
Controls ATR stop distance from Entry.
Risk / Reward Target
Controls target distance from 0.25R to 15R.
TP / SL Same-Bar Priority
Selects Stop First or Target First.
Block Signals During Active Trade
Maintains the one-active-model structure.
Allow New Signal on Exit Bar
Controls same-bar reopening.
Show TP / SL Boxes
Shows or hides risk/reward areas.
Show Entry / TP / SL Lines
Shows or hides price-reference lines.
Show Historical Trades
Keeps completed TP models.
Maximum Historical Trades
Limits stored completed visuals.
Show TP / SL Result Labels
Controls TP HIT and CLOSED SL HIT labels.
━━━━━━━━━━━━━━━━━━━━━━
🔔 Alert System
Enable Dynamic alert() Messages
Activates detailed runtime alerts.
Alert Final BUY / SELL Signals
Enables final-signal messages.
Dynamic Signal Alerts: A+ Only
Restricts dynamic signal messages to A+ setups.
Alert Trade Model Open
Sends Entry, SL, TP, RR, grade, and quality.
Alert TP / SL Result
Sends model-result messages.
━━━━━━━━━━━━━━━━━━━━━━
🎨 Visual Settings
Visual Profile
Selects Full, Clean, Minimal, or Mobile.
Level Display
Selects All Active, Armed + Events, Events Only, or Hidden.
Level Line Style
Selects Adaptive, Solid, Dashed, or Dotted.
Signal Label Style
Selects Full, Compact, or Icon.
Dashboard Mode
Selects Full, Compact, Trade Only, or Off.
Active Trade Zone Transparency
Controls TP / SL fill transparency.
Active Trade Border Transparency
Controls TP / SL borders.
Active Trade Line Width
Controls trade-line thickness.
Fade Completed Trades
Fades completed TP models.
Completed Trade Transparency
Controls historical fading.
Theme
Selects Crimson, Ice Blue, or Monochrome.
Show Swing-High Levels
Controls high-side levels.
Show Swing-Low Levels
Controls low-side levels.
Show Important Sweep Labels
Controls sweep-event labels.
Sweep Label Filter
Selects Important Only or All Valid.
Minimum Sweep Importance
Controls visible sweep quality.
Maximum Important Sweep Labels
Limits sweep-label history.
Show BUY / SELL Reclaim Signals
Controls final reclaim labels.
Maximum Reclaim Labels
Limits final signal-label history.
Fade Older Levels
Reduces old-level opacity.
Level Width
Controls swing-level line thickness.
Show Confirmed Pivot Markers
Controls pivot triangles.
Show Dashboard
Enables the dashboard.
━━━━━━━━━━━━━━━━━━━━━━
🛠️ Customization
Sweep Label Size
Controls SWEEP HIGH / SWEEP LOW labels.
Triangle Marker Size
Controls confirmed pivot triangles.
BUY / SELL Signal Label Size
Controls reclaim labels.
TP / SL Result Label Size
Controls result labels.
Dashboard Header Size
Controls dashboard titles.
Dashboard Text Size
Controls dashboard body text.
Color Mode
Selects Theme or Custom.
Custom color inputs control:
• swing-level states
• BUY / SELL backgrounds and text
• sweep-label backgrounds and text
• Entry, TP, and SL lines
• TP / SL fills and borders
• TP / SL result labels
• dashboard background, header, border, main text, and muted text
Input values and plotted marker values are hidden from the status line.
━━━━━━━━━━━━━━━━━━━━━━
🧠 WHAT MAKES THIS SCRIPT ORIGINAL
━━━━━━━━━━━━━━━━━━━━━━
Sweep Reclaim Entry Engine uses familiar analytical concepts such as:
• pivot highs and lows
• liquidity sweeps
• price reclaims
• ATR
• relative volume
• EMA bias
• market efficiency
• risk/reward projection
These concepts are not unique by themselves.
The originality of this script lies in how they are organized into one transparent sweep-reclaim workflow:
Confirmed pivot
→ separate high-side and low-side memories
→ ATR-normalized duplicate control
→ Fresh state
→ Armed state
→ penetration classification
→ minimum and maximum depth validation
→ Swept state
→ configurable reclaim window
→ close, location, body, and wick validation
→ eight-component quality score
→ A+ / A / B grade
→ multi-candidate comparison
→ cooldown, cluster, and conflict handling
→ chart and confirmed HTF EMA alignment
→ optional market-regime filtering
→ one-active-trade model
→ TP-specific historical preservation
→ SL-specific visual cleanup
→ static and dynamic alert delivery
→ bottom-right diagnostic dashboard
Distinctive implementation features include:
• separate lifecycle arrays for swing highs and swing lows
• a defined Armed state before sweep detection
• controlled minimum and maximum penetration depth
• wick/body sweep classification
• first-attempt retirement logic
• sweep-importance scoring separate from setup-quality scoring
• same-candle and multi-bar reclaim support
• transparent quality-component weighting
• Highest Quality and Nearest Level candidate selection
• multiple opposite-conflict resolution modes
• confirmed higher-timeframe EMA data
• ATR-normalized signal clustering
• full chart cleanup after SL
• independent sizing for every label and marker class
• status-line value suppression without hiding chart markers
• configurable targets up to 15R
The script is not a basic collection of unrelated filters.
Each module supports the same swing-sweep-reclaim process.
━━━━━━━━━━━━━━━━━━━━━━
⚠️ IMPORTANT PRACTICAL NOTES
━━━━━━━━━━━━━━━━━━━━━━
The indicator’s behavior depends heavily on settings and market conditions.
Signal frequency can change based on:
• Swing Mode
• pivot lengths
• maximum level age
• merge tolerance
• armed distance
• sweep penetration mode
• minimum and maximum sweep depth
• first-penetration logic
• multi-level selection
• reclaim window
• reclaim strength
• directional candle requirement
• same-candle wick requirement
• quality filter mode
• volume context
• direction restriction
• cooldown
• signal-cluster distance
• opposite-conflict mode
• chart EMA length
• HTF selection
• HTF EMA length
• market-condition filter
• volatility regime
• efficiency threshold
• active-trade restrictions
• symbol
• timeframe
• session
• data provider
• available chart history
A setting that appears selective on one market may behave differently on another.
Volume behavior can differ across forex, futures, equities, indices, and cryptocurrencies.
The higher-timeframe filter should use a timeframe meaningfully above the chart timeframe.
Structural mode confirms fewer and broader pivots than Reactive mode.
Strict reclaim and quality modes reduce signal frequency but do not guarantee better results.
Reactive or Balanced modes can increase frequency but can also increase chart noise.
Users should test the exact market, timeframe, session, and configuration they personally study.
━━━━━━━━━━━━━━━━━━━━━━
⚠️ LIMITATIONS AND SHORTCOMINGS
━━━━━━━━━━━━━━━━━━━━━━
This script has important limitations:
It does not guarantee profitable trades.
It does not predict future price movement.
It does not replace risk management.
It does not execute trades.
It does not place broker orders.
It does not include spread.
It does not include commissions.
It does not include slippage.
It does not include execution delay.
It does not include partial fills.
It uses bar-based OHLC data.
Same-candle TP / SL order cannot be known from standard OHLC bars.
Stop First and Target First are modeling assumptions.
Confirmed pivots require right-side bars before becoming available.
The quality score is not a win probability.
A+ is not a guaranteed outcome.
The dashboard is not TradingView Strategy Tester.
Internal model counters are not audited brokerage performance.
Historical boxes and labels do not guarantee future behavior.
Relative-volume quality depends on available volume data.
Higher-timeframe bias depends on the selected timeframe.
Market-efficiency filtering cannot identify every ranging condition.
ATR normalization does not make one configuration universal.
One-active-trade logic is a visual-management rule.
Data-feed differences can change historical pivots and signals.
Alert delivery depends on TradingView and user configuration.
Changing settings changes historical calculations.
Changing symbol, session, exchange, or timeframe changes the engine context.
For these reasons, Sweep Reclaim Entry Engine should be used as an educational decision-support and chart-analysis tool, not as a standalone automated strategy.
━━━━━━━━━━━━━━━━━━━━━━
👤 WHO THIS SCRIPT MAY BE USEFUL FOR
━━━━━━━━━━━━━━━━━━━━━━
This script may be useful for traders who:
• study liquidity sweeps
• monitor confirmed swing highs and lows
• distinguish a sweep from a reclaim
• prefer filtered signals instead of every wick event
• want a visible level lifecycle
• want ATR-normalized penetration thresholds
• want same-candle and multi-bar reclaim support
• want a transparent 0–100 quality framework
• want A+, A, and B setup grades
• want chart and confirmed HTF EMA context
• want optional market-regime filtering
• want Entry, SL, and TP visualization
• want one active model at a time
• want clean SL result handling
• want adjustable mobile and desktop presentation
• want alert-based monitoring
• want a structured educational analysis process
It may be less suitable for users who:
• want guaranteed buy/sell signals
• want a fully automated trading bot
• want every wick beyond every high or low
• expect the quality score to represent probability
• expect one configuration to work on every market
• require exact tick-level execution simulation
• expect displayed levels to match broker fills
• want an indicator to replace independent judgment
• expect alerts to execute orders automatically
━━━━━━━━━━━━━━━━━━━━━━
🧭 BEST PRACTICE SUGGESTIONS
━━━━━━━━━━━━━━━━━━━━━━
For a cleaner and more selective review:
• begin with Structural swing mode
• keep First Penetration Only enabled
• use Nearest Valid Level or Highest Quality according to preference
• keep Strict reclaim strength
• keep Strict quality filtering
• use Combined EMA bias
• select a valid higher timeframe
• use Same Direction cooldown
• keep the same-direction cluster filter enabled
• use Stop First for conservative same-candle modeling
• use Important Only sweep labels
• use Clean visual profile
• keep the dashboard in Compact or Full mode while learning
• use alerts for monitoring, not blind execution
For more active signal frequency:
• use Balanced or Reactive swing mode
• use Balanced reclaim strength
• use Balanced quality filtering
• reduce cooldown
• reduce minimum signal distance
• use Chart EMA or disable trend bias
• keep the hard market filter Off
• use All Valid sweep labels only when additional chart detail is useful
Always:
• review the structural level before the sweep
• confirm the reclaim candle has closed
• verify the setup fits personal market context
• compare the stop with nearby structure and volatility
• treat TP as a planning reference
• test the exact symbol and timeframe
• apply independent risk management and position sizing
━━━━━━━━━━━━━━━━━━━━━━
🔓 PUBLICATION NOTE
━━━━━━━━━━━━━━━━━━━━━━
Sweep Reclaim Entry Engine is published as an educational and visual market-analysis tool.
The purpose of this description is to explain:
• what the script does
• how swing points are confirmed
• how levels are stored and managed
• how Fresh, Armed, Swept, Reclaimed, and Consumed states work
• how penetration type is classified
• how minimum and maximum sweep depth work
• how reclaim timing works
• how reclaim strength is evaluated
• how the 0–100 quality score is calculated
• how A+, A, and B grades are assigned
• how candidates are selected
• how cooldown and clustering operate
• how opposite-direction conflicts are handled
• how chart and confirmed HTF bias work
• how market-condition filters operate
• how Entry and Stop Loss are calculated
• how the RR target is projected
• how one-active-trade logic works
• how same-candle ambiguity is handled
• how active and completed visuals behave
• how SL-specific cleanup works
• what the dashboard displays
• what static and dynamic alerts do
• what the timing limitations are
• what the script’s limitations are
• why the implementation is original
The script is designed to support structured analysis.
It does not promise profitable results.
It does not remove market risk.
It does not execute trades.
It should not be used as a blind buy/sell system.
MAIN CHART SCREENSHOT PLAN
Use one clean standard candlestick chart.
Show the indicator with its default settings.
The screenshot should contain:
• one clearly visible confirmed swing level
• one visible SWEEP HIGH or SWEEP LOW event
• one BUY RECLAIM or SELL RECLAIM label
• one active Entry / TP / SL model
• the thick white Entry line
• the blue/cyan TP area
• the red SL area
• the bottom-right dashboard
• the symbol and timeframe
• the indicator title in the status line
Do not include:
• other indicators
• manual drawings
• unrelated labels
• social links
• promotional text
• performance claims
• account-profit screenshots
• non-standard candles
• excessive zoom
• hidden price candles
The screenshot should demonstrate the script’s normal default behavior and make the swing, sweep, reclaim, risk model, and dashboard easy to understand.
━━━━━━━━━━━━━━━━━━━━━━
🛡️ DISCLAIMER
━━━━━━━━━━━━━━━━━━━━━━
Sweep Reclaim Entry Engine is provided for educational and informational purposes only.
It does not constitute financial, investment, trading, legal, or tax advice.
No indicator can guarantee future results.
Markets are uncertain, liquidity conditions change, volatility changes, and historical chart behavior does not ensure future performance.
Every user is responsible for their own:
• analysis
• validation
• risk management
• position sizing
• alert configuration
• trading decisions
• broker execution
• legal and tax obligations
The confirmed swing levels, lifecycle states, sweep labels, reclaim labels, quality scores, setup grades, bias states, market-condition states, Entry references, stop-loss levels, take-profit targets, TP / SL boxes, result labels, dashboard values, internal model counters, and alerts are visual analysis tools only.
The displayed Entry is not a guaranteed fill.
The displayed Stop Loss is not a broker order.
The displayed target is not a guaranteed objective.
The 0–100 quality score is not a win probability.
The A+, A, and B grades are not promises of performance.
The internal trade model does not include spread, commissions, slippage, latency, order-book conditions, or partial fills.
Use this script as a structured sweep-reclaim review and decision-support framework, not as a promise of profitability or a substitute for independent judgment.
Indicateur
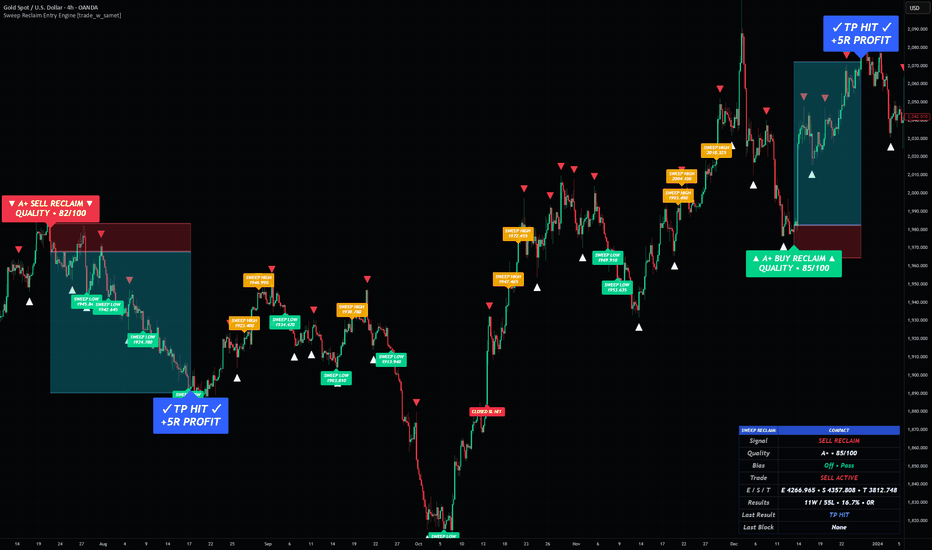
RIFTS Tap & Break Sniper [NICK789]
RIFTS Tap & Break Sniper
The RIFTS Tap & Break Sniper indicator is built around one core price-action idea:
Price creates or leaves behind a reaction zone, later returns to tap or reject from that zone, and then confirms direction by printing a BOS or CHoCH.
RIFTS stands for:
**R** — Reaction Zones
**I** — Imbalance Gaps
**F** — Flip / Structure Confirmation
**T** — Tap & Break Logic
**S** — Sniper Scoring
Together, these describe the full process used by the script: price creates or leaves behind a zone, returns to tap or reject from it, then confirms direction through BOS or CHoCH before the setup is scored and plotted as a Sniper or Sniper+ signal.
The script is designed to help traders identify tap-and-break structures where a zone reaction and a market-structure break occur together. Instead of showing zones by themselves or structure breaks by themselves, RIFTS connects both steps into one workflow:
1. Price creates a Reaction Block or Imbalance Gap.
2. Price returns to tap the zone.
3. Price rejects from the zone.
4. Price confirms direction with BOS or CHoCH.
5. The script scores the setup and plots a Sniper or Sniper+ signal.
🔶 USAGE
RIFTS identifies two main zone types:
Reaction Blocks
Imbalance Gaps
A setup begins when price creates one of these zones. The script then watches for price to return to the zone and either tap or reject from it.
A bullish setup develops when price interacts with a bullish zone and then confirms upward movement through a bullish structure break.
A bearish setup develops when price interacts with a bearish zone and then confirms downward movement through a bearish structure break.
The signal is not based on the zone alone. The main purpose is to find moments where zone interaction and structure confirmation align.
🔹 Reaction Blocks
Reaction Blocks are candle-based zones created after price displaces away from the previous candle.
A bullish Reaction Block forms when a bullish candle closes above the previous candle’s high while the previous candle was bearish.
A bearish Reaction Block forms when a bearish candle closes below the previous candle’s low while the previous candle was bullish.
The script marks the previous candle range as the reaction area. This area becomes important if price later returns to it and reacts.
The Zone Candle Body % setting controls how strong the displacement candle must be before a Reaction Block is created. Higher values require stronger candle bodies and reduce weaker zones.
🔹 Imbalance Gaps
Imbalance Gaps are created when price moves quickly and leaves an untraded gap between the current candle and the candle two bars back.
A bullish Imbalance Gap forms when the current low is above the high from two candles ago.
A bearish Imbalance Gap forms when the current high is below the low from two candles ago.
These gaps represent fast price movement. If price later returns to the gap, the script monitors whether price reacts from that area and then breaks structure.
🔹 Tap and Reaction Logic
After a Reaction Block or Imbalance Gap is created, the script tracks whether price comes back into the zone.
A zone is considered tapped when price trades back inside the zone.
A bullish reaction occurs when price taps a bullish zone and then closes upward out of that zone.
A bearish reaction occurs when price taps a bearish zone and then closes downward out of that zone.
The reaction candle must pass the selected quality filters:
Reject Body %
Reject Range ATR
These filters help avoid weak touches where price enters a zone but does not show enough rejection strength.
🔹 BOS and CHoCH Confirmation
The script tracks swing highs and swing lows using the Structure Swing Length setting.
When price closes above the last confirmed swing high, the script detects a bullish structure break.
When price closes below the last confirmed swing low, the script detects a bearish structure break.
The structure break is classified as either BOS or CHoCH.
BOS means Break of Structure. It represents continuation in the current structure direction.
CHoCH means Change of Character. It represents a break against the previous market bias and may suggest a possible directional shift.
CHoCH and BOS lines are drawn on the chart so users can see exactly which structure level was broken.
🔶 SIGNAL MODES
The Sniper Confirmation setting controls how strict the setup must be before a signal appears.
Reaction Only
A signal can appear when price reacts from a valid zone. This is the fastest mode because it does not require a BOS or CHoCH confirmation.
Tap + Structure
A signal requires price to tap a valid zone and then break structure in the signal direction.
Reaction + Structure
A signal requires both a valid zone reaction and a BOS or CHoCH confirmation. This mode is designed for traders who want zone rejection and structure confirmation together.
🔹 Structure Trigger Type
The Structure Trigger Type setting controls which structure events can trigger signals.
Both
Allows both BOS and CHoCH.
CHoCH Only
Only allows change-of-character signals.
BOS Only
Only allows break-of-structure signals.
This lets traders focus on reversal-style setups, continuation-style setups, or both.
🔶 SNIPER SCORE
Each setup receives a score based on the conditions that are present.
The score can include:
Zone tap or zone reaction
BOS or CHoCH confirmation
Fresh reaction timing
Optional volume confirmation
Optional EMA trend confirmation
A Sniper signal appears when the setup reaches the minimum score threshold.
A Sniper+ signal appears when the setup reaches the higher Sniper+ threshold.
The score is a confluence model. It does not predict guaranteed profit. It simply shows how many of the script’s conditions are aligned.
🔹 Volume Filter
When enabled, the Volume Filter requires current volume to be above a selected moving average multiplier.
Volume MA Length controls the volume average.
Volume Multiplier controls how much stronger current volume must be compared with the average.
This filter can help reduce signals during weaker volume conditions.
🔹 EMA Trend Filter
When enabled, the EMA Trend Filter checks whether price is on the correct side of the selected EMA.
Bullish signals require price to be above the EMA.
Bearish signals require price to be below the EMA.
This filter is optional and can be used when traders want signals to align with broader trend direction.
🔶 TRADE PLAN GUIDE
When a Sniper or Sniper+ signal appears, the script can draw a simple trade plan guide.
Entry is based on the signal candle close.
Stop loss is placed beyond the reaction zone with an optional ATR buffer.
TP1, TP2, and TP3 are calculated using the selected R multiples.
The trade plan is only a visual guide. It does not place trades, manage trades, or act as a strategy tester.
🔶 VISUAL DISPLAY
The script can display:
Bullish and bearish Reaction Blocks
Bullish and bearish Imbalance Gaps
CHoCH and BOS structure lines
Sniper and Sniper+ markers
Latest Entry / SL / TP guide
Master alert and separate bull/bear alert conditions
Used zones and overlapping same-side zones are visually cleaned up to keep the chart easier to read.
🔶 SETTINGS
Core Zones
Show Zones
Toggles the display of Reaction Blocks and Imbalance Gaps.
Reaction Blocks
Enables or disables Reaction Block detection.
Imbalance Gaps
Enables or disables Imbalance Gap detection.
Hide Broken Zones
Removes invalidated zones from the chart.
Max Stored Zones
Controls how many zones are stored and tracked.
Zone Candle Body %
Sets the minimum candle body percentage required to create a zone.
Sniper Logic
Sniper Confirmation
Chooses Reaction Only, Tap + Structure, or Reaction + Structure.
Structure Swing Length
Controls the swing pivot length used for BOS and CHoCH detection.
Structure Trigger Type
Chooses whether BOS, CHoCH, or both can trigger signals.
Reaction Valid Bars
Controls how long a zone reaction remains valid for confirmation.
Confirm Signal On Candle Close
When enabled, signals only appear after the candle closes.
Quality Filters
ATR Length
Controls the ATR used for rejection and stop-buffer calculations.
Reject Body %
Sets the minimum body size required for a valid rejection candle.
Reject Range ATR
Sets the minimum candle range relative to ATR for rejection quality.
Require Break Displacement
Requires BOS/CHoCH candles to pass body and ATR strength filters.
Break Body %
Sets the minimum body size required for a valid structure break.
Break Range ATR
Sets the minimum candle range relative to ATR for a valid structure break.
Score Filters
Use Volume Filter
Requires volume confirmation before allowing signals.
Volume MA Length
Controls the moving average used for volume comparison.
Volume Multiplier
Controls how strong current volume must be compared with its average.
Use EMA Trend Filter
Requires signals to align with the EMA trend filter.
EMA Trend Length
Controls the EMA used for trend filtering.
Show Sniper+ Only
Hides normal Sniper signals and only shows Sniper+ signals.
Min Sniper Score
Minimum score required for a normal Sniper signal.
Sniper+ Score
Minimum score required for a Sniper+ signal.
Visuals
Show CHoCH/BOS Lines
Toggles structure lines on the chart.
Max Structure Lines
Controls how many structure lines remain visible.
Show Latest Entry / SL / TP
Toggles the trade plan guide.
RR Lines Bars Ahead
Controls how far the trade plan guide extends to the right.
TP1 R, TP2 R, TP3 R
Controls the risk-multiple targets.
SL ATR Buffer
Adds an ATR-based buffer beyond the reaction zone for the stop guide.
Alerts
The script includes alert conditions for:
Master Sniper signal
Bull Sniper
Bear Sniper
Bull Sniper+
Bear Sniper+
A dynamic master alert option is also available for traders who want alert messages that include symbol, timeframe, close price, and score.
🔶 HOW TO READ THE SIGNALS
A bullish Sniper signal means price has interacted with a bullish zone and passed the selected confirmation rules.
A bearish Sniper signal means price has interacted with a bearish zone and passed the selected confirmation rules.
A Sniper+ signal means the setup reached the higher score threshold.
BOS labels can help identify continuation-style structure breaks.
CHoCH labels can help identify possible shift or reversal-style structure breaks.
The Entry / SL / TP guide is only for planning and should be adjusted to each trader’s own risk management.
🔶 IMPORTANT NOTES
This script is a confluence and visualization tool. It does not guarantee future price movement.
Signals are based on reaction zones, zone taps, rejection candles, and BOS/CHoCH structure breaks.
Swing structure requires confirmed pivots, so BOS and CHoCH lines appear only after the selected swing length confirms the structure point.
Lower timeframes may produce more frequent signals and more noise.
Higher timeframes may produce fewer but cleaner structure events.
Best results usually come from combining the script with higher timeframe context, market session awareness, and proper risk control.
Indicateur

Rolling Dual Value AreaRolling Dual Value Area (68.2% / 95.4%)
WHAT IT DOES
Builds a rolling volume profile over a trailing window of the last N bars and
draws two nested value areas around the Point of Control (POC):
- Inner area: 68.2% of the window's volume by default
- Outer area: 95.4% of the window's volume by default
The POC is plotted as a single line; the inner and outer Value Area High/Low
boundaries are drawn as two nested bands. Because the profile is recomputed on
every bar, the POC, VAH and VAL appear as continuous trajectories rather than a
single static profile.
WHY 68.2% AND 95.4%
The conventional Market Profile value area uses 70%, which is a rounding of
68.2% - the share of a normal distribution within +/-1 standard deviation.
95.4% is the +/-2 standard deviation share. These two thresholds give a "1
sigma" inner zone and a "2 sigma" outer zone expressed as volume coverage. Both
are inputs, so you can set them back to 70/95 or to any values you prefer.
Important: this is a coverage-threshold band, not a parametric standard-
deviation band. It is centered on the mode (the POC) and expands toward the
heavier side, so it is generally asymmetric and reflects the actual shape of the
distribution. This is a different object from a VWAP standard-deviation band,
which is centered on the volume-weighted mean and is symmetric. The two coincide
only when the distribution is close to normal.
HOW IT IS CALCULATED
1. The high-low range of the last N bars is divided into equal price bins.
2. Each bar's volume is spread evenly across the bins its high-low range covers.
3. The bin with the most volume is the POC.
4. Starting from the POC, the area expands one bin at a time toward the adjacent
side holding more volume (classic asymmetric, greedy Market Profile
expansion). A single continuous expansion records the inner boundaries when
cumulative volume first reaches the inner target, then continues to the outer
target, so the outer area always contains the inner area and both follow one
expansion path.
Note: expansion advances one bin per step. The original CBOT method compares
pairs of bins per step; results are nearly identical and may differ by a bin in
edge cases. Because volume is added in discrete bins, the captured coverage
lands at or slightly above the chosen percentage.
HOW TO USE
- The bands mark where trading has concentrated over the lookback. Inner-band
edges often act as nearer support/resistance; the outer band marks
statistically extended zones.
- The POC is the heaviest-traded price in the window and tends to act as a
magnet.
- Watching Indicateur

Rejection Block Matrix [ZOM]Rejection Block Matrix maps supply and demand rejection blocks from failed swing sweeps and confirmed pivot wick rejection.
What it shows:
- Demand and supply blocks built from wick/body rejection structure
- Failed high/low sweep blocks for tape-reading style reversal context
- Tested and broken block state tracking, with broken context hidden by default to reduce clutter
- Reclaim/rejection marks when price retests a live block
- A compact dashboard showing visible demand/supply blocks, tested count, latest source, bias, and quality
How I use it:
The blocks are structure zones, not automatic entries. I use them to see where price rejected prior liquidity, then watch how later candles behave when they revisit those blocks. It is especially useful on liquid intraday markets such as ES, NQ, crypto, and major FX pairs.
Open-source script. Educational tool only; not financial advice. Indicateur

Liquidity Void Zone Map [ZOM]Liquidity Void Zone Map is a clean imbalance and fair-value-gap style zone mapper built to highlight where displacement left thin liquidity behind.
What it shows:
- Bull and bear liquidity void bands built from three-candle imbalance geometry
- Capped zone height so the bands stay readable instead of becoming huge slabs
- Active, tapped, and broken-state tracking
- Reclaim/rejection retest marks when price revisits a void with directional confirmation
- A compact dashboard showing active bull/bear zones, tapped count, broken count, state, and best quality score
How I use it:
The bands are context, not standalone entries. I look for price to return into a void, then watch the reclaim/rejection behavior around the band while considering trend, volatility, and broader market structure. It is designed for ES/NQ/crypto/forex intraday structure reads, but it can be adapted to other liquid markets.
Open-source script. Educational tool only; not financial advice. Indicateur

Power Order Blocks [ChartPrime]🔶 OVERVIEW
Power Order Blocks is an advanced structural detection engine designed to identify high-probability supply and demand zones. Unlike standard order block indicators, this tool focuses on "Power" — the intensity of the displacement following the block's formation, combined with a live information panel, equilibrium mapping, and touch tracking built directly into each zone.
It identifies the specific candle where institutional participants likely placed large orders, marks the resulting price inefficiency, and tracks these zones in real time until they are either mitigated or invalidated.
🔶 CORE CONCEPT — THE DISPLACEMENT VALIDATOR
The foundation of a "Power" Order Block is the displacement that follows it. For a zone to be considered valid, the market must move away from it with significant force.
The script uses a Displacement Multiplier to ensure quality:
• It compares the size of the engulfing candle to the previous candle's range.
• If the breakout candle isn't large enough relative to the setup candle, the zone is ignored.
• This filters out low-conviction market noise and focuses on areas of true institutional sponsorship.
🔶 THE POWER RATING SYSTEM
Every detected block is assigned a "Power" percentage. This rating provides immediate context regarding the strength of the move that created the zone.
• Calculation: The indicator compares the current displacement candle against the largest candle observed over a 100-bar lookback .
• Meaning: A 100% Power rating indicates the strongest displacement seen in recent history, suggesting a massive imbalance between buyers and sellers.
• Visual Intensity: When Power Intensity is enabled, the fill color of each block becomes more vivid as its Power % increases. High-power zones are immediately visible at a glance — weaker zones fade into the background naturally.
This allows traders to prioritize "High Power" zones, which typically offer more significant structural support or resistance.
🔶 DYNAMIC ZONE MANAGEMENT
The indicator manages zones dynamically to keep the chart clean and relevant:
Bullish Order Blocks (Demand): Formed when a bearish candle is followed by a high-displacement bullish candle. The zone is invalidated if price closes below the bottom of the block.
Bearish Order Blocks (Supply): Formed when a bullish candle is followed by a high-displacement bearish candle. The zone is invalidated if price closes above the top of the block.
Overlapping Cleanup: If a new order block forms that significantly overlaps an existing one, the script automatically removes the older, redundant zone to prevent clutter.
Block Limit: A maximum of 10 active blocks per side are tracked at any time, ensuring chart performance remains clean.
🔶 THE INFO PANEL
Each active Order Block renders a dedicated Info Panel — a secondary box that floats at the right edge of the zone and updates in real time.
The panel displays:
• Zone Direction: "Bullish OB" or "Bearish OB"
• Power %: The relative displacement strength at the time of formation
• Touch Counter: How many times price has tapped the zone boundary without breaking it
The touch counter is particularly valuable — a zone that has been tested multiple times without breaking demonstrates strong institutional defense and may represent a higher-conviction setup.
🔶 EQUILIBRIUM LINE
When Show Equilibrium Line is enabled, a line is drawn at the exact midpoint (50% level) of each Order Block.
• This level represents the theoretical "fair value" within the zone.
• Price often reacts precisely at the equilibrium before continuing in the original direction.
• It provides a refined entry reference within a wider zone, improving risk-to-reward on entries.
🔶 RETEST SIGNALS (MITIGATION)
When Show Retest Labels is enabled, the script monitors active zones for price interaction.
• If price returns to touch the boundary of a Bullish OB without breaking it, an upward arrow ⇡ appears below the bar.
• If price returns to touch the boundary of a Bearish OB without breaking it, a downward arrow ⇣ appears above the bar.
• A minimum 10-bar cooldown between signals prevents label spam on extended zone interactions.
• Each confirmed retest also increments the Touch Counter inside the Info Panel.
🔶 VISUAL ELEMENTS
Main OB Body: A filled rectangle spanning the order block's price range, extending forward in time. Fill intensity reflects the Power % when Power Intensity is enabled.
Info Panel: A secondary box at the right edge of each zone displaying Power % and Touch Count, updated live.
Equilibrium Line: A midpoint line inside each block marking the 50% level of the zone.
Retest Arrows: Clean arrow labels (⇡ / ⇣) marking the first tap into an active zone.
Color Coding: Fully customizable colors for Bullish (Demand) and Bearish (Supply) zones.
🔶 HOW TO USE
Entry Zones: Wait for price to return to a high-power zone. The Retest Arrow confirms the touch. Consider entries near the equilibrium line for tighter stops.
Zone Prioritization: Use the Power % to filter setups. Zones rated 70%+ represent the strongest institutional imbalances and are generally more reliable.
Touch Count Context: A zone with 0 touches is fresh and untested — typically the highest probability. Zones with multiple touches may be weakening.
Trend Confirmation: In a healthy trend, the market should consistently create and respect Power Order Blocks in the direction of the trend.
Stop Loss Placement: Order blocks provide logical structural levels for stops — just below a Bullish OB bottom or above a Bearish OB top.
Confluence: Combine the Power Rating, Equilibrium Line, and Touch Count together for the highest-quality setups.
🔶 SETTINGS REFERENCE
Displacement Multiplier: Controls how aggressive the displacement filter is. Higher values require a stronger engulfing move to validate a zone.
Bullish / Bearish OB Color: Set the fill color for each zone type.
Text Color: Controls the color of text inside the Info Panel.
Show Equilibrium Line: Toggles the midpoint line inside each block.
Power Intensity: When enabled, fill transparency scales with Power % — stronger zones appear more vivid.
Show Retest Labels: Toggles the ⇡ / ⇣ arrow labels on zone interactions.
🔶 CONCLUSION
Power Order Blocks provides a systematic way to map institutional footprint on the chart. By combining strict displacement validation with a relative power rating, live info panels, equilibrium mapping, and touch tracking, it transforms raw price action into a clear and actionable map of supply and demand imbalances — allowing traders to trade alongside the strongest market moves with precision and confidence. Indicateur

Level Range Scanner-WatchlistLevel Range Scanner — Watchlist
See how price is progressing toward your key levels across an entire watchlist at a glance. No more flipping between 18 charts wondering how much further a stock has to go before it tags premarket or prior-day levels — this scanner draws a live progress bar for every level on every symbol, so you can instantly see what's coiled and about to break.
WHAT IT DOES
Track up to 20 symbols in a single on-chart table. For each ticker it monitors four critical intraday levels and shows you, with a filling progress bar, exactly how close price is to breaking each one:
- PDH — Previous Day High
- PDL — Previous Day Low
- PMH — Premarket High
- PML — Premarket Low
When price has room to run, you see a partially filled bar (more fill = closer to the level). The moment a level breaks, the bar flips to a green dot (high broken) or red dot (low broken) so confirmed breaks jump out instantly.
HOW TO USE IT
1. Add the indicator to any intraday chart (1m–15m works best — it needs intraday data for premarket levels).
2. Open settings and type your tickers into Symbol 01–20. Leave slots blank to hide them.
3. Watch the table. Bars filling toward the top of a range = building pressure toward a breakout; bars filling toward the bottom = pressure toward a breakdown.
4. Set an alert (see below) and let it watch the list for you.
READING THE COLUMNS
- Ticker / Price / Volume — Symbol, last price, and accumulated session volume (auto-formatted K/M/B).
- % Change — Move vs. the prior close — green up, red down.
- PDH / PDL Break — Progress bar from the opposite level toward the prior-day high/low. Green/red dot on break.
- PMH / PML Break — Same idea, for the premarket high/low.
- Trend — Up arrow = price broke BOTH PDH and PMH (bullish trend established). Down arrow = broke BOTH PDL and PML (bearish). Warning icon = mixed / not yet confirmed.
The Trend column is the headline signal: an up or down arrow means a symbol has cleared both its daily AND premarket level in the same direction — a higher-conviction continuation setup than a single-level poke.
ALERTS
Use "LE Scanner Triggered." It fires whenever any watched symbol breaks both its premarket and prior-day level in the same direction (i.e. flips to an up or down arrow). Add it once and the scanner watches all 20 names for you in the background.
SETTINGS
- Table Size / Position — fit it anywhere on your layout.
- Show Empty Rows — keep or hide blank symbol slots.
NOTES
- Levels are calculated using extended-hours data (premarket/after-hours included), so PDH/PDL reflect the full trading day, not regular session only.
- Requires an intraday timeframe for the premarket columns to populate.
- Best on liquid stocks/ETFs where premarket and prior-day levels carry weight.
Indicateur

Dealer Pin Release Map [ZOM]Dealer Pin Release Map is an intraday dealer-magnet model for traders who want a cleaner read on pinning, fade pressure, and volatility release around synthetic strike levels.
The script estimates the nearest live magnet from a configurable strike step, then scores pin pressure using price proximity, ATR compression, relative participation, and synthetic delta pressure. When price compresses around the magnet, the tool highlights the active pin. When price rejects the pin edge or expands away from a prior pin state, it marks potential fade or release conditions.
What it shows:
- Live pin magnet: the current strike-style level price is clustering around.
- Release rails: upside/downside levels where a pinned auction can begin to unwind.
- Pin Fade signals: wick and delta-confirmed rejection from the pin edge.
- Gamma Release alerts: expansion signals after prior pin pressure, relative volume, and directional delta confirm.
- Dashboard: current state, magnet, pin score, release energy, relative volume, and delta pressure.
This is intentionally not a traditional moving-average or support/resistance indicator. It is built to frame the auction as a dealer-style pin/release map, especially on liquid futures and index products where round-number and strike-style magnets can matter.
Notes:
- The model uses proxy calculations from price, volume, ATR, and candle location. It does not read live options open interest or broker order flow.
- Best used with liquid symbols and sensible strike steps, such as 25 or 50 points on major equity index futures.
- Signals are contextual. Use the rails and dashboard as a map, not as standalone financial advice.
Indicateur

Iceberg Detector [JOAT]ICEBERG DETECTOR
A hidden-liquidity detector that infers iceberg orders from their footprint on the tape — without needing direct L2 data. The detection pattern is well-known to professional tape readers: the same price level being repeatedly tested by long wicks, with above-average volume, and price each time getting rejected back in the opposite direction. That repeated-rejection pattern is the visible signature of an iceberg — a large resting order broken into smaller slices to hide its true size. This script catches the pattern, clusters the tests, paints the zone, and tells you when the iceberg gets broken or eaten.
Detection — five gates, all required
A bar is a candidate iceberg test only when every one of these is true:
Long wick — wick-to-body ratio above the configurable threshold (default 0.75). The wick is the visible rejection; the body is the failed push.
Local extremum — the wick reached a local high or low over the configurable pivot lookback (default 5 bars). A wick that did not actually probe new territory does not count.
Above-average volume — bar volume must exceed volume average × multiplier (default 1.0×). Real absorption needs real size hitting the tape.
Wick rejection bias — the candle must close in the rejection direction (opposite of the wick).
Cluster within tolerance — at least N (default 2) of these qualifying tests must occur within ATR × tolerance of the same level inside the detection window (default 40 bars).
Only when all five gates pass does the script paint a zone. The wick rejection bias % input controls how strict the rejection-direction filter is; raising it to 70%+ makes the zone confirmation slower but cleaner.
Cluster-aware level building
When two or more qualifying tests fall within ATR-multiplier tolerance of each other, they are clustered into a single zone whose vertical extent (configurable in ATR units) covers the cluster. This means an iceberg sitting at 4382.50–4383.25 is rendered as a single horizontal band, not two separate ticks — which is how a real iceberg would actually appear on the tape.
Visual system
Iceberg zone — a horizontal band rendered in the cool-blue palette (deep void → pale violet gradient) with configurable opacity.
Glow layers — N (configurable, default 4) stacked transparent boxes behind the zone produce a soft glow border.
Pulse animation — for a configurable number of bars after a fresh test, the zone's transparency oscillates to highlight that the iceberg has just been re-tested. Toggleable.
Test ticks — small markers at each individual test bar inside the zone.
Test count badge — small number tag showing how many tests have hit the level.
Right extension — configurable bar count for forward zone projection.
A locked Void palette (cool violet gradient on a deep void ground) gives the chart a distinctive hidden-liquidity identity.
Lifecycle — persist, archive, break
Every iceberg has three life stages:
Active — currently in front of price and being honoured. New tests add ticks and trigger pulse animations.
Broken — price closed through the level by Break Distance × ATR (default 0.5 ATR). The zone moves to the muted broken-archive palette and stays on the chart for brokenStaleBars (default 150) bars so you can see where structure failed.
Stale — older than the archive lifetime, automatically removed.
A maximum-concurrent-icebergs cap (default 12 active) and a max-broken cap (default 8) keep the chart legible.
Dashboard
Monospaced table, positionable to any of nine corners, surfaces:
Active iceberg count, broken count.
Nearest iceberg level with side (resistance / support), distance in ticks or %.
Test count and age of the nearest iceberg.
Last broken event with bars-ago tag.
Alerts
Three alert conditions, each independently controllable:
New Iceberg Detected — fires the bar an iceberg is first confirmed (all five gates pass).
Iceberg Re-Tested — fires when an existing iceberg gets another qualifying test.
Iceberg Broken — fires when price closes through by the break-distance threshold.
How to read it
Two reads, in order of conviction:
Active iceberg in front of price is your immediate liquidity wall. Faded iceberg the market keeps probing without breaking = strong demand-side or supply-side hidden order. Use as a context level — fade touches if your bias is reversal, expect continuation through if your bias is breakout.
Iceberg Broken alert is your highest-conviction directional event. A hidden order has been eaten through, meaning the side that was holding it has either pulled it or been exhausted — either way, the resistance / support is gone, and the move that follows is unencumbered by the absorbed liquidity.
Suggested settings
Defaults (2 minimum tests, 40-bar detection window, 0.5 ATR cluster tolerance, 0.75 wick/body ratio) are tuned for 5m–1H on liquid markets. For lower-timeframe scalping, lower the wick/body ratio to 0.5 and raise the volume multiplier to 1.5×. For higher-timeframe macro reads, raise minimum tests to 3 and widen the detection window to 100+ bars.
Originality
The implementation — the five-gate detection (wick + extremum + volume + rejection % + cluster tolerance), the ATR-cluster level-builder, the cool-palette glow layers, the post-test pulse animation, the break-distance lifecycle with archive, and the test-count badge rendering — is JOAT-original and tuned together. No third-party code reused. The hidden-liquidity / iceberg concept is well-known to tape readers; the detection pipeline here is built specifically for chart-based bar data without requiring L2 access.
Limitations
Pine indicators cannot read L2 order book data. Iceberg Detector infers iceberg presence from the visible tape footprint — long-wick rejection candles, clustered at a level, with above-average volume, all closing in the rejection direction. This is the accepted public-market inference pattern but it is by nature an inference, not a direct observation. The script can produce false positives on instruments with naturally wicky candles and false negatives on instruments where icebergs are filled too quickly to show as multi-bar tests. On low-volume instruments the volume gate may need to be raised to compensate.
—
Open source- The five-gate detection pipeline, the ATR-cluster level-builder, the post-test pulse compositor, and the lifecycle-with-archive state machine are proprietary. Free to use; behaviour is fully described above.
—
-made with passion by jackofalltrades
Indicateur

Imbalance Repricing Engine [ZOM]Imbalance Repricing Engine
The Imbalance Repricing Engine is an overlay framework designed to map displacement imbalances, fair-value-gap style zones, repricing reactions, mitigation behavior, and failed imbalance structures using standard OHLCV data.
The idea behind the tool is that strong displacement often leaves inefficient price areas behind. When price later returns to those zones, the reaction can provide useful context: continuation, mitigation, rejection, or failure.
This script attempts to visualize that process directly on the chart.
Core features:
- Bullish and bearish imbalance zone detection
- Displacement filtering using ATR expansion, candle body share, and relative volume
- Active zone tracking with forward projection
- Midpoint traces for each imbalance
- Zone state changes for active, mitigated, and failed areas
- VWAP cloud for premium/discount context
- Estimated delta-pressure score derived from OHLCV structure and volume
- LONG REPRICE and SHORT REPRICE labels with setup scores
- Optional failure labeling
- Latest projection lines for entry, invalidation, target 1, and target 2
- Compact ZOM dashboard with active zone count, last event, delta pressure, relative volume, VWAP state, and score
- Multiple visual templates: Rogue, Emerald, Gold Rush, Arctic, and Mono
How to read it:
Bullish imbalance zones are areas where upside displacement left a gap-like inefficiency behind. If price later revisits the zone and responds with supportive structure, the tool can mark a LONG REPRICE signal.
Bearish imbalance zones work the opposite way. If price revisits a bearish imbalance and rejects with confirming structure, the tool can mark a SHORT REPRICE signal.
Mitigated zones show areas where price has traded back into the imbalance. Failed zones show areas where price closed through the structure strongly enough to weaken the original imbalance thesis.
This tool is most useful on liquid futures and index products where displacement and repricing behavior are easy to observe. The default view was staged for ES / NQ style 15m and 5m analysis with enough structure to be visually useful without flooding the chart.
Important note:
TradingView Pine scripts do not have access to true order book, time-and-sales, or full market depth. Delta pressure, imbalance behavior, and absorption-style context here are modeled from OHLCV-based proxies. Treat this as a contextual framework, not financial advice or a predictive system. Indicateur

Liquidity Trap Absorption Matrix [ZOM]Liquidity Trap Absorption Matrix
The Liquidity Trap Absorption Matrix is an overlay framework built to visualize liquidity sweeps, wick rejection, absorption zones, VWAP displacement, and estimated delta pressure using standard OHLCV data.
The core idea is simple: when price raids a prior swing high/low or opening-range level, then closes back inside with meaningful wick rejection and elevated relative volume, the move may represent a failed breakout, stop run, or liquidity trap rather than clean continuation.
This script attempts to map those moments visually so the trader can evaluate where liquidity was taken, where absorption appeared, and how price behaves after the reclaim/rejection.
Core features:
- Confirmed swing-high and swing-low liquidity levels
- Opening-range high/low context for futures-style intraday review
- Bullish and bearish trap detection using sweep + reclaim/rejection logic
- Wick absorption scoring
- Relative volume filter
- VWAP displacement cloud with adaptive deviation bands
- Estimated delta-pressure score from candle structure and volume
- 0-100 setup scoring model
- Absorption zone boxes extended forward from the sweep area
- Compact BUY TRAP / SELL TRAP labels with scores
- Optional TP1 / TP2 / SL projection map from the latest signal
- Small ZOM Trap Matrix dashboard
- Multiple visual templates, including Rogue, Emerald, Gold Rush, Arctic, and Mono
How to read it:
A BUY TRAP appears when price sweeps below a tracked liquidity level and reclaims back above it with enough rejection, volume, and contextual confirmation.
A SELL TRAP appears when price sweeps above a tracked liquidity level and rejects back below it under similar conditions.
The absorption zone shows the area where the sweep and reclaim/rejection occurred. The VWAP cloud gives broader mean/displacement context. The dashboard summarizes regime, trap bias, estimated delta pressure, relative volume, active zones, and the latest score.
This works best on liquid instruments where intraday liquidity sweeps are common, especially index futures such as NQ, MNQ, ES, and MES. The default settings were tuned to show meaningful structure on 5m and 15m futures charts without becoming overly noisy.
Important note:
TradingView Pine scripts do not have access to true order book, time-and-sales, dealer positioning, or full market depth. Delta pressure, absorption, and liquidity behavior here are modeled from OHLCV-based proxies. Treat the output as a contextual decision-support framework, not a predictive system or financial advice. Indicateur

MTF Order Block Confluence [EmpArchitect]█ OVERVIEW
MTF Order Block Confluence maps active bullish and bearish Order Block zones across multiple timeframes and shows when same-direction zones overlap.
The script tracks the most recently formed active bullish and bearish OB on the chart timeframe, then checks whether higher-timeframe OB zones overlap that chart-timeframe zone within a configurable ATR tolerance.
“N TF” means N same-direction active OB zones overlap.
It maps multi-timeframe OB context. It does not provide entries, exits, targets, stop losses, probability scores, or trade signals.
█ WHAT IT MAPS
Order Block zones:
A bullish OB is the last down candle before a bullish structure break.
A bearish OB is the last up candle before a bearish structure break.
The OB zone is drawn from the origin candle’s high to low.
The script tracks one active bullish OB and one active bearish OB per supported timeframe.
Active means the zone has not been invalidated by a close through its far boundary.
This script does not use touch-based mitigation. A zone touch does not remove the OB. Only a close-through invalidates it.
█ MULTI-TIMEFRAME OVERLAP
The script anchors on the chart-timeframe OB and checks whether higher-timeframe OB zones overlap it.
Same-direction overlap only:
• Bull OB overlaps Bull OB
• Bear OB overlaps Bear OB
Opposite-direction overlap is not counted as confluence.
The overlap count is shown as:
• 1 TF = chart-timeframe OB only
• 2 TF = chart-timeframe OB overlaps one higher-timeframe OB
• 3 TF = chart-timeframe OB overlaps two higher-timeframe OBs
• 4 TF = chart-timeframe OB overlaps three higher-timeframe OBs
This is a structure-context read only. It does not mean price should react from the zone.
█ SUPPORTED TIMEFRAMES
The ladder is:
• 15m
• 1H
• 4H
• 1D
Run the script on 15m for the full ladder.
The script uses chart timeframe + higher timeframes only. It does not fake lower-timeframe OBs from a higher chart.
If a ladder timeframe is below the current chart timeframe, the dashboard marks it as below chart TF.
█ CONFIRMATION MODEL
The script uses confirmed candles only.
A new OB forms only after:
• a confirmed structure break
• a first close-cross of the relevant swing level
• a directional break candle
• a valid opposing origin candle
• minimum displacement strength
Weak displacement can consume the structure level without creating an OB.
Higher-timeframe values use confirmed snapshots from completed higher-timeframe candles. This is designed to avoid intrabar higher-timeframe flicker.
█ OB VALIDITY
Bullish OB:
A bullish OB remains active until price closes below the bottom of the zone.
Bearish OB:
A bearish OB remains active until price closes above the top of the zone.
Once invalidated, the OB stays inactive until a new OB forms.
Only the current active chart-timeframe OB zones are drawn. Historical OB zones are not retained on the chart.
█ OVERLAP TOLERANCE
OB zones rarely align perfectly by exact tick.
The script includes an ATR-based overlap tolerance so nearby zones can still count as overlapping when they are structurally close.
The default tolerance is 0.25 × ATR.
This is adjustable.
Lower values require stricter overlap.
Higher values allow wider buffered overlap.
The tolerance should be reviewed manually. It is a visual structure tool, not an automatic validation of zone strength.
█ DASHBOARD
The dashboard shows:
• Bull OB Stack
• Bear OB Stack
• Timeframes included in the stack
• Bull/Bear OB grade per timeframe
• Below-chart timeframe status
• Current supported ladder context
The dashboard grade is based only on the displacement strength of the candle that formed the OB.
Grade does not measure future performance.
█ ALERTS
Included context alerts:
• Bull OB 2+ TF overlap
• Bear OB 2+ TF overlap
Alerts fire when a same-direction OB overlap reaches 2 or more timeframes.
Alerts describe structure context only. They are not trade signals.
█ IMPORTANT LIMITATIONS
• Tracks only the most recently formed active OB per direction per timeframe
• Does not retain multiple historical OBs
• Does not select the nearest OB to current price
• Does not use touch-based mitigation
• Does not predict whether price will react from a zone
• Does not provide entries, stops, targets, or trade instructions
• Overlap depends on the selected ATR tolerance
• Best reviewed manually with the relevant higher timeframes
█ NOTES
• Pine Script v6
• Open-source
• Designed for 15m / 1H / 4H / 1D structure review
• Same-direction OB overlap only
• Built by EmpArchitect
• Educational structure-context tool only
• Not financial advice
• Not a signal service
Indicateur

Machine Learning Point Forecast with SR [SS]Hello,
Releasing the Machine Learning Point Forecast indicator, let's get into it!
What It Is
This indicator is a price forecasting indicator built on a simple but powerful idea borrowed from machine learning: markets tend to behave similarly when they're in similar states.
Instead of relying on a fixed formula (like a moving average crossover or a fixed RSI threshold), this indicator constantly asks a different question every bar:
"Out of the last 200 bars, which ones looked most like right now and what happened next, those times?"
It answers that question using K-Nearest Neighbors (KNN), a classic non-parametric machine learning technique, applied to four hand engineered features that describe the shape and momentum of price action. The result is plotted directly on the chart as a series of horizontal price targets, each one a literal price level the model thinks is worth watching, based on what similar historical setups did.
The Theory
Feature Engineering: Describing "What a Bar Looks Like"
Raw OHLC data isn't directly comparable across time (a $2 move means something different at $50 than at $500), so the model first converts each bar into four normalized descriptors:
Composite candle shape: the combined magnitude of the high, low, and close moves relative to the open, expressed as a single Euclidean value. This captures how "stretched" or volatile a candle was.
Close slope: the rate of change of a 14-period linear regression of price, normalized by price. This captures short-term trend acceleration/deceleration.
RSI slope: the rate of change of a 14-period linear regression of RSI. This captures whether momentum itself is accelerating or stalling, independent of price.
Return slope: the rate of change of a 14-period linear regression of bar-to-bar percentage returns. This captures whether volatility/returns are trending up or down.
Together, these four numbers form a fingerprint for every bar, not just where price is, but how it's moving and accelerating.
Standardization: Putting Everything on the Same Scale
Each of the four features is converted into a z-score over a rolling window (default 100 bars):
z = (value − rolling mean) / rolling standard deviation
This step matters because the four raw features live on completely different scales. Z-scoring puts them all in "standard deviations from normal" terms, so no single feature can dominate the similarity comparison just because its raw numbers happen to be bigger.
The K-Nearest Neighbors Search
With four standardized features per bar, every bar in history is now a point in 4-dimensional space. The model searches the last N bars (default 200, the "Historical Search Window") and calculates the Euclidean distance between the current bar's 4D fingerprint and every historical bar's fingerprint:
distance = √
The K historical bars (default 5) with the smallest distance are kept, these are the "nearest neighbors," i.e., the historical moments that most closely resembled the current setup across all four dimensions simultaneously.
Inverse Distance Weighted Forecasting (IDWF)
This is the forecasting step. For each of the K neighbors, the model already knows what actually happened: the real forward return that occurred over the next N bars (the "Forecast Bars Forward" setting) after that historical analog appeared.
Those K historical outcomes are blended into a single forecast using inverse distance weighting closer matches (smaller distance) get more influence over the final number than weaker matches:
forecast return = Σ(return × weight) / Σ(weight), where weight = 1 / distance
That weighted return is applied to the current close to produce the point target — the model's price forecast.
This entire approach:
feature engineering
standardization
KNN
Distance weighted aggregation
is a form of case-based / analog forecasting. It's the same family of technique used in some quantitative pattern-matching strategies and academic time series KNN research: rather than fitting one global formula to all market conditions, it lets the data itself decide what "similar" means, bar by bar.
How It Works on the Chart
Point-Forecast Lines
Once per closed bar, the model draws a flat, dashed, horizontal line at the calculated target price, extending forward indefinitely. Green lines mean the model's weighted forecast is bullish (target above current price); red means bearish.
Each line behaves like a real price target:
It disappears the instant price actually reaches it (high touches an upside target, or low touches a downside target).
It ages out automatically — only a capped number of lines (default 20, adjustable) are kept on screen. Once that cap is hit, the oldest surviving forecast is dropped to make room for the newest one.
Grouping Nearby Targets
Because a new forecast is generated every bar, it's common for the model to repeatedly point at roughly the same price over several bars in a row. Rather than stacking near duplicate lines, any new target that lands within a configurable percentage of an existing active target gets merged, the two are averaged into one line, and that line's label updates accordingly.
This has a useful side effect: the more a price level keeps attracting merges, the more "agreed upon" that level has been across many bars' worth of model runs informally, a cluster of merged calls is a stronger zone of interest than an isolated, never-revisited line.
Reading the Signals in Practice
This indicator is best treated as a contextual map of historically-analogous price targets, not a standalone buy/sell signal generator. A few practical ways to use it:
Confluence, not isolation. Treat each TP line as one vote. A target line that lines up with an existing structural level (a prior swing high/low, VWAP, a round number) is more interesting than one floating in open air.
Watch for clustering. Because nearby targets merge, a chart where forecasts keep collapsing into the same line over time is the model expressing genuine conviction about that price. A chart full of scattered, never-merged lines suggests the model is seeing a noisier, less consistent setup right now.
Use Avg Fit Distance as a confidence dial. A low distance means "this is a well-worn pattern"; a high or rising distance means "this is a less familiar regime, be more skeptical of the target." % Bullish/Bearish tells you how unanimous the analogs are. 100%/0% is a much stronger statement than 60%/40%, even if the point target is identical.
New forecasts only print once per closed bar (not on every tick), so the model won't spam new lines intrabar, but a line can still vanish intrabar the instant its target is actually touched.
Honest Limitations
This is a similarity heuristic, not a trained, validated, or backtested predictive model. "What happened after similar setups in the past" is not a guarantee of what happens next.
Small windows (low K, short lookback) make the model fast and reactive but noisier; large windows make it smoother but slower to adapt to genuine regime change.
Like any pattern-matching tool, it can be confidently wrong, a low Avg Fit Distance means the pattern matched well, not that the outcome is certain.
It's intended as one input among several in a broader trading process — not a substitute for risk management, market structure analysis, or your own judgment.
I hope you all enjoy and find it helpful!
As always, safe trades to all! Indicateur