Indicateur

Ichimoku Cloud Laboratory [DAFE]Ichimoku Cloud Laboratory : The Ultimate All-In-One Trend & Equilibrium Engine
50+ Cloud Engines. Multi-Cloud Architecture. Advanced Signal Filtering. This is Not Just Ichimoku. This is the Evolution of Market Equilibrium.
█ PHILOSOPHY: BEYOND THE CLOUD, INTO THE LABORATORY
The Ichimoku Kinko Hyo is more than an indicator; it is a complete trading philosophy, a masterpiece of market analysis that provides an "at-a-glance" view of trend, momentum, and equilibrium. However, its core calculation—the simple midpoint of the high and low—was conceived in a pre-computer era. While brilliant, it is blind to the modern market's most critical force: the nuanced character of volume, volatility, and microstructure.
The Ichimoku Cloud Laboratory was not created to be another Ichimoku clone. It was engineered to be the definitive evolution of Goichi Hosoda's original vision. This is not just an indicator; it is a powerful, interactive research environment. It is a laboratory where you, the trader, can move beyond the static "one-size-fits-all" approach and forge an Ichimoku system that is perfectly synchronized with the unique physics of your market, timeframe, and analytical style.
We have deconstructed the very DNA of the Cloud, replacing its rigid 1930s-era calculation with a library of over 50 distinct, mathematically diverse calculation engines . From classical moving averages and advanced DSP filters to proprietary DAFE quantum models, this suite provides an unparalleled arsenal for visualizing the true, underlying architecture of market equilibrium.
█ WHAT MAKES THIS A "LABORATORY"? THE CORE INNOVATIONS
This tool stands in a class of its own. It is a collection of what could be 50 separate indicators, all seamlessly integrated into one powerful, unified engine.
The 50+ Algorithm Engine: This is the heart of the Laboratory. You are no longer bound by the simple Donchian midpoint. You can now swap the core calculation engine of the Tenkan-sen, Kijun-sen, and Senkou Span B with any of over 50 algorithms. Want a zero-lag, Hull MA-based cloud? A volume-weighted cloud that gravitates towards liquidity? A cloud that adapts its speed based on market entropy? You now have the power to construct it.
Multi-Cloud Architecture: This revolutionary feature allows you to stack up to three layers of the Ichimoku cloud on your chart, each calculated with a progressively longer timeframe multiplier. This transforms the flat, two-dimensional cloud into a rich, three-dimensional "heatmap" of support and resistance. You can instantly see the alignment (or conflict) between the short-term, medium-term, and long-term trends.
Advanced Signal Logic & Filtering: Go beyond the simple TK Cross. The Laboratory includes eight distinct, built-in signal strategies, from the classic "Kumo Breakout" to the high-conviction "Perfect Order." Crucially, you can then fortify these signals with a professional-grade filter module, requiring confirmation from Volume, ATR (volatility), or ADX (trend strength) before a signal is even considered valid.
Proprietary DAFE Engines: The crown jewels of the Laboratory. These are custom-built, proprietary algorithms you will not find anywhere else, designed to infuse the cloud with modern quantitative analysis:
DAFE Flux Reactor: A cloud that breathes with volatility, automatically tightening in squeezes and expanding in trends.
DAFE Tensor Cloud: Uses a 4-dimensional average (OHLC) to create a cloud that tracks the "true" center of price action.
DAFE Quantum Step: A noise-canceling cloud that only moves when price exceeds a volatility-based threshold.
DAFE Gravity Well: A volume-weighted cloud that is magnetically pulled towards high-liquidity zones.
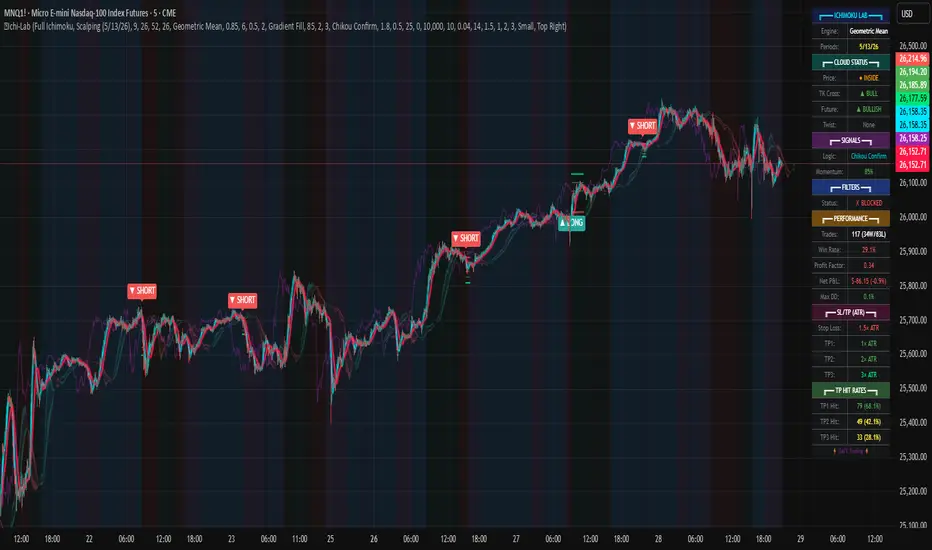
Integrated Performance Engine & Dashboard: How do you know which of the 50+ engines is best? You test it. The built-in Performance Dashboard tracks every trade generated by your chosen configuration, while the main dashboard provides a comprehensive, at-a-glance summary of the entire Ichimoku system's current state.
█ A GUIDED TOUR OF THE ALGORITHMIC CORE
This is your library of mathematical DNA. The 50+ engines are your tools to build the perfect cloud.
THE ENGINE FAMILIES
The Classics (Hull MA, ZLEMA, KAMA, VIDYA): Replace the choppy Donchian midpoint with smooth, low-lag, or adaptive moving averages to create a more responsive and readable cloud.
The DSP & Quantitative Masters (SuperSmoother, Kalman, Gaussian, Laguerre): Employ advanced digital signal processing and statistical filtering to construct a cloud that is surgically precise in its separation of trend "signal" from market "noise."
The Volume-Based (VWMA, VWAP, Money Flow Weighted): Build a cloud that is not just based on price, but is weighted by participation. This creates a cloud that automatically respects high-liquidity zones as stronger levels of support and resistance.
The Adaptive Geniuses (ATR-Scaled, Volatility-Modulated, Efficiency Ratio, Entropy): These are "smart" engines that analyze the market's character—its volatility, trendiness, or disorder—and adapt the cloud's calculation in real-time. The result is a cloud that is stable in chop and dynamic in trends.
The DAFE Proprietary Engines: The pinnacle of cloud engineering. These exclusive algorithms allow you to build clouds based on principles of physics, institutional analysis, and quantum mechanics, creating a truly next-generation analytical tool.
█ STRATEGIC APPLICATION: FROM SIGNALS TO STRUCTURE
The Laboratory transforms Ichimoku from a simple signal generator into a complete market structure framework.
The Signal Logic: You are not limited to one strategy.
TK Cross: For classic momentum signals.
Kumo Breakout: For pure price action breakout strategies.
Perfect Order: The ultimate filter. By requiring Price > Cloud > Tenkan > Kijun, you filter for only the strongest, most established trends, eliminating the majority of false signals.
Cloud Twist: A forward-looking, predictive signal. The twist of the future cloud often pinpoints the exact timing of a potential trend reversal.
The Multi-Cloud Strategy: This is the professional's view. By enabling 3 Cloud Layers, you can see the market's fractal nature.
Layer 1 (Standard): Your short-term operational trend.
Layer 2 (e.g., 2x Periods): Your medium-term structural trend.
Layer 3 (e.g., 3x Periods): Your long-term macro trend.
The Strategy: Wait for price to pull back into the space between the 2nd and 3rd cloud layers—the "macro support/resistance zone"—and then take a signal from the 1st layer in the direction of the overall trend. This is a high-probability institutional setup.
█ THE MASTER DASHBOARD: YOUR "AT-A-GLANCE" COMMAND CENTER
The dashboard provides a comprehensive, real-time summary of the entire Ichimoku system's state.
Engine & Periods: Instantly confirm which of the 50+ engines and period settings are active.
Status Readout: Get an immediate, color-coded verdict on the three core Ichimoku components: Price vs. Cloud, the TK Cross, and the Future Cloud bias.
Momentum & Strength Gauge: A proprietary score that quantifies the overall bullish or bearish momentum of the system, and a "Strength" bar that visualizes the conviction of the current alignment.
Performance Data: If enabled, the dashboard will display your strategy's key performance metrics, including Win Rate, Profit Factor, and Net P&L.
█ DEVELOPMENT PHILOSOPHY
The Ichimoku Cloud Laboratory was born from a deep respect for Goichi Hosoda's original work and a relentless desire to push it into the 21st century. We believe that in modern markets, static tools are obsolete. The future of trading lies in adaptation, customization, and multi-dimensional analysis. This tool is for the serious trader, the systems thinker, the architect—the individual who is not content with a black box, but who seeks to understand, test, and refine their edge with surgical precision.
The Ichimoku Laboratory is designed to be the ultimate tool for that reaction, providing a crystal-clear, multi-layered view of what the market is telling you—not just through price, but through the very fabric of its equilibrium.
█ DISCLAIMER AND BEST PRACTICES
THIS IS AN ADVANCED ANALYTICAL TOOL: This indicator provides a sophisticated market structure and signal framework. It must be integrated into a complete trading plan that includes your own analysis and risk management.
RISK MANAGEMENT IS PARAMOUNT: All trading involves substantial risk. Never risk more capital than you are prepared to lose.
START WITH A ROBUST BASE: Begin with the "Traditional" preset and the "Standard Donchian" engine to master the classic feel. Then, experiment with a low-lag engine like the "Hull Moving Average" to see the immediate benefit of a smoother, more responsive cloud.
USE CONFLUENCE: The highest probability signals come from confluence. A "TK Cross" buy signal that occurs above a bullish "Multi-Cloud" structure, confirmed by a "Perfect Order" and high volume, is an A++ setup.
"The essence of success in the market is not forecasting, but reacting to what the market is telling you right now."
— J. Welles Wilder Jr.
Taking you to school. - Dskyz, Trade with Anticipation. Trade with Strength. Trade with RSI: Evolved Indicateur

Indicateur
Consolidation Zones (Range + ATR + optional ADX)Consolidation Zones — Market Compression Visualizer
Consolidation Zones is a visual market-structure indicator designed to identify periods of price compression where volatility contracts and directional movement pauses. These zones often precede expansion, breakout, or trend continuation, making them critical areas for trade preparation and risk planning. Instead of relying on a single oscillator, this script evaluates price behavior over time to detect when the market is moving sideways within a defined range. When consolidation is present, the indicator highlights the zone directly on the chart, allowing traders to immediately see where balance is occurring.
What This Indicator Helps You Do:
Identify low-volatility, sideways markets
Spot compression before expansion
Avoid entering trades during chop and noise
Prepare for breakout or breakdown scenarios
Combine structure with your existing trend or momentum tools
How to Use It
Inside the zone: Expect indecision and mean-reversion behavior
Break above the zone: Potential bullish expansion
Break below the zone: Potential bearish expansion
Use zone boundaries as context for entries, stops, and targets
This indicator is intentionally non-predictive — it does not guess direction. Instead, it provides clarity, showing where the market is coiling so you can act when price reveals intent.
Best Paired With
Trend indicators (EMA, VWAP)
Momentum tools (RSI, MACD)
Volume or volatility expansion tools
Notes
Consolidation is timeframe-dependent — zones may differ across intervals
Designed as a context tool, not a standalone signal generator
This indicator is for educational and informational purposes only. Indicateur

Multi-Timeframe Order BlocksDesigned to identify and visualize key supply and demand zones based on order block theory across multiple timeframes. The indicator detects order blocks by analyzing sequential candle patterns and price movement thresholds to highlight potential reversal or continuation zones where institutional buying or selling activity may have occurred.
The indicator works by scanning for clusters of consecutive bullish or bearish candles followed by a significant price move, which signals the formation of an order block. It then plots these zones as colored boxes on the chart—green for demand (bullish order blocks) and red for supply (bearish order blocks). The zones can be based on candle bodies or wicks, depending on user preference, and the indicator supports multi-timeframe analysis by allowing optional higher timeframe inputs.
How It Works:
Sequential Candle Detection: The indicator looks for a specified number of consecutive bullish or bearish candles (configurable by the user) to identify potential order blocks.
Price Movement Threshold: It checks if the price movement after the order block formation exceeds a user-defined percentage threshold, ensuring only significant zones are marked.
Zone Plotting: Once an order block is confirmed, the indicator draws a supply or demand zone as a box on the chart, using either candle bodies or wicks for zone boundaries.
Multi-Timeframe Support: Users can optionally specify higher timeframes to incorporate broader market context, enhancing the reliability of the zones.
Zone Management: The indicator limits the number of zones displayed to avoid clutter, automatically removing the oldest zones when the maximum count is exceeded.
How to Interpret:
Demand Zones (Green Boxes): These represent areas where buying pressure was strong enough to create a bullish order block. Price often finds support here, making these zones potential entry points for long trades or areas to watch for price bounces.
Supply Zones (Red Boxes): These indicate areas of strong selling pressure forming bearish order blocks. Price may face resistance in these zones, which can be used as potential exit points for longs or entry points for shorts.
Multi-Timeframe Confirmation: Zones identified on higher timeframes tend to be stronger and more reliable. Use the optional higher timeframe inputs to align your trades with broader market trends.
Use with Other Indicators: Combine order block zones with volume, momentum, or trend indicators to improve trade confirmation and risk management.
Zone Breaks: A decisive break and close beyond a supply or demand zone may signal a shift in market sentiment and potential trend continuation or reversal.
Disclaimer
This indicator is provided for educational and informational purposes only and does not constitute financial advice. Trading involves significant risk, and it is possible to lose more than your initial investment. Users should conduct their own research and consider their financial situation carefully before making any trading decisions. The developer and publisher of this indicator are not responsible for any trading losses or damages incurred. Always use proper risk management and consult with a licensed financial advisor if needed. Indicateur

Impulse Trend Levels [BOSWaves]Impulse Trend Levels - Momentum-Adaptive Trend Detection with Impulse-Driven Confidence Bands
Overview
Impulse Trend Levels is a momentum-aware trend identification system that tracks directional price movement through adaptive confidence bands, where band width dynamically adjusts based on impulse strength and freshness to reflect real-time conviction in the current trend direction.
Instead of relying on fixed moving average crossovers or static band multipliers, trend state, band positioning, and zone thickness are determined through impulse detection patterns, exponential decay modeling, and volatility-normalized momentum measurement.
This creates dynamic trend boundaries that reflect actual momentum intensity rather than arbitrary technical levels - contracting during fresh impulse conditions when trend conviction is high, expanding during impulse decay periods when directional confidence weakens, and incorporating momentum freshness calculations to reveal whether trends are accelerating or deteriorating.
Price is therefore evaluated relative to bands that adapt to momentum state rather than conventional static thresholds.
Conceptual Framework
Impulse Trend Levels is founded on the principle that meaningful trend signals emerge when price momentum intensity reaches significant thresholds relative to recent volatility rather than when price simply crosses moving averages.
Traditional trend-following methods identify directional changes through price-indicator crossovers, which often ignore the underlying momentum dynamics and conviction levels that sustain those moves. This framework replaces static-threshold logic with impulse-driven band construction informed by actual momentum strength and decay characteristics.
Three core principles guide the design:
Trend direction should be determined by volatility-normalized momentum breaches, not simple price crossovers alone.
Band width must adapt to impulse freshness, reflecting real-time confidence in the current trend.
Momentum decay modeling reveals whether trends are maintaining strength or losing conviction.
This shifts trend analysis from static indicator levels into adaptive, momentum-anchored confidence boundaries.
Theoretical Foundation
The indicator combines exponential moving average smoothing, mean absolute deviation measurement, impulse detection methodology, and exponential decay tracking.
An EMA-based trend baseline provides directional reference, while Mean Absolute Deviation (MAD) offers volatility-normalized scaling for momentum measurement. Impulse detection identifies significant price movements relative to recent volatility, triggering fresh momentum readings that decay exponentially over time. Band multipliers interpolate between tight and wide settings based on calculated impulse freshness.
Four internal systems operate in tandem:
Trend Baseline Engine : Computes EMA-smoothed price levels for directional reference and band anchoring.
Volatility Measurement System : Calculates MAD to provide adaptive scaling that normalizes momentum across varying market conditions.
Impulse Detection Logic : Identifies volatility-normalized price movements exceeding threshold levels, capturing momentum intensity and direction.
Decay-Based Confidence Modeling : Applies exponential decay to impulse readings, converting raw momentum into time-weighted freshness metrics that drive band adaptation.
This design allows trend confidence to reflect actual momentum behavior rather than reacting mechanically to price formations.
How It Works
Impulse Trend Levels evaluates price through a sequence of momentum-aware processes:
Baseline Calculation : EMA smoothing of open and close creates a directional trend reference that filters short-term noise.
Volatility Normalization : MAD calculation over a specified lookback provides dynamic scaling for momentum measurement.
Raw Impulse Detection : Price change over impulse lookback divided by MAD creates volatility-normalized momentum readings.
Threshold-Based Activation : When normalized momentum exceeds threshold (1.0), impulse registers with absolute magnitude and directional sign.
Exponential Decay Application : Between impulse events, stored impulse value decays exponentially via configurable decay rate.
Freshness Conversion : Decaying impulse transforms into freshness metric (0-100%) representing current momentum conviction.
Adaptive Band Construction : Band multiplier interpolates between minimum (fresh) and maximum (stale) settings based on freshness, then scales MAD to determine band width.
Trend State Logic : Price crossing above upper band triggers bullish state; crossing below lower band triggers bearish state; state persists until opposite breach.
Signal Generation : Trend state switches from bearish to bullish produce buy signals; bullish to bearish switches produce sell signals.
Retest Identification : Price touching inner band edge after signal buffer period marks retests, with cooldown periods preventing excessive plotting.
Together, these elements form a continuously updating trend framework anchored in momentum reality.
Interpretation
Impulse Trend Levels should be interpreted as momentum-anchored trend confidence boundaries:
Bullish Trend State (Cyan) : Established when price closes above adaptive upper band, indicating upward momentum breach with associated confidence level.
Bearish Trend State (Magenta) : Established when price closes below adaptive lower band, signaling downward momentum breach with directional conviction.
Trend Cloud : Visual gradient zone displays between outer and inner band edges, with opacity reflecting current trend state and confidence.
Band Width Dynamics : Tighter bands indicate fresh impulse (high confidence), wider bands indicate impulse decay (reduced confidence).
▲ Buy Signals : Green upward triangles mark bullish trend state initiations at crossovers above upper band.
▼ Sell Signals : Red downward triangles mark bearish trend state initiations at crossovers below lower band.
✦ Retest Markers : Small diamonds identify price retouching inner band edge after sufficient buffer period from initial signal.
Retest Extension Lines : Horizontal projections from retest points extend forward, marking potential support/resistance levels.
Colored Candles : Optional bar coloring reflects current trend state for immediate visual reference. Note: The original chart candles must be disabled in chart settings for the trend-colored candles to display properly.
Impulse freshness, band width dynamics, and momentum normalization outweigh isolated price movements.
Signal Logic & Visual Cues
Impulse Trend Levels presents two primary interaction signals:
Buy Signal (▲) : Green label appears when trend state switches from bearish to bullish via upper band crossover, suggesting momentum shift to upside.
Sell Signal (▼) : Red label displays when trend state switches from bullish to bearish via lower band crossunder, indicating momentum shift to downside.
Retest detection provides secondary confirmation when price revisits inner band boundaries after signal buffer cooldown expires.
Alert generation covers trend state switches (long/short), retest occurrences, and impulse freshness decay below 50% threshold for systematic monitoring.
Strategy Integration
Impulse Trend Levels fits within momentum-informed and adaptive trend-following approaches:
Momentum-Confirmed Entries : Use band crossovers as high-probability trend initiation points where volatility-normalized momentum exceeded threshold.
Freshness-Based Position Sizing : Scale exposure based on impulse freshness - larger positions during fresh impulse periods, reduced sizing as impulse decays.
Band-Width Risk Management : Expect wider price ranges when bands expand during decay, tighter ranges when bands contract during fresh impulse.
Retest-Based Re-entry : Use inner band retests as lower-risk entry opportunities within established trends after initial signal cooldown.
Cloud-Aligned Directional Bias : Favor trades aligning with current trend state rather than counter-trend positions.
Multi-Timeframe Momentum Confirmation : Apply higher-timeframe impulse trend state to filter lower-timeframe entry precision.
Technical Implementation Details
Core Engine : EMA-based baseline with MAD volatility measurement
Impulse Model : Volatility-normalized momentum detection with directional sign capture
Decay System : Exponential decay application (0.8-0.99 range) with freshness conversion
Band Construction : Linear interpolation between min/max multipliers scaled by MAD
Visualization : Gradient-filled cloud zones with bar coloring and signal labels
Signal Logic : State-switch detection with retest buffer and cooldown mechanisms
Performance Profile : Optimized for real-time execution across all timeframes
Optimal Application Parameters
Timeframe Guidance:
1 - 5 min : Micro-trend detection for scalping with responsive impulse settings
15 - 60 min : Intraday momentum tracking with balanced decay characteristics
4H - Daily : Swing-level trend identification with sustained impulse persistence
Suggested Baseline Configuration:
Trend Length : 19
Impulse Lookback : 5
Decay Rate : 0.99
MAD Length : 20
Band Min (Fresh) : 1.5
Band Max (Stale) : 1.9
Signal Buffer Period : 10
Show Trend Cloud : Enabled
Color Bars : Enabled (requires disabling original chart candles in chart settings)
Show Buy/Sell Signals : Enabled
These suggested parameters should be used as a baseline; their effectiveness depends on the asset's volatility profile, momentum characteristics, and preferred signal frequency, so fine-tuning is expected for optimal performance.
Parameter Calibration Notes
Use the following adjustments to refine behavior without altering the core logic:
Excessive signal noise : Increase Trend Length to demand smoother baseline crossovers or increase Impulse Lookback for less reactive momentum detection.
Missed momentum shifts : Decrease Impulse Lookback to capture shorter-term momentum changes or reduce Decay Rate to allow faster impulse fade.
Bands too tight/wide : Adjust Band Min and Band Max multipliers to modify confidence zone thickness across freshness spectrum.
Impulse decays too quickly : Increase Decay Rate toward 0.99 to sustain impulse readings longer between fresh events.
Impulse decays too slowly : Decrease Decay Rate toward 0.8 for faster momentum fade and more frequent band expansion.
Unstable volatility scaling : Increase MAD Length to smooth volatility measurement and reduce sensitivity to short-term spikes.
Too many retest markers : Increase retest cooldown period (55 bars hardcoded) or increase Signal Buffer Period to space out signals.
Adjustments should be incremental and evaluated across multiple session types rather than isolated market conditions.
Performance Characteristics
High Effectiveness:
Trending markets with clear momentum phases and directional persistence
Instruments with consistent volatility characteristics where MAD scaling normalizes effectively
Momentum continuation strategies entering on fresh impulse signals
Trend-following approaches benefiting from adaptive confidence measurement
Reduced Effectiveness:
Choppy, range-bound markets with frequent whipsaw crossovers
Extremely low volatility environments where impulse threshold becomes difficult to breach
News-driven or gapped markets with discontinuous momentum patterns
Mean-reversion dominant conditions where momentum breaches quickly reverse
Consolidation and sideways price action where trend-following methodologies inherently struggle due to lack of sustained directional movement
Integration Guidelines
Confluence : Combine with BOSWaves structure, volume analysis, or traditional trend indicators
Freshness Respect : Trust signals occurring during high impulse freshness periods with contracted bands
Decay Awareness : Reduce position sizing or tighten stops as impulse decays and bands widen
Retest Utilization : Treat inner band retests as continuation confirmation rather than reversal signals
State Discipline : Maintain directional bias aligned with current trend state until opposite band breach occurs
Disclaimer
Impulse Trend Levels is a professional-grade momentum and trend analysis tool. It uses volatility-normalized impulse detection with exponential decay modeling but does not predict future price movements. Results depend on market conditions, volatility characteristics, parameter selection, and disciplined execution. BOSWaves recommends deploying this indicator within a broader analytical framework that incorporates price structure, volume context, and comprehensive risk management. Indicateur

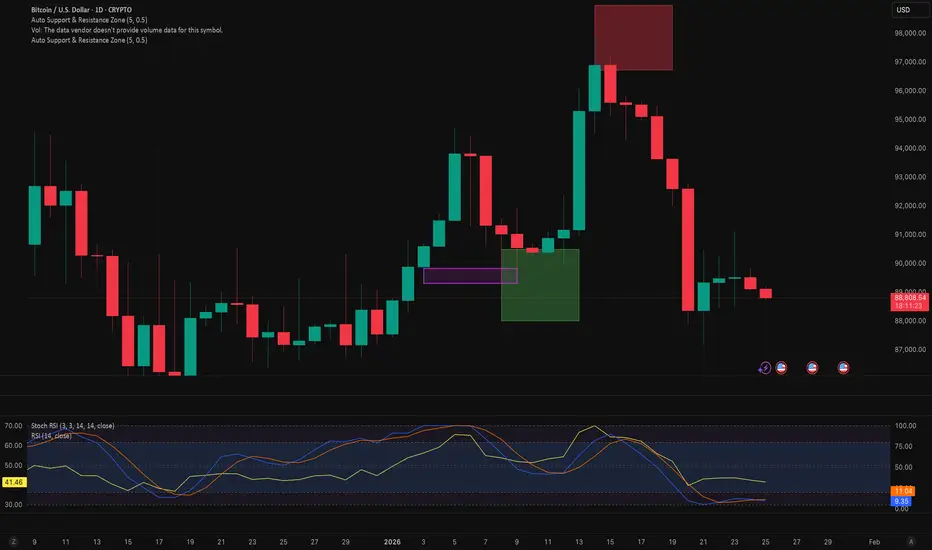
Phantom Support & Resistance Auto [PT-IND-SR.001]Overview
Phantom Support & Resistance Auto is a context-focused support and resistance indicator designed to visualize price interaction zones derived from multiple market behaviors.
The script does not generate buy or sell signals.
Instead, it provides a structured map of potential reaction areas, allowing traders to better understand where price has historically reacted, consolidated, or extended liquidity.
This indicator is intended to be used as a decision-support and contextual analysis tool, not as a standalone trading system.
How the Script Works
The indicator combines several independent but complementary methods of identifying support and resistance.
Each method captures a different type of market behavior, and all components can be enabled or disabled independently.
1) High / Low Zones (Range Extremes)
This module tracks the highest high and lowest low over a configurable lookback period.
These levels represent recent range boundaries, which often act as reaction zones during consolidation or pullbacks.
They are visualized as extended horizontal levels to preserve historical context.
2) Pivot Zones (Filtered & Merged Levels)
Pivot zones are derived from confirmed pivot highs and lows.
To avoid excessive and overlapping levels, the script applies a merge tolerance based on either:
ATR distance, or Percentage distance from price
Nearby pivot levels are merged into a single zone, and each zone tracks how many times price has interacted with it.
This interaction count adjusts visual strength, creating a relative importance hierarchy rather than treating all levels equally.
An optional higher-timeframe source can be used to project structurally significant levels onto lower timeframes.
3) Wick Liquidity Zones
This module detects candles with disproportionately large wicks relative to their bodies.
Such candles often indicate liquidity grabs, stop runs, or rejection areas.
Detected wick levels are extended forward to highlight areas where liquidity was previously absorbed.
This component focuses on price rejection behavior, not trend direction.
4) PR Levels (Volatility-Adjusted Predicted Ranges)
PR levels are derived from a volatility-adjusted average price model.
Using ATR as a normalization factor, the script calculates a central average along with upper and lower projected zones.
These levels are adaptive, expanding and contracting with volatility, and are intended to represent probabilistic price ranges, not fixed targets.
5) MACD-Based Support & Resistance (Heikin Ashi Source)
This module derives dynamic support and resistance levels based on MACD momentum shifts, calculated from Heikin Ashi price data to reduce noise.
When MACD momentum transitions occur, recent highs and lows are captured and projected as potential reaction zones.
This component focuses on momentum-driven structural changes, rather than static price levels.
Why These Components Are Combined
Each component captures a different dimension of market behavior:
High / Low zones → Range extremes
Pivot zones → Structural reaction points
Wick zones → Liquidity and rejection behavior
PR levels → Volatility-normalized price ranges
MACD S&R → Momentum-based structural shifts
By combining these sources, the indicator provides a layered view of support and resistance, allowing traders to evaluate confluence, alignment, or divergence between different types of levels instead of relying on a single method.
The script does not assume all levels are equal; visual weighting helps distinguish structural levels from situational ones.
Visualization & Outputs
Color-coded horizontal zones with strength-based opacity
Optional glow effects for visual clarity
Independent toggles for each S&R source
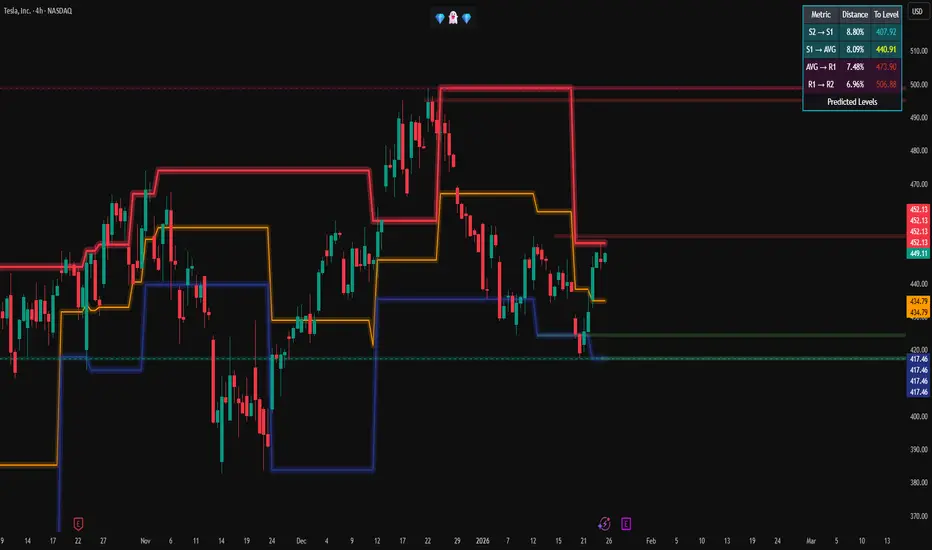
A table showing percentage distances between projected PR levels, helping users contextualize price location within its current range
All visual components are configurable and can be selectively disabled to reduce chart clutter.
How to Use
Use this indicator as a context and mapping tool
Observe areas where multiple zone types align for higher contextual significance
Combine with your own entry logic, confirmations, and trade management rules
Suitable for multi-timeframe analysis and market structure studies
Risk Management Notice
This indicator should always be used as part of a well-defined risk management plan.
Support and resistance zones represent areas of potential interaction, not guaranteed reactions.
Users are responsible for applying appropriate:
Position sizing
Stop placement
Risk-to-reward rules
The indicator does not manage risk automatically and should not replace proper risk management practices.
What This Script Is NOT
It is not a buy/sell signal generator
It does not predict future price direction
It does not guarantee reactions at every level
It should not be used as a standalone trading strategy
Originality & Purpose
The originality of this script lies in its structured integration of multiple support and resistance methodologies, each preserved as a distinct analytical layer rather than blended into a single opaque output.
The purpose is to help traders understand where price has interacted with liquidity, structure, and volatility, not to automate trade decisions.
Indicateur

Pivot Points with Support/ResistanceA) Pivot Resistance Levels (R1, R2, R3…)
Resistance pivots are projected upside levels where price often pauses, rejects, or reverses. They are commonly used as profit targets for long trades and areas to watch for short setups when buyers show weakness.
B) Pivot Support Levels (S1, S2, S3…)
Support pivots are projected downside levels where price often stabilizes or bounces. They are commonly used as profit targets for short trades and areas to watch for long setups when sellers lose momentum.
C) Role in Market Structure
S/R pivots map out probable intraday supply and demand zones based on the prior session’s price action. They help define the day’s trading range and highlight high-probability reaction areas.
D) Trading Interpretation
Acceptance above resistance → bullish continuation
Rejection at resistance → potential pullback or reversal
Acceptance below support → bearish continuation
Rejection at support → potential bounce
Best used with trend context, volume, and confluence (CPR, VAH/VAL, Camarilla) Indicateur

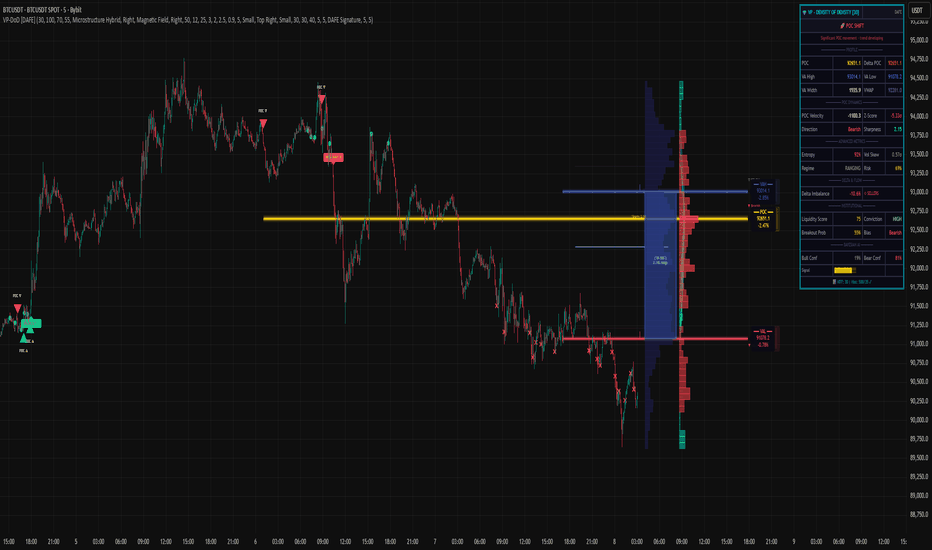
Volume Profile - Density of Density [DAFE]Volume Profile - Density of Density
The Art & Science of Market Architecture: An AI-Enhanced Volume Profile & Order Flow Engine with a Revolutionary Visualization Core.
█ PHILOSOPHY: BEYOND THE PROFILE, INTO THE DENSITY
Standard Volume Profile shows you a one-dimensional story: where volume was traded. It shows you the first layer of density. But this is like looking at a galaxy and only seeing the stars, completely missing the gravitational forces, the dark matter, and the nebulae that give it structure.
Volume Profile - Density of Density (VP-DoD) is a revolutionary leap forward. It was engineered to analyze the second order of market data: the properties of the density itself . We don't just ask "Where did volume trade?" We ask " Why did it trade there? What was the character of that volume? What is the statistical significance of its shape? What is the probability of what happens next?"
This is a complete, institutional-grade analytical framework built on the DAFE principle: Data Analysis For Execution . It fuses a higher-timeframe structural engine, a proprietary microstructure delta engine, and a Bayesian AI into a single, cohesive intelligence system. It is designed to transform your chart from a flat, lagging record of the past into a living, three-dimensional map of market structure and intention.
█ WHAT MAKES VP-DoD ULTIMATE UNLIKE ANY OTHER PROFILE TOOL?
This is not just another volume profile script. It stands apart due to a suite of proprietary features previously unseen on this platform.
Higher Timeframe (HTF) Core: While other profiles are trapped by the noise of your current chart, VP-DoD builds its foundation on a higher timeframe of your choice (e.g., Daily data on a 15m chart). This is its greatest strength. It filters out intraday noise to reveal the true, macro architectural levels where institutions have built their positions.
Microstructure Hybrid Delta Engine: Standard delta is primitive. Our engine provides a far more accurate picture of order flow by simulating tick data and analyzing the battle between candle bodies (aggression) and wicks (absorption). It sees the hidden story inside the volume.
Bayesian AI Confidence Model: This is not a simple weighted score. VP-DoD incorporates a genuine Bayesian inference model. It starts with a neutral "belief" about the market and continuously updates its Bullish/Bearish Confidence percentage based on new evidence from delta, POC velocity, and price action. It thinks like a professional quant, providing you with a real-time statistical edge.
Advanced Statistical Analysis: It calculates metrics found nowhere else, such as Profile Entropy (a measure of market disorder) and Volatility Skew (a measure of fear vs. greed from the derivatives market), and normalizes them with Z-Scores for universal applicability.
Revolutionary Visualization Engine: Data should be intuitive and beautiful. VP-DoD features 14 distinct, animated, and theme-aware rendering modes . From "Nebula Plasma" and "Liquid Metal" to "DNA Helix" and "Constellation Map," you can transform raw data into interactive data art, allowing you to perceive market structure in a way that resonates with your unique analytical style.
█ THE ART OF ANALYSIS: A REVOLUTIONARY VISUALIZATION CORE
Data is useless if it isn't intuitive. VP-DoD shatters the mold of boring, static indicators with a state-of-the-art visualization engine. This is where data analysis becomes data art.
The Profile Itself: 14 Modes of Perception
Choose how you want to see the market's architecture:
Nebula Plasma & Quantum Matrix: Futuristic, cyberpunk aesthetics with vibrant glow effects that make HVNs and POCs pulse with energy.
Thermal Vision & Heat Shimmer: Renders the profile as a heatmap, instantly drawing your eye to the "hottest" zones of institutional liquidity.
Liquid Metal & Crystalline: Creates a tangible, almost physical representation of volume with metallic sheens, animated light flows, and faceted structures.
3D Depth Map & Prismatic Refraction: Uses layering and color channel separation to create a stunning illusion of depth, separating the profile into its core components.
Particle Field & Constellation Map: Abstract, beautiful data art modes that represent volume as animated particles or glowing stars, connecting major nodes like celestial bodies.
DNA Helix & Magnetic Field: Dynamic, animated modes that visualize the forces of attraction and repulsion around the POC and Value Area, representing the market's underlying code.
The POC & Value Area: A Living, Breathing Structure
The POC and VA are no longer static lines. They are a dynamic, interactive system designed for immediate contextual awareness:
Multi-Layered Glow Effects: The POC and VA lines are rendered with multiple layers of glowing, pulsating light, giving them a vibrant, three-dimensional presence on your chart.
Dynamic Labels & Badges: Each key level (POC, VAH, VAL) features an advanced label block showing not just the price, but the real-time distance from the current price, and a status badge (e.g., "▲ ABOVE", "◆ INSIDE") that changes color and text based on price interaction.
Intelligent Color Adaptation: The color of the VAH and VAL lines dynamically changes. A VAH line will glow bright green when price is breaking above it, but will appear dim and neutral when price is far below it, providing instant visual cues about market context.
█ ACTIONABLE INTELLIGENCE: THE SIGNAL & ALERT SYSTEM
VP-DoD is not just an analytical tool; it's a complete trading framework with a built-in, context-aware signal system.
Absorption/Distribution Signals (🏦): The "Whale Signal." Triggers when price and delta are in stark divergence, indicating large passive orders are absorbing the market—a classic institutional maneuver.
Coiling Signals (⚡): A high-probability setup that alerts you when the market is compressing (VA contracting, low entropy), storing energy for a significant breakout.
POC Shift & VA Breakout Signals: Trend-initiation signals that fire when value is migrating and the market breaks out of its established balance area with conviction.
Delta Extreme Signals: Contrarian reversal signals that detect capitulation at the extremes of buying or selling pressure, often marking key turning points.
█ THE DASHBOARD: YOUR INSTITUTIONAL COMMAND CENTER
The professional-grade dashboard provides a real-time, comprehensive overview of the market's hidden state.
Market Regime: Instantly know if the market is BALANCED, COILING, TRENDING , or VOLATILE .
Advanced Metrics: Monitor Entropy (disorder), Volatility Skew (fear/greed), and a composite Risk Score .
Institutional Score: See the calculated Liquidity Score and Conviction Level , grading the quality of the current market structure.
Bayesian AI: The crown jewel. See the real-time, AI-calculated Bull vs. Bear Confidence percentages, giving you a statistical edge on the probable direction of the next move.
Breakout Gauge: A forward-looking metric that calculates the Breakout Probability and its likely Bias (Bullish/Bearish).
█ DEVELOPMENT PHILOSOPHY
VP-DoD Ultimate was created out of a passion for revealing the hidden architecture of the market. We believe that the most profound truths are found at the intersection of rigorous science and intuitive art. This tool is the culmination of thousands of hours of research into market microstructure, statistical analysis, and data visualization. It is for the trader who is no longer satisfied with lagging indicators and seeks a deeper, more contextual understanding of the market auction. It is for the trader who believes that analysis should be not only effective but also beautiful.
VP-DoD Ultimate is designed to help you ride the trend with confidence, but more importantly, to give you the data-driven intelligence to anticipate that final, critical bend.
█ DISCLAIMER AND BEST PRACTICES
CONTEXT IS KING: This is an advanced contextual tool, not a simple "buy/sell" signal indicator. Use its intelligence to frame your trades within your own strategy.
RISK MANAGEMENT IS PARAMOUNT: All trading involves substantial risk. The signals and levels provided are based on historical data and statistical probability, not guarantees.
HTF IS YOUR GUIDE: For the highest probability setups, use the HTF feature (e.g., 240m or Daily) to identify macro structure. Then, execute trades on a lower timeframe based on interactions with these key macro levels.
ALIGN WITH THE REGIME: Pay close attention to the "Regime" and "Entropy" readouts on the dashboard. Trading a breakout strategy during a high-entropy "RANGING" regime is a low-probability endeavor. Align your strategy with the market's current state.
"The trend is your friend, except at the end where it bends."
— Ed Seykota, Market Wizard
Taking you to school. - Dskyz, Trade with Volume. Trade with Density. Trade with DAFE
Indicateur
Indicateur

Indicateur

Key levels by Chav3zNY-Time Anchored Sessions
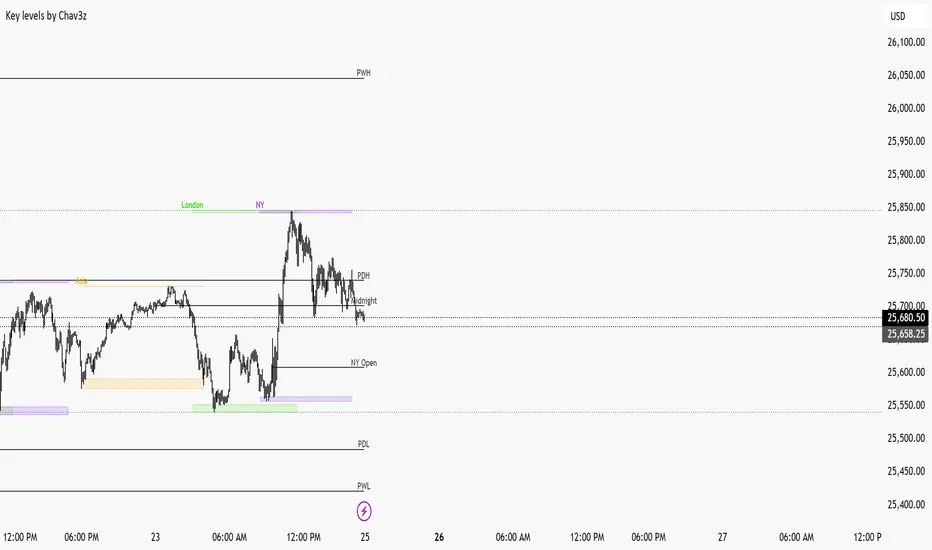
Visualizes the Asia, London, and New York sessions using customizable boxes or high/low lines. Unlike standard session indicators, this tool uses the America/New York time zone to ensure your session start and end times remain accurate throughout Daylight Savings changes.
2. Dynamic HTF Key Levels (PDH/PDL, PWH/PWL, PMH/PML)
Automatically plots the Previous Daily, Weekly, and Monthly Highs and Lows.
Clean Intraday Origin: To prevent "chart clutter," these lines do not drag across the entire historical data. They originate at the start of the current day (NY Midnight), providing a clean horizontal reference for the current trading session.
Lookback Control: Choose how many days of historical key levels you want to remain visible on your chart.
3. Custom Time-Anchored Levels
Includes two fully customizable "Price Anchors" (e.g., Midnight Open, 09:30 AM NY Open).
Origin Point Precision: Lines start exactly at the candle of the specified time (e.g., 09:30) and extend forward, rather than drawing through the pre-market.
Price Capture: Choose to anchor to the Open, High, or Low of that specific timestamp.
4. Full Aesthetic Customization
Every level (Daily, Weekly, Monthly, and Custom) can be individually styled:
Color & Visibility: Set each level to your preferred color (Defaulted to Black for a clean look).
Line Style: Toggle between Solid, Dashed, or Dotted lines.
Thickness: Adjust the line width (1px, 2px, etc.) for better visibility on high-resolution screens.
How to Use
Midnight Open: Set Level 1 to 0000 to track the Daily Open, a crucial level for determining daily bias.
NY Open: Set Level 2 to 0930 to mark the "Opening Range" anchor for the New York session.
Liquidity Targets: Use the PDH/PDL and PWH/PWL levels to identify draw-on-liquidity areas for intraday scalp or swing setups. Indicateur

Indicateur

Indicateur

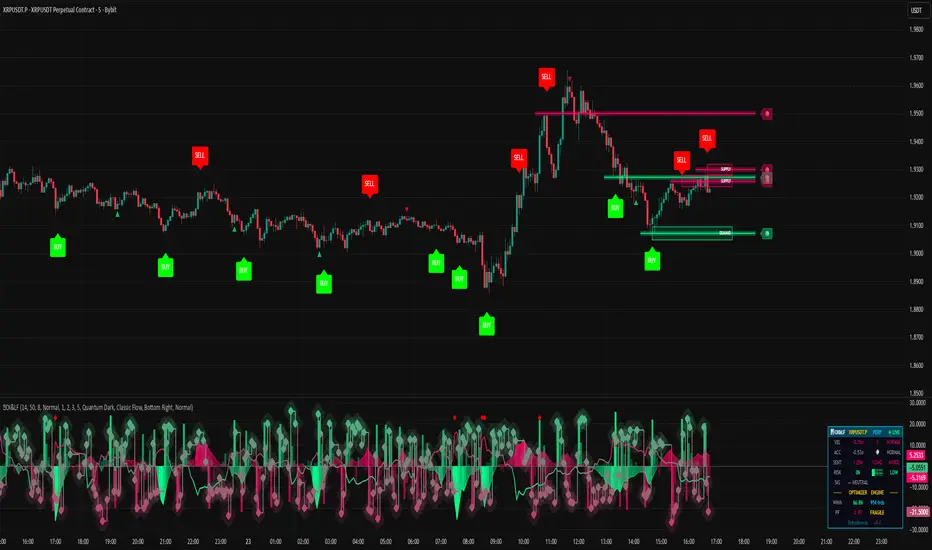
Open Interest [OI] & Liquidation Flow█ THE DUAL-ENGINE ARCHITECTURE: A FUSION OF TWO CRITICAL FORCES
The power of this suite comes from its dual-engine design. It isolates and analyzes the two opposing forces that truly drive modern markets: the informed positioning of institutions and the often-misguided sentiment of the retail crowd. A high-probability trade signal is only generated at the precise moment these two forces come into critical conflict.
ENGINE 1: The Open Interest (OI) & Position Flow Engine
This is your lens into the institutional world. Its primary function is to track the flow of money into and out of the market, revealing the true intent of large players.
Live OI Integration: In a groundbreaking feature for TradingView, this engine includes a Smart Symbol Detector that automatically seeks and integrates LIVE Open Interest data for supported markets (CME, Binance, Bybit, etc.). When available, you are seeing a direct feed of net new positions entering the market.
12-Factor Synthetic OI Model: When live OI data is not available, the engine synthesizes a high-fidelity proxy by analyzing 12 distinct factors, including Cumulative Volume Delta (CVD), Absorption, Effort vs. Result, and Institutional Bias.
Curvature Analysis: We don't just look at the flow; we analyze its Velocity and
Acceleration . A sharp acceleration in bullish OI Flow is a powerful sign that institutions are aggressively building long positions.
INTERPRETATION: This engine tells you what the "smart money" is doing. A divergence—where price is falling but OI Flow is rising—is a classic sign that institutions are quietly absorbing retail panic, often preceding a violent reversal upwards.
ENGINE 2: The Liquidation Flow & Crowd Engine
This engine operates on a powerful contrarian philosophy: the market is designed to inflict maximum pain on the largest number of participants. It identifies when the retail "herd" is over-leveraged and positioned for a fall.
Crowd Positioning Model: It analyzes factors like extreme RSI levels, deviation from Fair Value (VWAP), and "chase behavior" (e.g., many consecutive bullish candles) to determine when the retail crowd is dangerously over-exposed.
Risk Analysis: It synthesizes multiple risk factors—crowding, momentum divergence, exhaustion—into a single, easy-to-read Liquidation Risk percentage .
Fear & Greed Skew: It measures the volatility skew in the options market to provide a direct gauge of market-wide fear and greed, adding a final layer of sentimental context.
HOW TO USE IT: This is your liquidation radar. When Liquidation Risk is HIGH and the Crowd is positioned heavily LONG, the market is primed for a long squeeze (a liquidation cascade downwards). Conversely, when the Crowd is heavily SHORT, a short squeeze is highly probable.
█ THE SECRET SAUCE: UNIVERSAL ADAPTABILITY
The genius of this engine lies in its ability to work on any asset, in any timeframe, without manual recalibration. This is achieved through Z-Score Normalization . Every piece of data is converted from a raw value into a statistical score representing its deviation from the "norm." A +2.0 sigma event represents an extreme outlier, whether it's on a 1-minute chart of a crypto asset or a daily chart of a stock. This makes the signals universally comparable and allows the engine to automatically adapt to the unique volatility and character of any market.
█ THE ARSENAL: MASTERING THE VISUALS & ON-CHART TOOLS
Every visual element is a data-rich component designed for rapid, intuitive interpretation.
The Lower Pane Visualizer
This is your primary intelligence dashboard, with four distinct modes to view the underlying market forces:
Classic Flow (Default): A multi-column view perfect for spotting divergences between price and the underlying flow of money and sentiment.
Heatmap Matrix: A color-density grid designed to identify "cluster" events where multiple engines light up simultaneously, signaling institutional consensus.
Oscillator Pro: A zero-centered line visualization for traders who prefer crossover and momentum-style analysis.
Delta Waterfall: A unique cascading visualization that shows the cumulative "weight" of the market, stacking the pressure from each engine to reveal the dominant force.
Main Chart Overlays
BUY/SELL Signals: These are the primary, high-conviction reversal signals. They are not simple crossovers; they are the result of a rigorous confirmation process where institutional OI Flow directly conflicts with a vulnerable retail Liquidation Flow.
Minor Triangles (▲▼): Secondary momentum signals that are excellent for scalping, confirming a trend, or adding to a winning position.
Supply/Demand Zones: When a strong, institutionally-backed signal fires, the script automatically plots a defended zone (Red for Supply, Green for Demand), highlighting future high-probability reversal areas.
Key Levels: Automatically extends lines from significant highs and lows where a major flow reversal occurred, highlighting critical support and resistance.
High Risk Diamonds (💎): A critical risk management tool. These markers appear when conditions are ripe for a liquidation cascade. This is an explicit warning to take profits or stand aside.
The Dashboard (HUD)
Your at-a-glance command center, displaying real-time, mission-critical data:
Z-Scores for OI Flow Velocity & Acceleration: See the raw, normalized momentum of the institutional flow.
Crowd Sentiment Status: Instantly know if the market is dangerously "CROWDED" or balanced.
Liquidation Risk %: A numerical gauge from 0-100% showing the probability of a violent flush.
Live Data Status: Confirms whether the engine is using LIVE OI data or the PRO synthetic model.
Optimizer Readout: When enabled, shows the backtest results of your current settings.
█ THE COMMAND CENTER: MASTERING THE INPUTS
This suite offers deep customization for the professional trader.
Analysis Length: The "memory" of the flow engine. Use shorter lengths (10-14) for scalping and longer lengths (21+) for swing trading.
Signal Sensitivity: A master control to switch between Conservative (fewer, higher-quality signals), Normal (balanced), and Aggressive (more frequent signals for scalping) modes.
Display Toggles: Individually enable or disable any of the core components in the lower pane to create your perfect analytical view.
Overlay Controls: Individually toggle all on-chart visuals and control the maximum number of Zones and Key Levels to maintain a clean workspace.
█ THE OPTIMIZER ENGINE: VALIDATE BEFORE YOU TRADE
Confidence comes from data. The built-in Optimizer Engine is a powerful backtester that runs on your chart's visible data. It allows you to rapidly test different ATR-based Take Profit and Stop Loss parameters, providing key metrics like Win Rate, Profit Factor, and a proprietary Stability Rating ( ROBUST, STABLE, FRAGILE, OVERFIT ) to help you find the most statistically sound settings for your specific asset and timeframe before risking capital.
█ DEVELOPMENT PHILOSOPHY
This indicator was born from a single, guiding principle: to win in modern markets, you must stop listening to the noise of price and start analyzing the signal of flow. Price is where amateurs look; flow is where professionals find their edge. This tool is our attempt to level the playing field, translating the opaque world of derivatives and institutional positioning into a clear, intuitive, and actionable intelligence system.
This tool is for the serious student of the market—the trader who seeks to understand the "why" behind the move, not just the "what."
█ DISCLAIMER AND BEST PRACTICES
THIS IS AN ADVANCED ANALYTICAL TOOL: This indicator provides intelligence, not financial advice. It should be used as a core component of a comprehensive trading strategy that includes your own analysis of market structure and risk management.
RISK MANAGEMENT IS PARAMOUNT: All trading involves substantial risk. Never risk more capital than you are prepared to lose. This indicator does not guarantee profits.
SIGNAL HIERARCHY IS KEY: Treat the main BUY/SELL labels as your primary signals. Use the minor triangles to add to positions or for scalping. Use the High Risk diamonds as a signal to reduce exposure and take profits.
MULTI-TIMEFRAME ANALYSIS: For the highest probability setups, use the indicator on a higher timeframe (e.g., 1H) to establish an institutional bias, then take signals on a lower timeframe (e.g., 5m) that align with that bias.
"The game of speculation is the most uniformly fascinating game in the world. But it is not a game for the stupid, the mentally lazy, the person of inferior emotional balance, or the get-rich-quick adventurer. They will die poor."
— Jesse Livermore
Taking you to school. - Dskyz, Trade with Open Interest. Trade with Liquidity. Trade with Open Interest & Liquidation Flow Indicateur

AI-Enhanced MSS HunterAI-Enhanced MSS Hunter
This indicator is a hybrid trading system that merges Mechanical Price Action (ICT Concepts) with Statistical Machine Learning (K-Nearest Neighbors). It is designed to assist traders in identifying high-probability reversals after liquidity sweeps, as well as trend-continuation entries during specific "Kill Zone" sessions.
How It Works
The script operates on a strict 3-step validation process to filter out false signals during choppy market conditions.
1. Liquidity Sweep (The Trigger) The system automatically plots the Previous Day High (PDH) and Previous Day Low (PDL).
The logic begins only when price "sweeps" (breaks) one of these key levels.
State Persistence: Once a level is swept, the system remembers this event for the remainder of the session (or until a signal fires), waiting for the market to reverse.
2. Market Structure Shift (The Setup) After a sweep, the indicator hunts for a Market Structure Shift (MSS).
It tracks dynamic Swing Highs and Swing Lows.
A signal is prepared only if price breaks a recent structural swing point in the opposite direction of the sweep (e.g., Sweep PDL -> Break Swing High).
3. AI / Machine Learning Filter (The Confirmation) To reduce false positives, the signal must be confirmed by a K-Nearest Neighbors (KNN) algorithm.
The Logic: The script analyzes the current values of RSI (14), CCI (14), and ROC (10).
The Comparison: It looks back at the last ~1,000 bars of history to find similar market conditions (neighbors).
The Prediction: If the majority of those historical "neighbors" resulted in a favorable move, the AI confirms the trade. If historical data suggests chop or reversal, the signal is blocked.
Key Features
🎯 Primary Reversal Signals (Circles)
Green Circle: Price swept PDL + Bullish MSS + AI Confirmation.
Red Circle: Price swept PDH + Bearish MSS + AI Confirmation.
♻️ Golden Zone Re-Entries (Triangles) Once a Primary Signal is active, the script tracks the new trend leg.
It automatically draws a dynamic Golden Zone (0.5 – 0.618 Fibonacci Retracement).
If price pulls back into this zone and forms a new MSS, a Re-Entry Triangle is plotted.
Invalidation: If the pullback breaks the original setup's low/high, the zone is removed to prevent bad trades.
⏰ Kill Zone Time Filters Signals are filtered by time to ensure you are trading during high-volume sessions.
Default AM Session: 08:30 – 10:00 (New York Time)
Default PM Session: 14:00 – 15:00 (New York Time)
Fully customizable in settings.
Settings Guide
Key Levels: Toggle PDH/PDL lines and customize colors.
Kill Zones: Enable/Disable time filtering and highlight background colors.
AI Settings:
K-Nearest Neighbors (k): Number of historical neighbors to compare (Default: 5).
Training Window: How far back the AI looks for patterns (Default: 1000 bars).
Visuals: Turn on/off the Golden Zone fib clouds or text labels.
Disclaimer
This tool is for educational purposes only. The "AI" component is a statistical classification algorithm based on historical momentum and does not guarantee future results. Always manage risk and use this indicator as part of a comprehensive trading plan. Indicateur

MTF EMA Trend Table (50/100/200)Using the MTF EMA Trend Table for Supply & Demand Trading
This document explains how to use the Multi‑Timeframe EMA Trend Table as part of a supply and demand trading strategy.
The indicator displays the trend direction (Bullish or Bearish) for EMA 50, 100, and 200 across the following timeframes: 5m, 15m, 30m, 1h, 4h, 1d, and 1w.
---------------------------------------------
1. What the Indicator Shows
---------------------------------------------
The EMA Trend Table instantly reveals whether price is trading above or below the EMA 50/100/200 on multiple timeframes.
• Price above EMA = Bullish trend
• Price below EMA = Bearish trend
This allows you to identify trend alignment across all key timeframes.
---------------------------------------------
2. Why EMAs Matter in Supply & Demand Trading
---------------------------------------------
Supply & Demand zones show where institutions previously bought or sold aggressively. To trade these zones effectively, you must confirm higher‑timeframe trend direction.
The EMA table prevents low‑probability trades by keeping you aligned with institutional flow.
---------------------------------------------
3. How to Use the Indicator for Supply & Demand Trading
---------------------------------------------
Step 1 — Identify Higher‑Timeframe Bias (4H, 1D, 1W)
• Bullish alignment (all green) → Trade demand zones only.
• Bearish alignment (all red) → Trade supply zones only.
Step 2 — Use 1H, 30M, 15M for Setup Timing
These mid‑timeframes help you determine when a pullback is nearing completion.
Step 3 — Trigger Entry on the 5M EMA Flip
Once price enters a supply or demand zone, wait for the 5m EMA trend to flip in your direction before entering.
---------------------------------------------
4. How to Judge Zone Strength Using EMAs
---------------------------------------------
Strong Demand Zone Characteristics:
• Price above EMA200 on 1H+
• Zone forms above EMA200
• Pullback touches EMA50 or EMA100
Strong Supply Zone Characteristics:
• Price below EMA200 on 1H+
• Zone forms below EMA200
• Pullback touches EMA50 or EMA100
---------------------------------------------
5. Full Trade Example
---------------------------------------------
Higher timeframes are bullish: 1W, 1D, 4H all green.
Price pulls back into a 15m demand zone.
5m flips from Bearish → Bullish.
This is the entry confirmation.
---------------------------------------------
6. Why This Indicator Improves Your Trading
---------------------------------------------
• Confirms trend direction
• Shows alignment across timeframes
• Helps avoid counter‑trend traps
• Improves zone accuracy and confidence
• Enhances timing using the 5m EMA flip
This combination is ideal for institutional‑style supply and demand trading.
Indicateur

Session Liquidity & FibsThis is a comprehensive, all-in-one toolkit designed for traders utilizing ICT concepts and time-based liquidity runs. The Session Liquidity & Fibs indicator automates the tedious process of marking up charts, allowing you to focus on price action and execution.
This indicator focuses on "Reverse Engineering" the daily narrative by plotting key sessions, mitigation lines, specific Fibonacci retracement setups, and Higher Timeframe (HTF) liquidity pools automatically.
Key Features:
1. Dynamic Session Killzones Automatically highlights key trading sessions with customizable boxes and extends the High/Low liquidity lines forward until they are mitigated (hit by price).
Asia Range: (Default 20:00 - 00:00)
London Session: (Default 02:00 - 05:00)
NY AM Session: (Default 09:30 - 11:00)
NY PM Session: (Default 13:30 - 16:00)
Note: Lines automatically cut off once price trades through them, keeping your chart clean.
2. Institutional Fibonacci Setups Auto-drawing Fibonacci anchors based on specific time windows to identify OTE (Optimal Trade Entry) and key extensions.
Overnight Fib: Measures the range from 18:00 to 05:00.
9 AM "Silver Bullet" Fib: Measures the 09:00 - 10:00 candle range to determine the morning bias.
Includes standard institutional levels (0, 1, 0.236, 0.786).
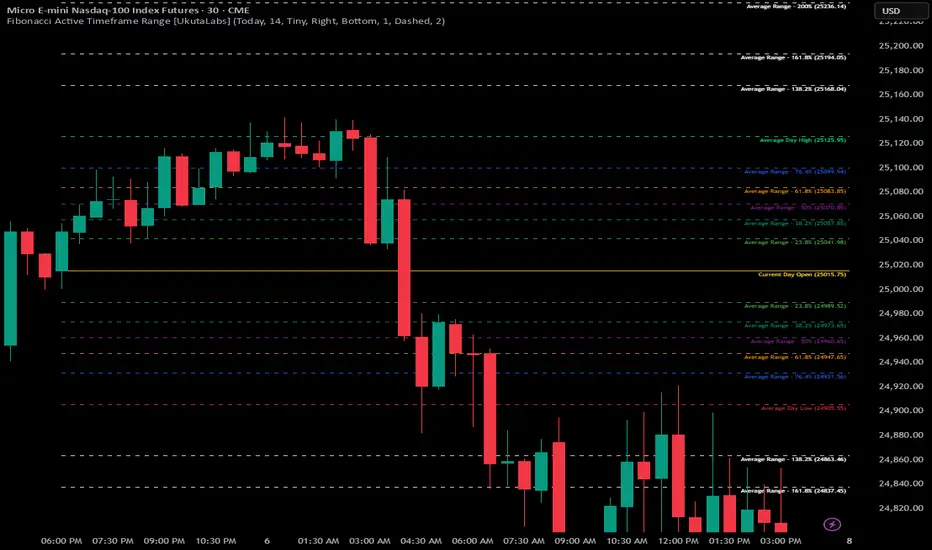
3. Higher Timeframe (HTF) Matrix Never lose track of the bigger picture. This tool plots major liquidity levels from higher timeframes onto your intraday chart:
Daily: True Day Open (TDO), Previous Day High/Low (PDH/PDL), and Daily Equilibrium (50%).
Weekly: Previous Week High/Low and Weekly Equilibrium.
Macro: Monthly and Quarterly Highs/Lows + 50% levels.
4. Price Action Helpers
Engulfing / Outside Bar Detector: Highlights bars that fully engulf the previous candle's range (Higher High & Lower Low). These are often key volatility candles used to draw manual Fibonacci ranges or identify immediate reversals.
Previous Bar 50%: Automatically marks the midpoint of the previous candle, useful for immediate rebalancing entries.
Settings & Customization:
Fully customizable colors for every session and level.
Toggle any feature on or off to suit your specific strategy.
Adjustable lookback history to manage chart load.
Usage: This indicator is best used on intraday timeframes (1m, 5m, 15m) for Futures (NQ, ES) and Forex pairs. It is designed to help you spot liquidity sweeps and session reversals without manually drawing every box and line.
This indicator is a Work In Progress. I created this tool primarily for myself to consolidate everything I need for my personal trading style into a single, efficient indicator. However, I am sharing it in case others find it useful. If you are using this and have requests for changes or ideas on how to make it better, please leave a comment or reach out, I will look into what I can do to improve it. Indicateur

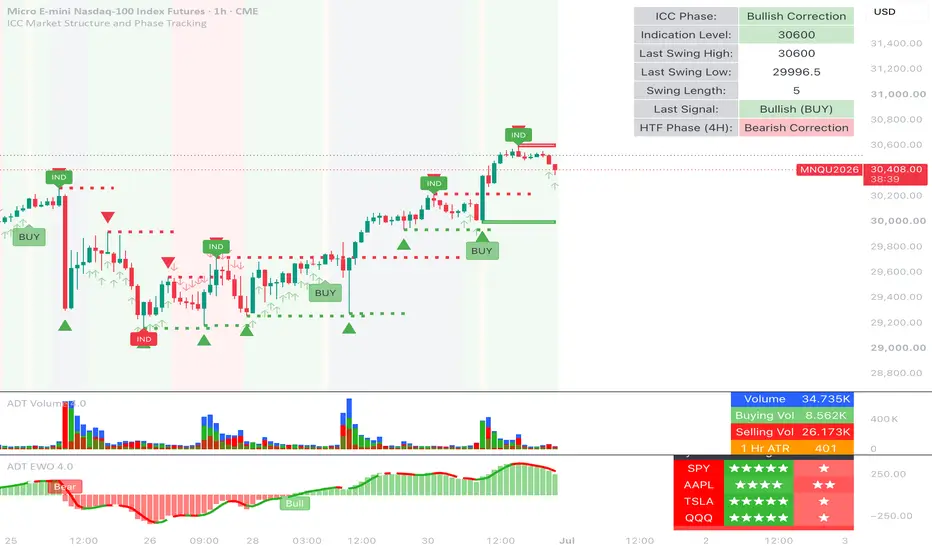
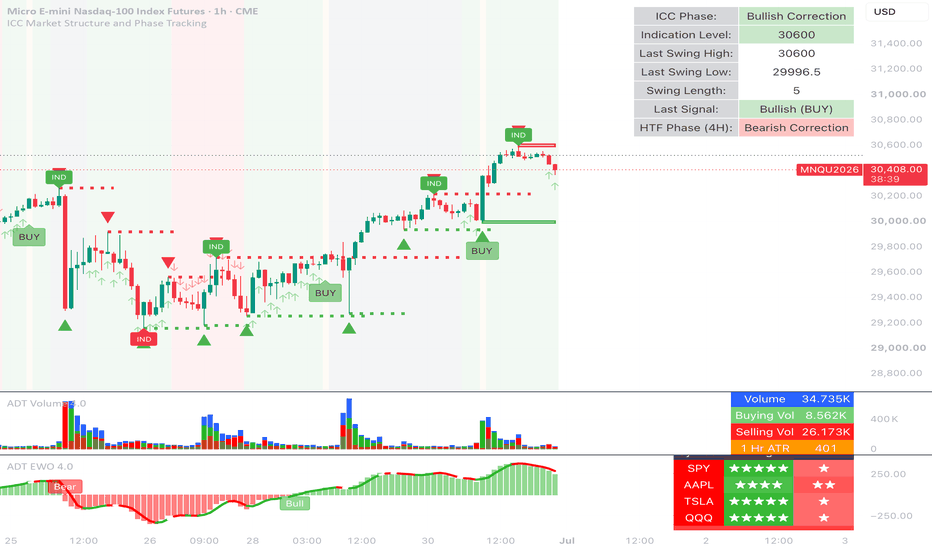
ICC Market Structure and Phase TrackingICC Market Structure and Phase Tracker
ICC Market Structure and Phase Tracker is a visual market-structure indicator based on the Indication → Correction → Continuation (ICC) framework — a structured approach to analyzing break-of-structure, pullback, consolidation, and trend-continuation phases.
The script focuses on identifying structural phases, key levels, and phase transitions across multiple timeframes, providing clear contextual market structure information.
What the Indicator Identifies
The indicator tracks complete market-structure cycles by classifying price action into the following phases:
Indication — initial structural break or trend initiation
Correction — pullback, retracement, or consolidation following the break
Continuation — expansion or impulse in the direction of structure
Neutral / No Setup — periods without valid structural conditions Each phase is visually distinguished on the chart for fast, at-a-glance structural awareness.
CORE FEATURES
Market Structure & Phase Tracking
Automatic detection of structural breaks, corrections, consolidations, and continuations
Background shading to clearly distinguish phases
Invalidation logic to identify failed or broken structures Multi-Timeframe Context
Optional higher-timeframe (HTF) structure displayed on lower-timeframe charts
HTF indication levels shown as reference lines
HTF phase and context displayed in the information table Structure Event Visualization
Visual markers for continuation and optional reversal structures
Clear visual separation between trend-aligned and counter-structure events
Reversal structure visualization can be enabled or disabled in settings Volatility-Aware Structure Zones
Structure-based support and resistance zones
Optional ATR-based zone sizing that adapts to market volatility
Configurable historical zones (0–3) with visual hierarchy Information Table
Displays current ICC phase, indication level, consolidation status, and HTF context
Designed for quick reference without relying solely on chart visuals Alerts
Alerts trigger only when corresponding visual conditions appear on the chart
Includes alerts for ICC phases, continuation structures, and optional reversals Configuration Overview
Auto Profiles for different trading contexts (Scalping, Intraday, Swing, Entry)
Manual controls for swing length, consolidation behavior, and volatility settings
Higher-timeframe controls for filtering and visual alignment
Reversal toggle to enable or disable counter-structure visualization Default settings are intended as reasonable starting points and can be adjusted for different instruments and timeframes.
Intended Use
This script is designed as a market-structure and contextual analysis tool.
Users are expected to apply their own analysis, validation, and risk management when interpreting the displayed structure.
Feedback
Bug reports, edge cases, and constructive feedback are welcome.
The project is actively refined with a focus on structure clarity, phase accuracy, and multi-timeframe usability. Indicateur
Indicateur

Indicateur

Indicateur
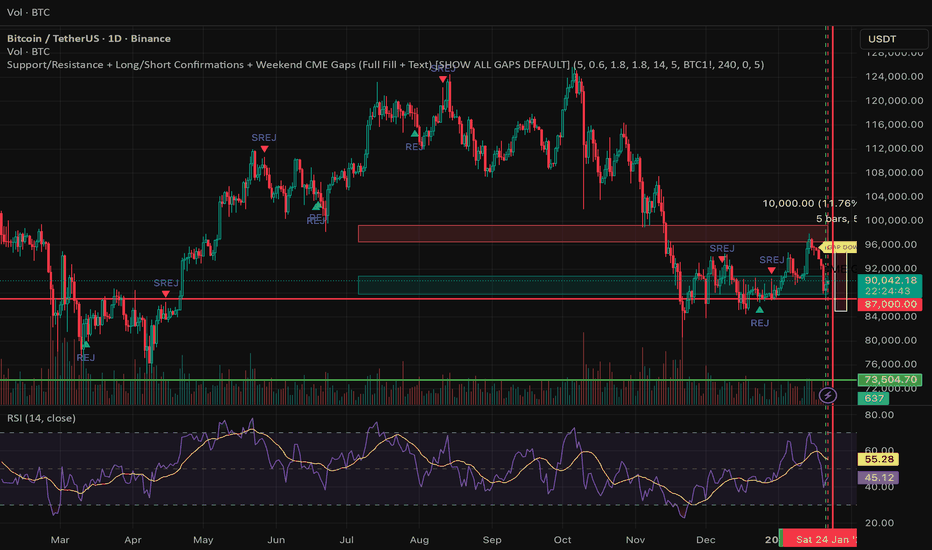
UT Bot Alerts [2026 Elite Edition]🚀 Overview
The UT Bot 2026 Elite Edition is the ultimate evolution of the legendary volatility trading system originally conceptualized by QuantNomad. While the original tool revolutionized trend following, this "Elite Edition" introduces Asymmetric Sensitivity—a professional feature that acknowledges a fundamental market truth: Assets do not fall the same way they rise.
This script allows you to decouple your Long and Short strategies, offering surgical precision for both bull runs and bear crashes, all while monitoring trade health via a new real-time Safety Dashboard.
🧠 The Logic: Why "Elite"?
Most trailing stop systems use a single setting (e.g., Key: 2, ATR: 10) for both buying and selling. This is efficient but often suboptimal.
Bull Markets often grind up slowly (requiring looser stops to avoid shakeouts).
Bear Markets often crash quickly (requiring tighter, faster stops to protect capital).
The Dual-Engine Solution: This script runs two separate calculation engines simultaneously:
The Buy Engine (Ceiling): Calculates the resistance ceiling using its own Sensitivity (Key) and Smoothness (ATR) settings.
The Sell Engine (Floor): Calculates the support floor using entirely different settings.
This means you can have a "Slow & Steady" settings for buying Bitcoin, but a "Fast & Aggressive" setting for shorting it, all within the same indicator.
✨ Key Features
1. Asymmetric "Dual-Key" Sensitivity
Buy Key & ATR: Tune your entry sensitivity for long positions.
Sell Key & ATR: Tune your short parameters independently.
Why this matters: You can now set a wide stop for trending up, but a tight stop for trending down to capture profit instantly when momentum breaks.
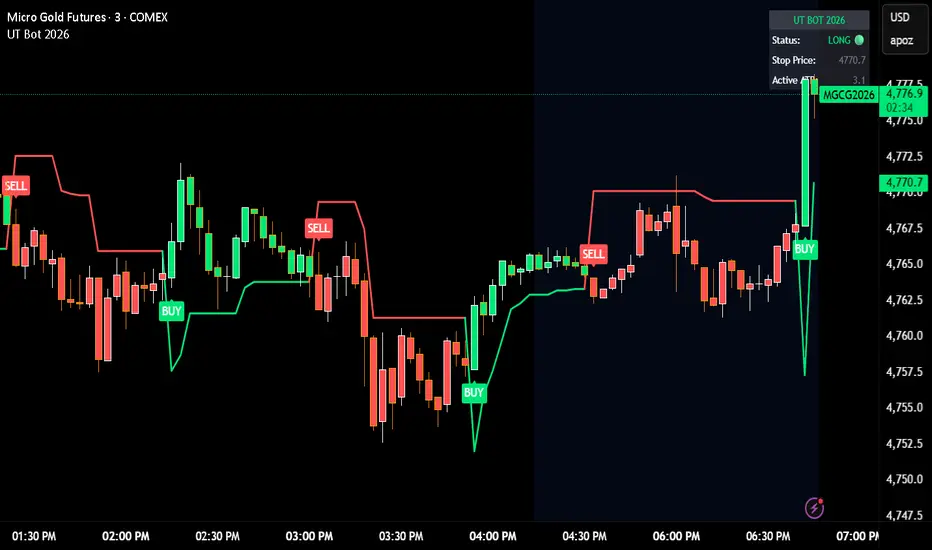
2. The Safety Dashboard (HUD) A professional Heads-Up Display (HUD) located in the top-right corner. It provides critical "Flight Data" that simple buy/sell labels hide:
Status: Instantly see if you are net Long or Short.
Stop Price (The Kill Level): The exact price where the trend will flip. Use this for your hard Stop Loss orders.
Active ATR: Displays the current volatility width. High ATR = High Volatility (Wide Stops). Low ATR = Consolidation (Tight Stops).
3. Heikin Ashi Smoothing
Includes a built-in toggle to calculate signals based on Heikin Ashi candles while viewing standard candles. This filters out "noise" and wicks, often keeping you in a trend longer.
4. Pine Script v6 Optimization
Refactored for the latest Pine Script v6 standards, ensuring faster execution and compatibility with the latest TradingView features.
🛠️ How to Use (Best Practices)
For Scalping (1m - 5m Timeframes):
Suggestion: Set Sell Key lower (e.g., 1.5) and Sell ATR lower (e.g., 5) to react quickly to drops. Keep Buy Key higher to avoid choppy fake-outs. I personally use the default settings on the 3M time frame with Gold and NQ with a high rate of success.
For Swing Trading (4h - Daily):
Suggestion: Increase Buy ATR (e.g., 30-100) to smooth out the noise of daily fluctuations.
The Dashboard:
Always check the Stop Price on the dashboard before entering. If the Stop Price is too far away from the current price, your risk might be too high for the trade size.
🙏 Credits & Appreciation
This script stands on the shoulders of giants.
Original Logic: Huge props and credit to QuantNomad for the original UT Bot strategy. His work laid the foundation for volatility-based trailing stops on TradingView.
Concept: Based on the "Ceiling/Floor" volatility theory.
Development: Enhanced and refactored by for the 2026 market environment.
Disclaimer: This tool is for information purposes only. Past performance does not guarantee future results. Indicateur