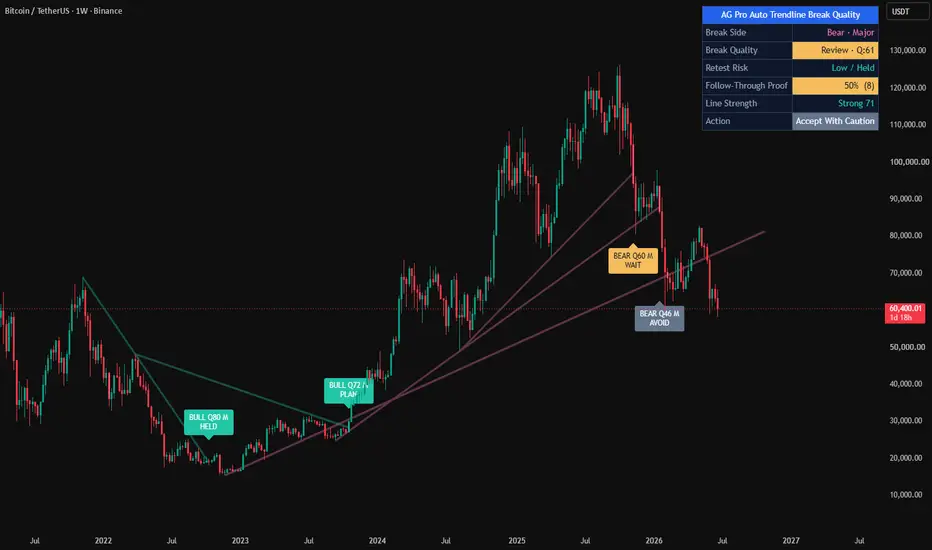
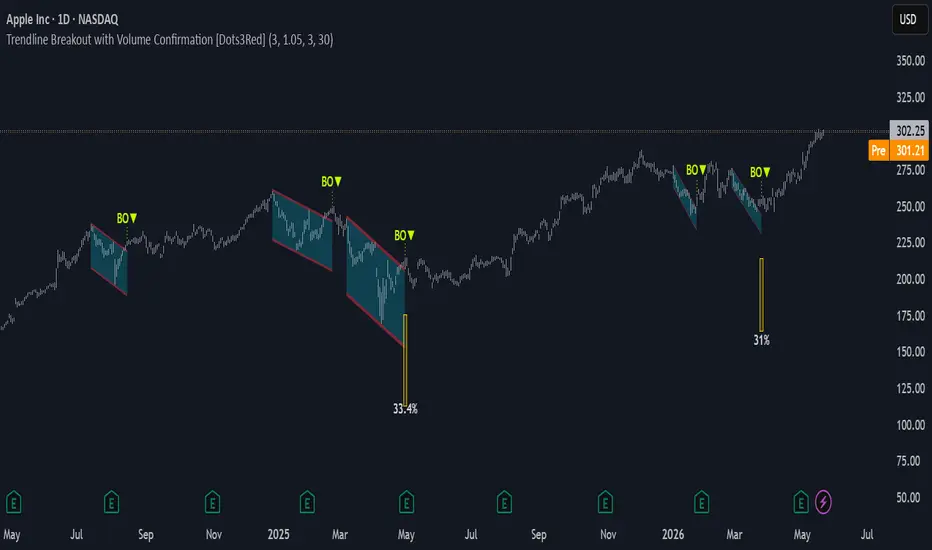
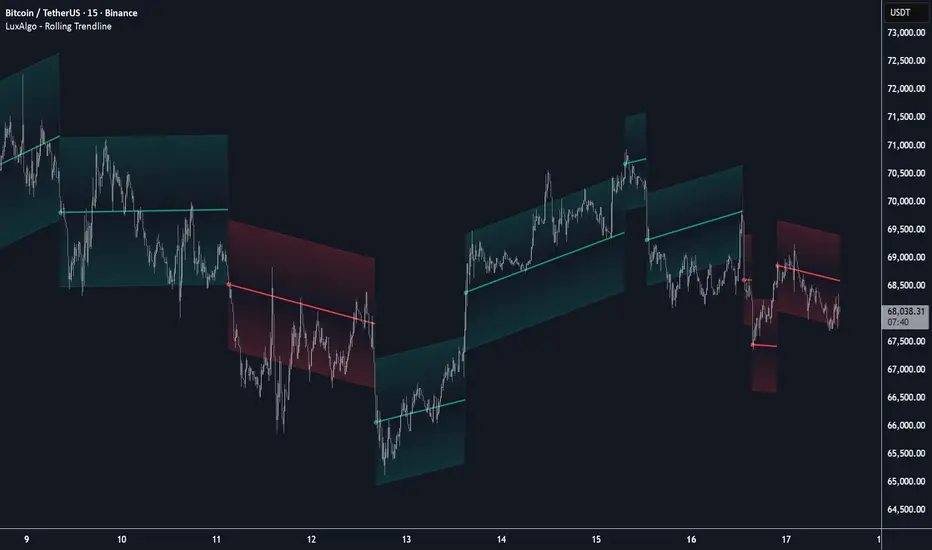
Auto Trendline Break Quality [AGPro Series]Auto Trendline Break Quality
🔹 OVERVIEW
Auto Trendline Break Quality is a structural break-quality engine. It automatically detects bullish and bearish trendlines from swing pivots, monitors every break event in real time, and assigns each break a 0–100 quality score derived from four independent quantitative factors. The tool separates Major (structural) and Minor (tactical) trendlines, so the same break can be evaluated against multiple layers of market structure at once.
The script is purpose-built to answer the single most practical question a price-action trader faces at a trendline break: "Is this break real, or is it a fake-out?"
🧭 UNIQUE EDGE
Most trendline scripts either draw trendlines or flag a break. They stop there. This indicator continues where they stop — and measures the break.
Key differentiators:
• Four-factor composite quality score (Volume · Slope · Impulse · Retest) calibrated to ATR, so the scoring is consistent across assets and timeframes.
• Major/Minor trendline hierarchy. A Major structural break automatically earns a score bonus and is visually flagged with a "MAJ" tag, so structural breaks are never confused with noise breaks.
• State-based visual language. Active trendlines render in a neutral tone. On break, the trendline transitions to the break-direction color (bullish break = bull color, bearish break = bear color), so the chart communicates state without ambiguity.
• Retest logic built directly into the score. A break that is retested and holds within the defined window receives an upgrade; a failed retest downgrades the score. The chart label reflects the final, updated quality.
• Optional zone-band rendering around Major trendlines, letting the user see each structural line as a reaction zone rather than a bare line.
• Label confluence grouping to prevent chart clutter when multiple breaks occur near the same price level.
⚙️ METHODOLOGY
1) Trendline detection
Pivots are identified using standard pivot-high and pivot-low logic with two configurable lookbacks — one for Major trendlines and one for Minor. A new trendline is validated between the two most recent same-side pivots when the slope (ATR-normalized) exceeds the minimum threshold. Nearly-flat trendlines are rejected by design.
2) Break detection
A trendline is considered broken when the current candle closes on the opposite side of the projected line while the previous candle closed on the valid side. This one-bar confirmation rule avoids intra-bar flicker.
3) Quality scoring (0–100)
• Volume expansion vs 20-bar average — up to 25 points
• ATR-normalized slope steepness — up to 20 points
• Break-bar impulse measured in ATR from the line — up to 25 points
• Retest base score — 18 points, upgraded by +15 on a held retest, or reduced by 10 on a failed retest
• Major trendline bonus — +10 points
4) Retest tracking
After a break, the script watches a configurable window (default 3–8 bars) for price to return to the broken trendline within an ATR tolerance. Held retests and failed retests are tracked independently and reflected in the panel's Retest Held Rate. Retest markers are offset from the trendline in ATR units to prevent overlap with candles.
📊 SIGNALS & STATES
• Break label: "BREAK Q: · " and an optional "MAJ" tag for Major trendlines. Label color tier: High quality renders in full state color, Medium quality in neutral amber, Low quality in a muted tone.
• Retest marker: Small circular marker with "retest held" or "retest failed" text, offset from the trendline for clarity.
• Break bar border: Optional candle-border color that reflects break direction.
• Panel: Active trendlines per side, last break score and direction, overall break-direction breakdown, retest held rate, quality distribution (High/Medium/Low), total breaks tracked, and the current detection mode.
• Alerts: "High Quality Trendline Break" and "Major Trendline Break" — both standard alertcondition entries.
🎛️ KEY INPUTS
• Major / Minor Pivot Length — controls how many bars each side of a pivot must be a local extreme.
• Show Minor Trendlines — toggle tactical layer on top of structural layer.
• Max Active Trendlines per Side — caps the chart clutter.
• Volume Spike Threshold (x Avg) — ratio at which a volume expansion is considered full.
• Retest Min/Max Bars — bar range for a valid retest.
• Retest Tolerance (ATR) — how close price must come to the broken line to count as a retest.
• High / Medium Quality Thresholds — cutoffs for the three quality tiers (defaults: 70 / 50).
• Show Trendline Zone Band — renders a subtle ATR-based band around Major trendlines.
• Zone Band Width (ATR) — controls the thickness of the zone band.
• Label Confluence Grouping (ATR) — merges break labels that land within this ATR distance on nearby bars.
• Label Offset (ATR) — vertical padding so labels never embed in candles.
• Label / Panel / Help font sizes — all default to Normal.
• Panel Position and Theme — six positions, Dark/Light theme.
🧩 HOW TO USE
The indicator is a decision-support layer, not a standalone trading system.
• Treat a break with Q ≥ 70 and a "MAJ" tag as a structural event worth reviewing the higher-timeframe bias for.
• Use the retest window as a patience filter. A break with Q 55–69 that retests and holds often upgrades to a higher-quality setup after the retest.
• Failed retests are not "bad" — they are information. A failed retest on a low-quality break is a strong hint that the break was noise.
• The neutral-color active trendlines are intentional — they tell you where structure exists without biasing your read. Color appears only when structure breaks.
• Combine with your own confluence (volume profile, horizontal support/resistance, higher-timeframe trend). The script does not enter trades; it tells you how reliable a break looks at the moment it happens.
⚠️ LIMITATIONS & TRANSPARENCY
• Quality scores describe historical pattern behavior. They are not predictive probabilities.
• Trendlines are generated from pivots; the final pivot is always confirmed after the pivot-length bars have elapsed. This is standard pivot behavior and is not a repaint of historical marks — past labels remain fixed once a break bar closes.
• The script draws up to the platform's line/label limits. Older trendlines are removed when the active cap is reached.
• Parameter defaults target 4H–1D charts; lower timeframes benefit from smaller pivot lengths and tighter retest windows.
📜 RISK DISCLOSURE
This script is an analytical tool. It does not provide financial advice, investment recommendations, or a trading strategy. Past performance of any pattern, including trendline breaks, does not guarantee future results. Always perform your own analysis and apply proper risk management before making any trading decision. Indicateur

Prism Channel Architecture [JOAT]Prism Channel Architecture
Introduction
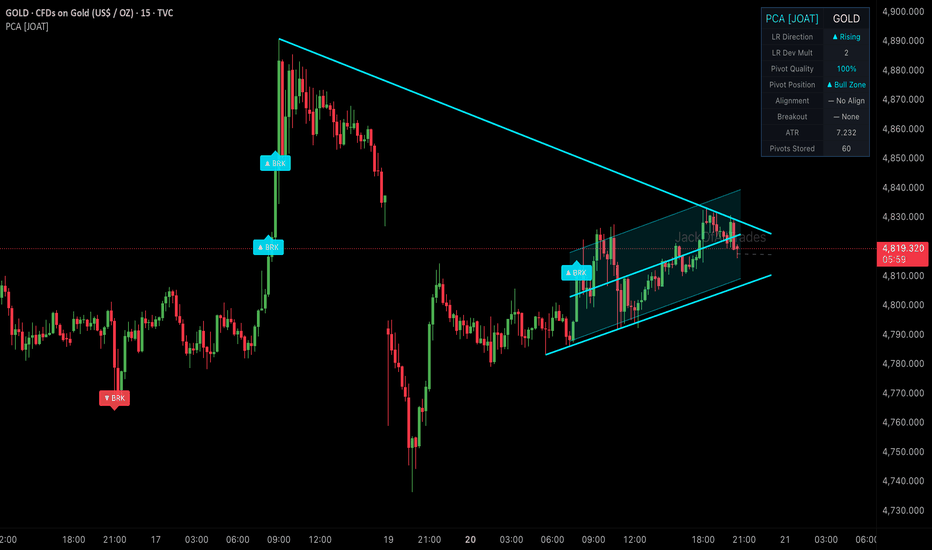
Prism Channel Architecture is a dual-channel overlay indicator that layers two mathematically distinct structural frameworks onto your price chart simultaneously: a best-fit Pivot Channel derived from actual price pivot points, and a Linear Regression Channel built from statistical least-squares fitting. Together they create a structural prism through which trend direction, channel quality, and breakout momentum can be evaluated from multiple angles at once.
Most channel tools force you to choose between objectivity and responsiveness. Pivot channels adapt to real market structure but can lag. Regression channels are statistically rigorous but ignore actual swing highs and lows. PCA runs both engines in parallel and highlights the moments when they agree — bull alignment and bear alignment states — as the highest-conviction reads in the system.
Core Concepts
Pivot Channel Fitting
The indicator collects up to a configurable maximum of confirmed pivot highs and pivot lows using TradingView's built-in pivot functions:
float pivHigh = ta.pivothigh(high, pivLeft, pivRight)
float pivLow = ta.pivotlow( low, pivLeft, pivRight)
From those stored pivot arrays, it searches for the best pair of recent pivot highs to fit the upper channel boundary, and the best pair of recent pivot lows to fit the lower channel boundary. The quality score for each candidate pair is computed by checking how many of the recent bars were actually contained below the upper line (or above the lower line) within an ATR tolerance:
for k = 0 to checks - 1
float lineY = linePrice(x2, y2, x1, y1, bar_index - k)
if high <= lineY + atrVal * 0.3
contained += 1
float q = safeDiv(float(contained), float(checks), 0.0)
The pair with the highest containment ratio wins and becomes the drawn channel. This means the upper channel line is always the tightest valid resistance line through recent pivot highs, not an arbitrary parallel projection.
Linear Regression Channel
The regression channel computes a full manual least-squares fit over the lookback window, producing slope, intercept, and residual standard deviation:
float slope = safeDiv(n * sumXY - sumX * sumY, n * sumXSq - sumX * sumX, 0.0)
float intc = safeDiv(sumY - slope * sumX, n, close)
float stdDev = math.sqrt(safeDiv(ssRes, n, 0.0))
The upper and lower bands are drawn at `stdDev × Deviation Multiplier` distance from the regression midline, giving bands that are statistically calibrated to the actual spread of price around the trend. Color shifts from bull to bear when slope changes sign.
Channel Alignment Confluence
The system declares a Bull Alignment when both channels simultaneously agree price is in a bullish position — the regression slope is rising AND price is above the regression midline, AND price is in the upper half of the pivot channel (between the midline and the upper band):
bool lrBull = close > midNow and slope > 0.0
bool pivBull = close > uMid and close < uNow
bool alignBull = lrBull and pivBull
This confluence state is highlighted with a subtle background color — a quiet but meaningful signal that two independent structural frameworks are pointing in the same direction.
ATR-Based Breakout Detection
Breakout signals fire when price moves more than a configurable ATR multiple beyond the prior bar, provided the regression slope confirms direction:
bool brkUp = ta.crossover(close, close + crossTol * atrVal) and lrSlope > 0.0
bool brkDn = ta.crossunder(close, close - crossTol * atrVal) and lrSlope < 0.0
Breakout labels (▲ BRK / ▼ BRK) appear above or below the breakout bar and are alert-enabled.
Features
Pivot Channel — best-fit upper/lower boundaries through recent pivot highs/lows, quality-scored by containment ratio
Regression Channel — least-squares midline with statistically calibrated deviation bands, auto-colored by slope direction
Channel midline — dashed neutral midline bisecting the pivot channel for zone positioning
Bull and Bear Alignment detection — background highlight when both channels agree on direction
ATR-normalized breakout labels — ▲ BRK and ▼ BRK when price breaks out with trend confirmation
Channel Quality score — displayed in dashboard as percentage of recent bars contained
Pivot position classification — Bull Zone (upper half) or Bear Zone (lower half)
Up to 40 pivot highs and 40 pivot lows stored and evaluated
10-bar channel projection extended to the right of the last bar
Dashboard: LR direction, deviation mult, pivot quality, pivot position, alignment, breakout, ATR, pivot count
Alerts for bullish breakout, bearish breakout, bull alignment, and bear alignment
Webhook JSON alert format
Watermark
Input Parameters
Pivot Channel
Pivot Lookback Left — bars to the left required to confirm a pivot high or low (default 10)
Pivot Lookback Right — bars to the right required to confirm a pivot high or low (default 5)
Max Pivots Stored — maximum number of pivot highs and lows held in memory (default 30)
Quality Check Length — number of recent bars used to score channel containment (default 20)
Breakout ATR Mult — ATR multiplier threshold for breakout label generation (default 1.5)
Show Pivot Channel — toggle the pivot channel lines on/off
Regression Channel
Regression Length — bars used in the least-squares fit (default 50)
Deviation Mult — standard deviation multiplier for band width (default 2.0)
Show Regression Channel — toggle the regression channel lines and fill on/off
ATR Settings
ATR Length — lookback for ATR calculation used in breakout detection and containment tolerance (default 14)
Visuals
Bull Color — color for uptrending channels and bullish labels
Bear Color — color for downtrending channels and bearish labels
Neutral Color — color for channel midlines and neutral dashboard text
Show Dashboard — compact structural summary panel
Show Watermark
Show Breakout Labels — toggle ▲ BRK / ▼ BRK label markers
Alerts
Webhook JSON Format — switches alert messages to JSON format for automation pipelines
How to Use
Add PCA to your chart as a main-pane overlay indicator.
Let the chart load enough history so both channels initialize. A warmup period of at least 60 bars is enforced before channels begin drawing.
Use the Regression Channel to assess macro trend direction. If the midline slope is rising and price is above it, the macro environment is bullish.
Use the Pivot Channel to identify the structural support and resistance boundaries formed by actual price pivots. The upper pivot line is the tightest valid resistance. The lower pivot line is the strongest structural support.
Watch for Bull Alignment (cyan background) when both systems agree price is in a bullish structural position. This is the highest-conviction environment for long setups.
Watch for Bear Alignment (red background) for bearish structural setups.
Treat Breakout labels as momentum confirmation signals — they only fire when an ATR-significant price move occurs in the direction of the regression slope.
Check the Pivot Quality score in the dashboard. A quality above 65% means the channels are actively containing price well. Below 40% means the channel fit is loose and breakouts are less reliable.
Indicator Limitations
Pivot channel fitting evaluates only the 8 most recent pivot highs and the 8 most recent pivot lows when searching for the best pair. In very choppy markets with many closely-spaced pivots, the fitted channel may appear narrow or erratic.
The regression channel is recalculated on every bar over a fixed lookback window. It will repaint the past visually as new bars are added — the channel reflects the lookback window ending at the current bar, not a fixed historical period.
Channel quality scores can be artificially high in low-volatility trending conditions where price barely touches the edges of the channel.
Breakout signals require both an ATR threshold move AND a confirming regression slope. In sideways markets the slope condition filters out most breakout candidates, which may lead to missed signals on genuine horizontal range breaks.
Originality Statement
Prism Channel Architecture is an original Pine Script v6 publication. The dual-engine architecture combining a quality-scored best-fit pivot channel with an independently computed least-squares regression channel, and the definition of alignment confluence as agreement between those two distinct structural systems, is an original design. The pivot quality scoring methodology — measuring the containment ratio of recent bars within the candidate channel bounds with ATR tolerance — is an original technique not derived from any existing published indicator.
Disclaimer
This indicator is for educational and informational purposes only. Channels, alignment states, and breakout labels are analytical tools and do not constitute financial advice. Channel boundaries can and will be violated without warning. Always apply proper risk management and never trade solely based on indicator signals.
-Made with passion by jackofalltrades
Indicateur
Smart Trader, Episode 06, Isotropic Trend Lines🔷 WHAT IS ST-EP06 — ISOTROPIC TREND LINES?
ST-EP06 is a multi-scale structural trend channel indicator built on a σ-normalized coordinate system. It is designed to solve one of the oldest unaddressed problems in technical analysis:
trend angles that cannot be compared across instruments, timeframes, or volatility regimes.
A trend line drawn on a chart appears to carry a measurable angle — yet that angle is an artifact of the display window, not a property of the market. Resize the chart horizontally and the slope flattens; compress it and the slope steepens. A given price movement on Gold daily and Bitcoin 1-hour may produce visually identical slopes on screen while reflecting entirely different structural conditions. This happens because traditional charts use a coordinate space where the vertical axis (price) and the horizontal axis (time) share no fixed dimensional relationship.
The consequence is not merely cosmetic. A trader cannot meaningfully compare the steepness of a trend on one instrument with another — or even across timeframes on the same instrument — because the weight of "one unit of price per bar" varies with the instrument's current volatility.
As the author of this indicator, I sought a coordinate system where trend angles would be an intrinsic structural property of the market, independent of charting software or display settings. The goal: a space where a 30° uptrend on EUR/USD weekly carries the same structural meaning as a 30° uptrend on NASDAQ 5-minute — indicating that each market is moving at the same rate relative to its own realized volatility.
The solution draws on the principle of dimensional analysis, well established in physics and engineering. Just as the Reynolds number normalizes fluid flow to make behavior comparable across different pipe sizes and fluid viscosities, this indicator normalizes price movement by realized volatility, producing a dimensionless space we call the Isotropic Coordinate System (ICS).
In ICS, price is expressed in natural logarithmic form and scaled by a volatility estimate (σ) derived from the Yang-Zhang (2000) method — a drift-invariant estimator that incorporates Open, High, Low, and Close data. The resulting vertical axis is dimensionless: one unit equals one standard deviation of recent realized price behavior. When trend angles are measured in this space, 45° indicates approximately one σ of movement per bar — whether the chart shows a penny stock, a major currency pair, or a commodity index.
Traditional chart coordinates assign no fixed relationship between the price axis and the time axis. Resizing the chart window changes the visual slope of the same price movement — a compressed view may show 52° while a stretched view of the same data shows 25°. The angle is a display artifact, not a market property. The Isotropic Coordinate System (ICS) addresses this by normalizing log-price by realized volatility (σ). In this space, the trend angle is designed to remain constant regardless of how the chart is displayed — because it measures price displacement in units of σ per bar, not in pixels per pixel.
🔷 HOW THE MODULES WORK TOGETHER
ST-EP06 operates as a deterministic pipeline where each stage consumes the output of the one before it:
Realized volatility estimation (σ) → Structural block construction → Monotonic direction detection → ICS angle measurement → Channel boundary fitting → Six-scale parallel analysis → Consensus aggregation → Breakout and retest state tracking → Dashboard narrative generation
The Yang-Zhang σ provides the normalization constant for every downstream computation. Price history is then partitioned into structural blocks, each distilled to a single central tendency that resists close-price bias. Consecutive block centers are compared to identify the longest uninterrupted directional segment. The slope of that segment, measured in σ-normalized space, yields the ICS angle. Four price extremes located within the segment define two log-linear channel boundaries. This complete pipeline runs independently at six temporal scales, and their independent outputs are aggregated into a structural consensus. A finite-state machine then tracks the evolving relationship between price and the primary channel — breakout, retest, confirmation, or failure — and translates it into a single-line human-readable narrative.
ST-EP06 operates as a deterministic sequential pipeline. Yang-Zhang volatility (σ) provides the normalization constant that flows into every downstream stage. Price history is partitioned into structural blocks, each reduced to a geometric mean. The longest monotonic segment determines direction, and its slope in σ-normalized space yields the ICS angle. Four price extremes define the channel boundaries. This complete pipeline runs independently at six scales — 3, 7, 13, 19, 29, and 47 bars per block — all prime numbers, chosen to minimize harmonic overlap so that multiple scales are unlikely to lock onto the same cyclical artifact. Scale 19 (highlighted) serves as the primary engine: it is the only scale that maps to the user's Trend Block Period input, and the only scale whose output drives the chart-overlay channel lines, the projection, the diamond markers, and the breakout/retest state machine. The other five scales operate at fixed periods and contribute exclusively to the cross-scale consensus count — providing structural context that a single scale cannot offer alone. When 5 or 6 of the 6 scales agree on direction, it suggests a structural trend visible across a broad range of temporal resolutions.
🔷 DATA ANCHORING
Every structural computation in ST-EP06 — volatility, block means, direction, channel coordinates, state machine transitions, and dashboard narrative — is governed by a single anchoring reference, selected through the Calculation Bar input.
Live Bar mode (default): the anchor is the current forming bar. Values update with each incoming tick. This is standard TradingView behavior and means the indicator may exhibit intra-bar repaint — the live bar's data enters all computations as it evolves.
Close Bar mode: the anchor shifts to the last fully confirmed (closed) bar. The forming bar is excluded from every computation. Values lock once a bar closes and do not change retroactively. This mode is intended for structural analysis, back-testing, and any workflow where historical consistency is a priority.
One deliberate exception is maintained in both modes: the dashboard header always displays the current live closing price (Live Exception protocol), preserving real-time price awareness regardless of how the indicator's structural engine is anchored.
Two modes, same chart moment. In Live Bar the anchor sits on the forming bar, so every value updates tick-by-tick and may repaint within the bar. In Close Bar the anchor shifts to the last closed bar, locking all structural values once the bar closes. The only exception is the dashboard header row, which always displays the live closing price in both modes, so real-time price awareness is never lost.
🔷 YANG-ZHANG VOLATILITY (σ)
The foundation of the ICS is a robust volatility estimate. ST-EP06 uses the Yang-Zhang (2000) realized volatility estimator, an academically established method that combines three variance components:
Overnight variance — capturing the gap between consecutive sessions, measured from the prior close to the current open.
Intraday variance — capturing the movement from open to close within each session.
Range-based variance — using the Rogers-Satchell (1991) estimator, which extracts additional information from the high and low prices without assuming zero drift.
These three components are blended using an optimal weight that is designed to minimize estimation error. The resulting σ updates every bar, adapts to changing market conditions, and — crucially — is drift-invariant: it is intended to remain unbiased whether the market is trending strongly or mean-reverting.
🔷 BLOCK CONSTRUCTION
Rather than analyzing individual bars, ST-EP06 partitions recent price history into consecutive non-overlapping blocks. Each block spans a user-defined number of bars (the Trend Block Period input) and is reduced to a single representative value: the geometric mean of the block's highest high and lowest low, computed in logarithmic space.
This log-midpoint serves as the block's central tendency. Unlike a simple average of closing prices, it captures the structural center of the entire price range within the block, avoiding bias toward any single price point. The number of consecutive blocks compared is controlled by the Trend Block Groups input — more groups means deeper lookback and the ability to detect longer structural trends.
Price history is partitioned into consecutive non-overlapping blocks. Each block reduces to a single log-midpoint — the geometric mean of its highest high and lowest low. Connecting the midpoints forms the representative chain used for trend detection.
🔷 DIRECTION DETECTION + ICS ANGLE
Once blocks are constructed, the engine compares their geometric means in sequence, starting from the most recent. It identifies the longest consecutive segment where each block's central tendency moves in the same direction — either consistently rising or consistently falling. A single reversal terminates the segment.
The slope of this segment is then measured in ICS space: the logarithmic price difference between the oldest and newest blocks in the segment, divided by σ, divided by the number of bars between them. The arctangent of this normalized slope produces the ICS angle in degrees.
If the absolute angle falls within the Range Threshold (a user-configurable dead zone in degrees), the direction is classified as ranging rather than trending. This threshold acts as a sensitivity filter — wider values require steeper moves before declaring a trend, narrower values respond to subtler directional shifts.
An ICS angle of 45° indicates approximately one σ of price movement per bar. An angle near 0° suggests the market may be structurally flat. Because σ adjusts for volatility and the logarithm adjusts for price level, these angles are intended to be directly comparable across any instrument and any timeframe.
🔷 CHANNEL FITTING
Within the identified trending segment, the engine locates four price extremes: the highest high, the lowest high, the highest low, and the lowest low — each paired with its bar position. These four points define two linear boundaries in ICS space.
During an uptrend, the upper boundary is fitted through the lowest high and highest high (capturing the rising ceiling), while the lower boundary is fitted through the lowest low and highest low (capturing the rising floor). During a downtrend, the fitting order reverses to capture descending structure. During a ranging market, the channel uses horizontal boundaries at the segment's absolute high and low.
All boundary computations occur in the σ-normalized logarithmic coordinate system, meaning the channel lines represent geometric (log-linear) paths in price space — curves that naturally follow multiplicative price behavior rather than additive assumptions.
Within the trending segment, four extremes — HH, LH, HL, LL — define two log-linear boundaries. In an uptrend, the upper line fits through LH and HH, the lower through LL and HL. The direction reverses the fitting order for downtrends, and a ranging market uses horizontal boundaries.
🔷 6-SCALE PARALLEL ANALYSIS
A single temporal scale may capture the trend at one resolution but miss structure at others. ST-EP06 runs the complete pipeline — volatility normalization, block construction, direction detection, ICS angle, and channel fitting — independently at six different scales: 3, 7, 13, 19, 29, and 47 bars per block. These values were chosen as prime numbers to minimize harmonic overlap between scales.
Scale 19 serves as the primary engine and maps to the user's Trend Block Period input. The other five scales use fixed periods, providing a structural context that the primary engine alone cannot offer.
The dashboard displays each scale's independent trend direction. A consensus count shows how many of the six scales agree: 5/6 or 6/6 agreement suggests a structural trend that is visible across multiple temporal resolutions, while low agreement may indicate transitional or conflicting structure.
🔷 BREAKOUT / RETEST STATE MACHINE
ST-EP06 includes a 5-state finite automaton that tracks price's structural relationship to the primary channel boundaries:
Inside — price is observed between the channel floor and ceiling. The dashboard shows the position as a percentage: distance from floor and distance to ceiling (summing to 100%).
Breakout Up / Breakout Down — price has exited above the ceiling or below the floor. The dashboard shows the breakout price and the percentage of channel width that price has moved beyond the boundary.
Retest Up / Retest Down — after a breakout, price has moved at least one σ away from the boundary (establishing distance), then returned to test it. The dashboard shows both the original breakout price and the current retest level.
Transitions between states use dynamic σ-based thresholds rather than fixed percentages, meaning the sensitivity automatically adjusts with market volatility. Additional flags track:
✓ Confirmed — a breakout that has been retested and bounced at least one σ away from the boundary.
(gap) — price crossed the entire channel width in a single transition.
Failed breakout — price re-entered the channel after initially breaking out.
Direction reset — the primary trend direction changed, wiping all breakout state.
🔷 VISUAL TOOLS
All chart-overlay elements are drawn from the primary engine (scale 19):
Channel lines — solid upper and lower boundaries from the segment start to the anchor bar, colored by trend direction (configurable up/down/range colors, width, and line style).
Projection lines — dotted forward extension of the channel slopes beyond the anchor bar, providing a visual reference for potential future support and resistance. The projection offset, width, and style are independently configurable.
Channel fill — semi-transparent shading between channel boundaries, with independent color selection and adjustable transparency. Applies to both the solid channel and projection segments.
Diamond markers (◆) — placed at the channel endpoints on the anchor bar. Hovering reveals a tooltip with the anchored close price, ceiling level, floor level, and the price's position as a percentage of channel width.
Direction label — positioned at the midpoint between segment start and projection end. Displays the trend arrow, direction text, and ICS angle (e.g., "▲ UP +7.3°"). Tooltip includes block count.
🔷 DASHBOARD
A compact information table appears at the top-right corner of the chart, organized in 5 rows:
Header — indicator name, ticker symbol, timeframe, and live price (always live under the Live Exception protocol, even in Close Bar mode).
Period — the six scale values (3, 7, 13, user's period, 29, 47) displayed across columns. The primary engine column is highlighted.
Trend — per-scale trend direction with directional arrows (▲ UP, ▼ DN, ◈ RNG) and color coding.
Agreement — consensus count (e.g., "5/6 UP") with the primary channel ceiling (▲) and floor (▼) price levels.
Narrative — a single merged row presenting the breakout/retest state machine output as a human-readable sentence with distance measurements. This row updates dynamically as price interacts with the channel.
All dashboard text, tooltips, and narrative phrases are fully localized.
🔷 ALERT CONDITIONS
ST-EP06 provides 19 alert conditions organized in 5 categories, all gated by a master Enable Alerts toggle:
D · Direction (3 alerts) — fires when the primary engine trend changes to uptrend, downtrend, or range.
B · Breakout (4 alerts) — fires on initial breakout above ceiling or below floor, and separately on confirmed breakout (retested and bounced).
R · Retest (2 alerts) — fires when price returns to test the boundary after establishing distance.
S · Structural (5 alerts) — fires on gap-through events (price crosses entire channel), failed breakouts (price re-enters channel), and direction resets (trend change wipes state).
A · Agreement (5 alerts) — fires when cross-scale consensus reaches significant thresholds: full bullish (6/6), strong bullish (5/6), full bearish (6/6), strong bearish (5/6), or range consensus (≥4/6).
Important: alerts require Calculation Bar = Live Bar. In Close Bar mode, all alert conditions are automatically suppressed and a visual warning is displayed on the chart — because Close Bar mode intentionally lags by one bar, which is semantically incompatible with live alert delivery.
🔷 LANGUAGE SUPPORT
The dashboard, all tooltips, the breakout/retest narrative, and the alert warning label are available in 7 languages:
English · Türkçe · العربية · Русский · Italiano · Português (BR) · 中文
Select the preferred language from the Language dropdown in the Display settings group. All structural and numerical outputs remain unchanged — only the display language of text elements is affected.
🔷 HOW TO USE
Apply ST-EP06 to any chart — the indicator is designed to work across instruments (equities, forex, crypto, commodities, indices) and timeframes without parameter re-optimization, because the ICS framework normalizes for volatility and price level automatically.
Start with the default settings (Period 26, Groups 5, Sigma Length 20) and observe how the channel captures the dominant structural trend. The 6-scale consensus in the dashboard may help assess whether the observed trend is isolated to one temporal resolution or confirmed across multiple scales.
The Calculation Bar setting is a structural decision: use Live Bar for real-time monitoring and alert-driven workflows; use Close Bar for analysis and back-testing where historical stability is prioritized.
The ICS angle on the direction label provides a quantitative measure of trend intensity. Comparing angles across different instruments or timeframes is one of the intended use cases of the ICS framework — a 15° angle on one chart and a 15° angle on another may suggest similar structural momentum relative to each market's own volatility.
The breakout/retest narrative in the dashboard bottom row is designed to provide context-rich status updates without requiring manual chart reading. The σ-based thresholds ensure that breakout sensitivity adapts to current market conditions rather than relying on fixed values.
🔷 SETTINGS
Calculation — Calculation Bar (Live/Close Bar anchoring), Trend Block Period (bars per block), Trend Block Groups (consecutive blocks compared), Range Threshold (ICS dead zone in degrees), Yang-Zhang Sigma Length (volatility lookback).
Channel Lines — Up Color, Down Color, Range Color, Line Width, Line Style.
Projection Lines — Projection Offset (forward bars), Projection Width, Projection Style.
Display — Language (7 options), Show Channel (toggle overlay), Show Fill (toggle shading), Show Dashboard (toggle table), Dashboard Font Size.
Channel Fill — Fill Up Color, Fill Down Color, Fill Range Color, Fill Transparency.
Alerts — Enable Alerts (master toggle, requires Live Bar mode).
🔷 DISCLAIMER
ST-EP06 is an educational and analytical tool. It is designed to provide structural context through σ-normalized trend channels and multi-scale analysis. It does not generate buy or sell signals, does not predict future price movement, and is not intended as financial advice. Historical patterns observed through this indicator do not guarantee future outcomes. All trading decisions remain the sole responsibility of the trader.
Indicateur

Indicateur

Anchored Regression Oracle [JOAT]Anchored Regression Oracle
Introduction
Linear regression is one of the most powerful tools in statistical analysis, yet its application in most trading indicators is limited to a fixed rolling window applied to closing prices — a single-dimensional view of a multi-dimensional problem. The Anchored Regression Oracle extends classical Ordinary Least Squares regression in four distinct ways: it supports both logarithmic and linear price scaling, it offers multiple anchor modes (fixed bar count or calendar-period anchoring), it computes a full set of deviation, Fibonacci, and extreme projection levels above and below the regression line, and it incorporates the Pearson R correlation coefficient and theta angle as real-time quality metrics that control signal eligibility.
The fundamental insight motivating the log/linear duality is that financial prices grow multiplicatively, not additively. A $10 move from $100 is a 10% change; a $10 move from $1000 is a 1% change. Fitting a straight line through raw prices on a linear scale treats these as equivalent. Fitting through log-transformed prices treats them as proportionally equivalent — and for equities, cryptocurrencies, and other compounding instruments, the log-space regression is often the more meaningful representation of trend. The indicator handles both cases transparently, transforming all calculation into log space when selected and back-transforming all output levels to price space for display.
The calendar anchoring system adds a dimension that pure bar-count indicators cannot provide: the ability to reset and recalculate the regression window at the start of each new trading day, week, month, or other period — automatically. This makes the regression channel contextually anchored to the current period's price action rather than an arbitrary historical bar count, without any manual intervention.
Core Concepts
1. Manual OLS Linear Regression
The indicator implements the full Ordinary Least Squares regression formula manually rather than using Pine Script's built-in ta.linreg(). This is a deliberate choice: the manual implementation supports both logarithmic transformation and expanding anchor windows, neither of which the built-in function accommodates. The calculation accumulates bar-level sums across the current window to derive the exact OLS slope and intercept.
slope = (n * sumXY - sumX * sumY) / (n * sumXX - sumX * sumX)
intercept = (sumY - slope * sumX) / n
lrValue = intercept + slope * n
Where n is the current window size, sumXY is the sum of bar-index times price products, sumXX is the sum of squared bar indices, and sumX and sumY are the simple sums of indices and prices respectively. In log mode, all price values entering the sums are first transformed via math.log(), and all output levels are back-transformed via math.exp() before rendering on the chart.
2. Pearson R Correlation Coefficient
After computing slope and intercept, the Pearson R coefficient is derived from the same accumulated sums. R measures the linearity of the relationship between bar index and price — essentially, how well the regression line fits the actual price path. Values near 1.0 or -1.0 indicate strong linear trends where the regression line is a reliable representation. Values near 0 indicate that price is moving chaotically relative to a linear model.
dxt = sumXX - sumX * sumX / n
dyt = sumYY - sumY * sumY / n
pearsonR = (sumXY - sumX * sumY / n) / math.sqrt(dxt * dyt)
The dashboard displays Pearson R with color coding: teal for |R| ≥ 0.8 (strong fit), orange for |R| ≥ 0.5 (moderate fit), red for |R| below 0.5 (weak fit). When the Pearson filter is enabled, only readings with |R| above the user threshold are eligible for signal generation — preventing trades on regression lines that do not actually describe the price behavior.
3. Theta Angle
The slope of the regression line is an abstract mathematical quantity that is not intuitively interpretable. Converting it to a theta angle using the arctangent function produces a human-readable degree value: a steeply rising trend shows a large positive angle, a flat trend shows near-zero degrees, and a declining trend shows a negative angle. The minimum theta filter allows users to exclude signals from very shallow trends — requiring a minimum degree of directional conviction before entries are considered.
theta = math.atan(-slope) * 180 / math.pi
Note that the negative sign before slope accounts for the inversion between mathematical y-axis convention (upward) and screen y-axis convention (downward in most chart implementations), ensuring the displayed angle intuitively matches the visual slope direction on the chart.
4. Window Modes: Rolling vs. Anchored
The "Bar" mode uses a fixed rolling window of N bars — the regression line covers exactly the last N candles regardless of calendar position. All period-based modes ("Minute", "Hour", "Day", "Week", "Month") use an expanding anchor: a bar counter resets to zero each time a new period begins (detected via timeframe.change()), and the regression window expands from that anchor point through the current bar. This means on day anchoring, the regression always describes the current day's price action from the first bar to now — expanding as the day progresses and resetting at the start of each new day.
var int windowBars = 0
periodChanged = timeframe.change(targetTF)
windowBars := periodChanged ? 1 : windowBars + 1
effectiveLen = windowMode == "Bar" ? barLen : windowBars
5. Deviation and Fibonacci Projection Levels
Six lines are drawn on the chart, all updated on barstate.islast to avoid performance overhead. The center line is the regression line itself. The upper and lower deviation lines are offset by user-configurable standard deviation multiples. A Fibonacci level is plotted at 1.618 standard deviations. Historical high and low lines track the maximum deviation point actually reached by price above and below the regression line over the window — providing empirical rather than statistical bounds.
f_lvl(base, std, mult) =>
logMode ? math.exp(math.log(base) + std * mult) : base + std * mult
upperDev = f_lvl(lrValue, stdDev, upperMult)
lowerDev = f_lvl(lrValue, stdDev, lowerMult)
fibLevel = f_lvl(lrValue, stdDev, 1.618)
In log mode, the offset is applied additively in log space (equivalent to multiplicative scaling in price space), ensuring the deviation levels remain proportionally consistent with the log-scale price representation.
6. Five Signal Modes
The signal system offers five distinct behavioral modes. "None" disables signals entirely. "Deviation|Breakout" fires when price crosses above the upper deviation (long) or below the lower deviation (short). "Deviation|MeanReversion" fires when price crosses back inside the deviation bands after an excursion outside. "Extreme|Breakout" uses the historical high and low deviation lines as the reference. "Extreme|MeanReversion" fires when price returns inside the historical extremes. "Theta-Only" generates signals based solely on the theta angle crossing the minimum threshold, regardless of price position relative to deviation levels.
Features
Full Manual OLS Regression: Complete Ordinary Least Squares implementation supporting both log and linear price scaling without any ta.linreg() dependency.
Log/Linear Scale Toggle: Log mode transforms all prices via math.log before regression and back-transforms all output levels, producing proportionally correct channels for compounding instruments.
Multiple Window Modes: Fixed bar count or calendar-anchored expanding windows (Minute, Hour, Day, Week, Month) that reset automatically on period transitions.
Pearson R Coefficient: Real-time correlation quality metric with color-coded dashboard display and optional signal eligibility filter.
Theta Angle: Human-readable trend angle from arctangent of slope with optional minimum threshold signal filter.
Six Regression Lines: Center regression line, upper and lower user-configured deviation bands, 1.618 Fibonacci level, and historical high/low deviation extremes.
Five Signal Modes: Deviation breakout, deviation mean-reversion, extreme breakout, extreme mean-reversion, and theta-only — covering different trading philosophies.
Historical Ghost Plots: Non-repainting semi-transparent historical regression and deviation plots for visual context of prior channel positions.
Efficient Line Updates: All six lines are updated on barstate.islast only, maintaining performance even on long chart histories.
Seven-Row Dashboard: Pearson R (color-coded), theta with sign, direction, signal mode, window type, standard deviation, and window size.
Four Alert Conditions: Long entry, short entry, long exit, short exit — all gated by optional Pearson and theta filters.
Input Parameters
Regression Settings:
Window Mode: Bar, Minute, Hour, Day, Week, or Month (default: Day)
Bar Length: Fixed window size when mode is "Bar" (default: 100)
Target Timeframe: Calendar period string used in timeframe.change() for anchored modes (default: "D")
Log Mode: Enable logarithmic price transformation (default: false)
Deviation Settings:
Upper Deviation Multiplier: Standard deviation multiple for upper channel boundary (default: 2.0)
Lower Deviation Multiplier: Standard deviation multiple for lower channel boundary (default: 2.0)
Show Fibonacci Level: Toggle the 1.618 StdDev Fibonacci projection line (default: true)
Show Historical Extremes: Toggle the historical high/low deviation lines (default: true)
Signal Settings:
Signal Mode: None, Deviation|Breakout, Deviation|MeanReversion, Extreme|Breakout, Extreme|MeanReversion, Theta-Only (default: Deviation|Breakout)
Minimum Theta: Minimum absolute angle in degrees required for signal eligibility (default: 5)
Pearson Filter: Enable Pearson R minimum threshold (default: false)
Min Pearson R: Minimum |R| required when filter is active (default: 0.7)
Display Settings:
Show Historical Plots: Toggle ghost regression and deviation plots (default: true)
Historical Alpha: Transparency level for historical plots (default: 75)
Show Dashboard: Toggle the seven-row information table (default: true)
How to Use This Indicator
Step 1: Select the Appropriate Window Mode
Start by choosing the window mode that matches your analytical context. For intraday trading, Day anchoring is most natural — it resets the regression at the start of each session, showing how the current day's price action trends from the open. For swing trading, Week or Month anchoring provides a broader structural perspective. Bar mode is appropriate when you want consistent lookback regardless of calendar, for example in crypto markets that trade continuously without session boundaries.
Step 2: Evaluate Regression Quality Before Trusting Signals
Check the Pearson R value in the dashboard before interpreting any signal. A strong R (teal, ≥ 0.8) means price has been moving in a well-defined linear trend — the regression line is descriptively accurate and signals from it carry more weight. A weak R (red, < 0.5) means price has been choppy and non-linear; the regression line is fitting noise, and deviation-based signals will be unreliable. If the Pearson filter is enabled, signals will simply not fire when R is below threshold, automating this quality check.
Step 3: Choose a Signal Mode Matching Your Strategy
Breakout modes are suited for momentum strategies — they enter when price is moving away from the regression mean with statistical force. Mean-reversion modes are suited for range-expansion strategies — they enter when price returns inside the channel after an excursion, betting on a return to mean. The Extreme modes use the actual historical high/low deviations rather than the fixed multiplier, making them adaptive to the specific price behavior observed in the current window.
Step 4: Apply Theta and Pearson Filters for Quality Control
Enable the minimum theta filter to avoid trading very shallow trends. A trend angled at 3 degrees has minimal directional conviction — the regression line is nearly horizontal, and any deviation signals from it may be as much noise as signal. Setting a minimum of 10-15 degrees for active entries ensures you are trading genuine directional moves rather than sideways grinding. Combine this with the Pearson filter for the highest-quality signal subset.
Indicator Limitations
Linear regression assumes the relationship between time and price is fundamentally linear during the window. In strongly trending markets this is approximately true; in markets with curves, accelerating trends, or parabolic moves, the linear model will systematically underfit the actual trajectory.
The OLS calculation accumulates sums over the entire window on every bar. On very long bar counts or in expanding anchor modes late in a long session, this can affect script execution time, particularly when combined with other indicators on the same chart.
Calendar anchoring uses timeframe.change() which is resolution-dependent. If the chart timeframe is coarser than the anchor period (e.g., viewing a weekly chart with day anchoring), the anchor period may not transition as expected.
Pearson R measures linear correlation specifically. A price series that follows a consistent curve will produce a lower R than one that follows a straight line, even if the curve describes a very orderly trend. In log mode, this issue is partially mitigated for exponentially trending instruments.
Historical ghost plots are informational only and represent completed regression windows. They do not update after their respective periods close.
In log mode, the volatility measure used for deviation computation is the standard deviation of log-transformed prices, which is equivalent to a percentage standard deviation. For very short windows, this measure can be highly sensitive to individual bar outliers.
Signals on the current (incomplete) bar are not displayed, as all signal conditions require barstate.isconfirmed to prevent look-ahead.
Originality Statement
The Anchored Regression Oracle is a substantially original analytical tool that addresses specific limitations of existing regression-based indicators on TradingView.
The manual OLS implementation (computing slope, intercept, and Pearson R from accumulated sums without ta.linreg()) enables the log-space calculation that built-in functions do not support — allowing mathematically correct regression channels for compounding assets.
The calendar-anchored expanding window system (using timeframe.change() to reset a bar counter and grow the regression window from a fixed calendar point) is an original approach to making regression contextually meaningful for session-based or period-based analysis.
Computing and displaying the theta angle (arctangent of slope in degrees) as a real-time trend steepness metric, with a configurable minimum threshold that gates signal eligibility, is an original signal quality framework not found in standard regression channel indicators.
The five-mode signal system — providing breakout and mean-reversion variants for both statistical deviation levels and empirical historical extremes, plus a theta-only mode — covers a range of trading philosophies from a single indicator, rather than requiring separate indicators for each approach.
The combination of log/linear duality, calendar anchoring, Pearson quality gating, theta filtering, Fibonacci projection at 1.618 StdDev, and historical ghost plots in a single indicator represents an integration of features not available in any single existing TradingView regression tool.
Disclaimer
The Anchored Regression Oracle is provided for educational and informational purposes only. It is a technical analysis tool and does not constitute financial advice. Statistical measures such as Pearson R and regression slope describe historical relationships and do not predict future price behavior. All trading involves risk of loss. Users are solely responsible for their own trading decisions. Please consider your individual risk tolerance and consult a licensed financial professional before engaging in any trading activity.
-Made with passion by officialjackofalltrades
Indicateur

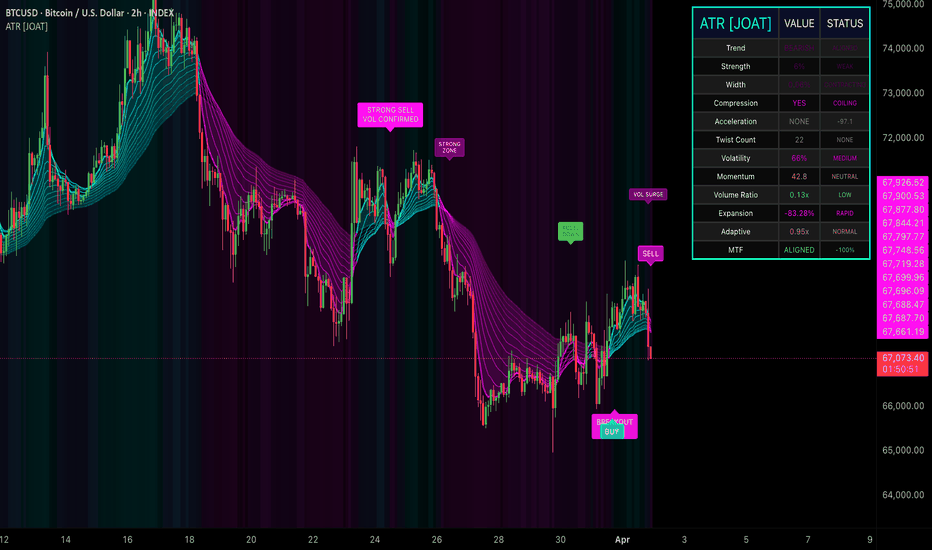
Adaptive Trend Ribbon [JOAT]Adaptive Trend Ribbon
Introduction
The Adaptive Trend Ribbon is an advanced open-source trend-following indicator that combines multi-layer moving average analysis with real-time volatility adaptation, momentum weighting, and volume confirmation. This indicator transforms traditional ribbon systems into an institutional-grade tool by dynamically adjusting to market conditions, providing traders with a comprehensive view of trend strength, direction, and potential reversals across all timeframes.
Unlike static ribbon indicators that use fixed parameters, this system continuously adapts to volatility percentiles, momentum shifts, and volume surges, creating a responsive framework that works equally well in ranging, trending, and explosive market conditions. The indicator is designed for traders who understand that market regimes change and that adaptive systems outperform static ones in real-world trading.
Why This Indicator Exists
This indicator addresses critical limitations in traditional moving average systems by introducing adaptive intelligence that responds to market microstructure. The core innovation lies in combining multiple adaptation mechanisms:
Volatility Adaptation: Ribbon parameters adjust based on ATR percentile ranking, expanding during high volatility and contracting during consolidation
Momentum Adaptation: RSI-based momentum weighting modifies ribbon sensitivity to capture acceleration and deceleration phases
Volume Adaptation: Volume ratio analysis confirms trend validity and filters false signals during low-participation moves
Multi-Timeframe Alignment: Higher timeframe trend confirmation across three customizable periods validates directional conviction
Ribbon Compression Detection: Identifies coiling patterns that precede explosive breakouts with statistical precision
Twist Reversal System: Detects ribbon layer crossovers that signal potential trend exhaustion or reversal
Each adaptation layer provides unique intelligence. Volatility adaptation ensures the ribbon remains relevant across different market regimes, momentum adaptation captures trend acceleration, volume adaptation confirms institutional participation, MTF alignment validates conviction, compression detection anticipates breakouts, and twist detection warns of reversals.
Core Components Explained
1. Adaptive Multiplier System
The indicator calculates three distinct adaptation factors that combine into a unified multiplier:
Volatility Multiplier: Based on ATR percentile ranking over 100 bars, this factor increases ribbon responsiveness during high volatility periods and decreases it during low volatility. The calculation uses percentile ranking rather than raw ATR to normalize across different instruments and timeframes.
Momentum Multiplier: Derived from RSI deviation from the 50 midpoint, this factor amplifies ribbon sensitivity during strong momentum phases and dampens it during consolidation. The normalization ensures the multiplier remains bounded and predictable.
Volume Multiplier: Calculated as the ratio of current volume to 20-period average volume, capped at 2x to prevent extreme distortions. This factor confirms that price movements are supported by genuine participation rather than thin-market noise.
The combined adaptive multiplier averages these three factors, creating a balanced response to multiple market dimensions simultaneously. This multi-factor approach prevents over-optimization to any single market characteristic.
2. Multi-Layer Ribbon Construction
The ribbon consists of 3 to 20 customizable moving average layers (default 12) spanning from a fast length (default 5) to a slow length (default 55). The indicator supports five moving average types:
EMA (Exponential Moving Average): Responsive to recent price action, ideal for trending markets
SMA (Simple Moving Average): Equal weighting, provides stable trend identification
WMA (Weighted Moving Average): Linear weighting favoring recent data
VWMA (Volume-Weighted Moving Average): Incorporates volume into price averaging
HMA (Hull Moving Average): Reduced lag through weighted calculations and square root periods
Each ribbon layer is calculated with evenly distributed periods between fast and slow lengths. The spacing ensures smooth gradient transitions and prevents clustering that can create false signals. The ribbon can optionally use Heikin Ashi candles as the source, providing additional smoothing for noisy instruments.
3. Trend Detection and Classification
The indicator employs multiple trend detection mechanisms:
Ribbon Trend: Determined by comparing the fastest MA to the slowest MA. When fast > slow, the ribbon trend is bullish; when fast < slow, it's bearish.
Price Trend: Determined by comparing current price to the middle ribbon layer. This provides confirmation that price is aligned with the ribbon structure.
Aligned Trend: Occurs when both ribbon trend and price trend agree, indicating high-probability directional moves.
Trend strength is measured using percentile ranking of ribbon width over 50 bars. Higher percentile rankings indicate stronger trends with greater separation between ribbon layers, while lower rankings suggest consolidation or trend exhaustion.
4. Ribbon Metrics and Analysis
The indicator calculates comprehensive ribbon metrics:
Ribbon Width: Absolute distance between fastest and slowest MAs, providing a raw measure of trend strength.
Ribbon Width Percent: Width expressed as a percentage of current price, normalizing across different price levels and instruments.
Ribbon Strength: Percentile ranking of width percent over 50 bars, showing relative strength compared to recent history.
Compression Detection: Identifies when ribbon width falls below its 20-period average, signaling potential energy buildup before breakouts.
Expansion Rate: Measures the rate of change in ribbon width, identifying acceleration or deceleration in trend development.
These metrics work together to provide a complete picture of trend dynamics, from initiation through maturation to exhaustion.
5. Twist Detection System
The twist detection system identifies potential reversals by counting crossovers between adjacent ribbon layers. When multiple layers cross simultaneously (threshold: 50% of total layers), it signals a "twist" - a condition where the ribbon is reorganizing its structure, often preceding significant directional changes.
The system tracks twist count cumulatively, allowing traders to identify instruments or timeframes experiencing frequent regime changes versus those in stable trends. High twist counts suggest choppy, range-bound conditions, while low twist counts indicate clean trending environments.
6. Trend Acceleration Detection
Trend acceleration is measured using rate-of-change calculations on the middle ribbon layer:
Trend Momentum: 5-period rate of change of the mid-ribbon MA
Trend Acceleration: 3-period rate of change of trend momentum (second derivative)
When acceleration exceeds one standard deviation of its 20-period history, the indicator flags accelerating conditions. This early warning system helps traders identify when trends are gaining steam versus when they're losing momentum, even if price continues in the same direction.
7. Multi-Timeframe Alignment
The indicator requests ribbon trend data from three higher timeframes (default: 15m, 60m, 240m) and calculates an alignment score. The score ranges from -1 (all timeframes bearish) to +1 (all timeframes bullish), with values near zero indicating mixed or transitional conditions.
MTF alignment above 0.75 or below -0.75 indicates strong multi-timeframe conviction, suggesting high-probability directional moves. This feature is particularly valuable for swing traders who need confirmation that their trade direction aligns with higher timeframe structure.
Visual Elements
Ribbon Lines: Up to 20 gradient-colored MA lines with transparency increasing from fast to slow, creating a visual "ribbon" effect
Cloud Fill: Filled area between fastest and slowest MAs, colored based on trend direction and strength
Signal Labels: Text-based labels for crossovers, twists, compression breakouts, and extreme conditions
Background Heatmap: Optional gradient background showing ribbon strength intensity
Compression Zones: Subtle background highlighting during ribbon compression periods
MTF Alignment Background: Very subtle background when multi-timeframe alignment is strong
Comprehensive Dashboard: Real-time metrics table showing trend, strength, width, compression status, acceleration, twist count, volatility, momentum, volume ratio, expansion rate, adaptive factor, and MTF alignment
The dashboard displays 12 key metrics with color-coded values and status indicators, providing at-a-glance assessment of all ribbon dimensions simultaneously.
Input Parameters
Core Settings:
Ribbon Count: Number of MA layers (3-20, default 12)
Fast Length: Shortest MA period (2-50, default 5)
Slow Length: Longest MA period (10-200, default 55)
MA Type: EMA, SMA, WMA, VWMA, or HMA (default EMA)
Adaptation Settings:
Adapt to Volatility: Enable/disable ATR-based adaptation (default enabled)
Adapt to Momentum: Enable/disable RSI-based adaptation (default enabled)
Adapt to Volume: Enable/disable volume ratio adaptation (default enabled)
Use Heikin Ashi: Calculate ribbon using HA candles instead of regular OHLC (default disabled)
Display Options:
Show Cloud: Toggle ribbon cloud fill (default enabled)
Show Ribbon Lines: Toggle individual MA lines (default enabled)
Show Signals: Toggle entry/exit signal labels (default enabled)
Show Twists: Toggle twist reversal markers (default enabled)
Show Compression: Toggle compression breakout signals (default enabled)
Show Dashboard: Toggle metrics table (default enabled)
Show Heatmap: Toggle strength-based background gradient (default enabled)
Multi-Timeframe:
Enable MTF: Toggle multi-timeframe analysis (default enabled)
HTF 1/2/3: Three higher timeframe selections (default 15m, 60m, 240m)
Colors:
All colors are fully customizable including bull ribbon (neon cyan), bear ribbon (neon pink), twist (gold), compression (neon purple), and acceleration (neon green).
How to Use This Indicator
Step 1: Assess Ribbon Direction and Alignment
Check the dashboard "Trend" field and observe ribbon color. Bullish ribbon (cyan) indicates uptrend, bearish ribbon (pink) indicates downtrend. Verify that price is aligned with ribbon direction - price above ribbon in uptrends, below in downtrends.
Step 2: Evaluate Trend Strength
Monitor the "Strength" metric in the dashboard. Values above 70 indicate strong trends with high conviction, 40-70 suggests moderate trends, below 40 indicates weak or developing trends. Strong trends typically offer better risk/reward for trend-following entries.
Step 3: Watch for Compression Breakouts
When the dashboard shows "Compression: YES" and "Width" is contracting, prepare for potential breakout. Compression breakout signals appear when ribbon expands after coiling, often marking the start of new trend legs. These setups offer excellent risk/reward as stops can be placed tight to the compression zone.
Step 4: Identify Twist Reversals
Twist signals (gold labels) indicate ribbon layers are crossing, suggesting potential trend exhaustion or reversal. High twist counts in the dashboard suggest choppy conditions where trend-following strategies may underperform. Use twists as warnings to tighten stops or reduce position size.
Step 5: Confirm with Multi-Timeframe Alignment
Check MTF alignment in the dashboard. "ALIGNED" status with high percentage (>75%) confirms that higher timeframes support your trade direction. "MIXED" status suggests caution as higher timeframes may be in conflict with current timeframe trend.
Step 6: Monitor Acceleration Signals
Acceleration labels (neon green) indicate trend momentum is increasing. These often appear early in new trend legs and can signal optimal entry timing. Lack of acceleration in mature trends may warn of impending exhaustion.
Step 7: Use Volume Confirmation
Check "Volume Ratio" in dashboard. Ratios above 1.5x confirm strong participation, while ratios below 0.8x suggest weak participation. Volume-confirmed signals (labeled "STRONG BUY/SELL") offer higher probability than signals on low volume.
Best Practices
Use on liquid instruments with consistent volume patterns for most reliable adaptation
Combine with price action analysis - ribbon shows trend, price action shows entry timing
In ranging markets, reduce ribbon count and increase fast/slow length spread to filter noise
In trending markets, increase ribbon count for finer gradient visualization
Pay attention to compression zones near key support/resistance levels for high-probability breakout setups
Use MTF alignment as a filter - only take trades when alignment exceeds 75% in your direction
Twist signals are most reliable when they occur at extreme ribbon strength levels (>70 or <30)
Monitor adaptive factor in dashboard - values above 1.3 indicate high adaptation, below 0.9 indicate low adaptation
Heikin Ashi mode reduces noise but adds lag - use for very choppy instruments only
Acceleration signals work best in early trend phases, less reliable in mature trends
Volume ratio below 0.5 suggests thin liquidity - avoid new positions during these periods
Ribbon width expansion rate above 5% indicates strong trend acceleration
Indicator Limitations
Moving average-based systems inherently lag price action - ribbon confirms trends but doesn't predict them
Adaptation mechanisms require sufficient historical data - may be less reliable on newly listed instruments
MTF analysis requires data availability on all selected timeframes - some instruments may not support all timeframes
Compression detection can produce false signals in extremely low volatility environments
Twist detection sensitivity depends on ribbon count - too few layers may miss twists, too many may over-signal
Volume adaptation assumes volume data is accurate and representative - some instruments have unreliable volume
Heikin Ashi mode adds significant lag and should be used cautiously
Adaptive multiplier can become extreme during unusual market conditions - monitor dashboard values
The indicator shows what is happening, not why - fundamental catalysts can override technical ribbon signals
Ribbon crossovers can whipsaw in ranging markets - use compression detection to filter range-bound periods
Technical Implementation
Built with Pine Script v6 using:
Custom MA calculation function supporting five MA types with dynamic length parameters
Multi-factor adaptive multiplier combining volatility, momentum, and volume dimensions
Percentile-based strength calculations for normalized cross-instrument comparison
Compression detection using rolling average width comparison
Twist detection via adjacent layer crossover counting
Multi-timeframe security requests with proper lookahead settings to prevent future data leakage
Trend acceleration using rate-of-change and second derivative calculations
Dynamic color gradients based on strength percentile ranking
Comprehensive dashboard with 12 real-time metrics and color-coded status indicators
Persistent label system to prevent label proliferation and maintain chart clarity
The code is fully open-source and extensively commented for educational purposes and customization.
Originality Statement
This indicator is original in its comprehensive adaptive approach to ribbon analysis. While moving average ribbons are an established concept, this indicator is justified because:
It introduces multi-factor adaptation (volatility + momentum + volume) not found in standard ribbon indicators
The compression detection system provides statistical breakout anticipation beyond simple width measurement
Twist detection quantifies ribbon reorganization to identify reversal conditions systematically
Multi-timeframe alignment scoring provides conviction measurement across temporal dimensions
Trend acceleration tracking using second derivatives offers early momentum shift detection
The adaptive multiplier system creates a self-adjusting framework that works across all market regimes
Integration of five MA types with Heikin Ashi option provides unprecedented flexibility
The comprehensive dashboard synthesizes 12 distinct metrics into a unified intelligence panel
Persistent label system prevents chart clutter while maintaining signal visibility
Volume confirmation layer filters false signals during low-participation moves
Each component contributes unique intelligence: adaptation ensures relevance across regimes, compression detects energy buildup, twists warn of reversals, MTF alignment validates conviction, acceleration identifies momentum shifts, and the dashboard synthesizes everything into actionable intelligence. The indicator's value lies in combining these complementary perspectives into a cohesive, adaptive trend-following system.
Disclaimer
This indicator is provided for educational and informational purposes only. It is not financial advice or a recommendation to buy or sell any financial instrument. Trading involves substantial risk of loss and is not suitable for all investors.
Moving average-based systems are lagging indicators that confirm trends rather than predict them. Strong ribbon signals do not guarantee profitable trades. Past ribbon performance does not guarantee future ribbon performance. Market conditions change, and strategies that worked historically may not work in the future.
The metrics displayed are mathematical calculations based on current market data, not predictions of future price movement. Ribbon alignment, compression breakouts, and twist signals do not guarantee profitable trades. Users must conduct their own analysis and risk assessment before making trading decisions.
Always use proper risk management, including stop losses and position sizing appropriate for your account size and risk tolerance. Never risk more than you can afford to lose. Consider consulting with a qualified financial advisor before making investment decisions.
The author is not responsible for any losses incurred from using this indicator. Users assume full responsibility for all trading decisions made using this tool.
-Made with passion by officialjackofalltrades Indicateur
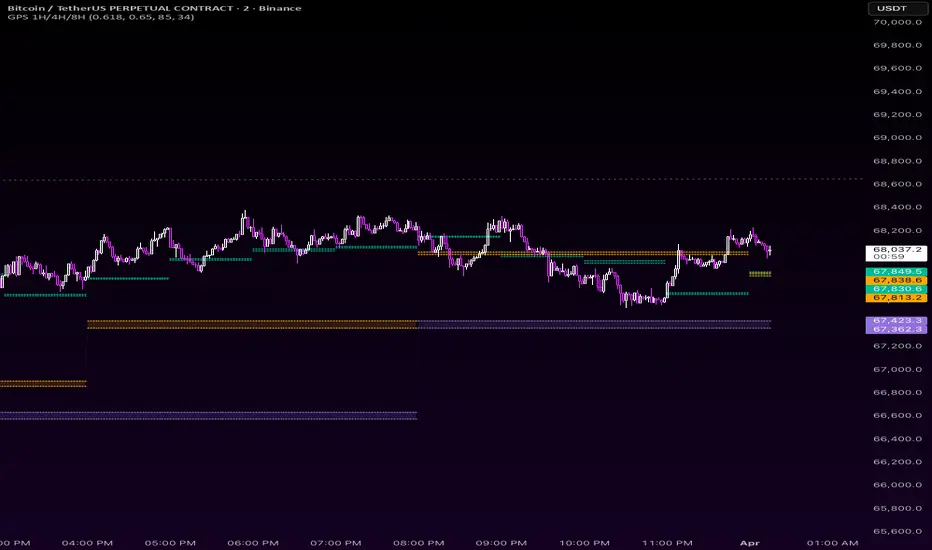
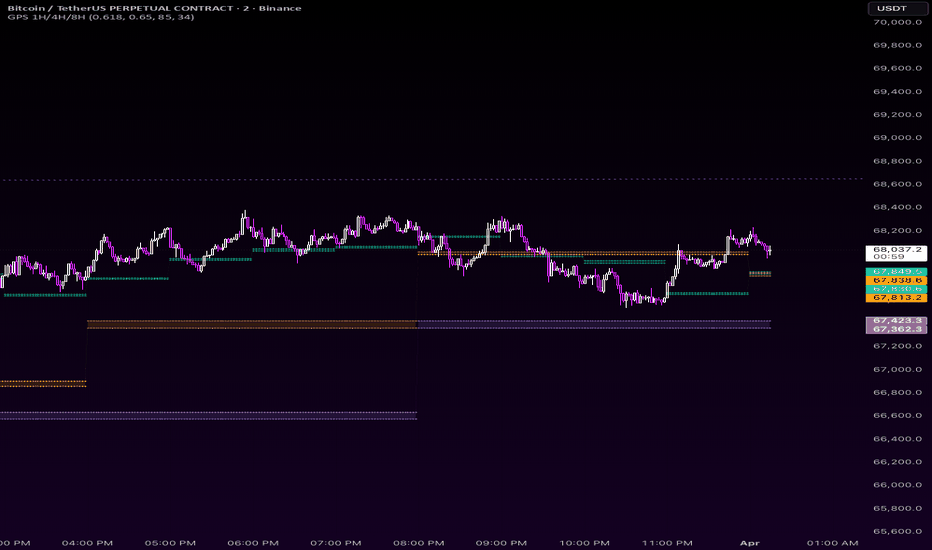
Golden Pocket Syndicate Mini (GPSM)This indicator is an overlay toolkit that combines multi-timeframe Golden Pocket-style zones (Fibonacci-derived ranges between user-defined high/low ratios), optional GP-anchored VWAPs that reset when price interacts with the matching zone, and a confluence framework with optional visuals (signals, divergences, order-block-style markers, sweeps, trails). It is intended to help traders see where higher-timeframe ranges and optional filters overlap on the chart—not to automate trading or promise outcomes.
What it does
Pulls prior completed higher-timeframe highs/lows via request.security() and derives upper/lower pocket levels from your fib inputs.
Plots pocket bands (and fills where used) for the timeframes you enable.
Optionally plots volume-weighted averages anchored to touches of the corresponding pocket.
Combines user-toggled filters into a confluence score and optional bull/bear markers; all signal logic can be turned off in settings.
How to use
Open settings, enable only the pocket timeframes and visuals you need. Adjust fib inputs, touch tolerance, and filter groups to match your process. If you use alerts, treat them as notifications only—confirm every trade in your own plan.
Important limitations
This is not financial, investment, or tax advice. Markets involve risk; past or hypothetical chart behavior does not guarantee future results.
Higher-timeframe data and request.security() behavior depend on symbol, session, and chart timeframe. Validate outputs on your instruments before relying on them.
Scripts cannot execute orders; you are responsible for compliance, sizing, and risk.
Companion
For separate 1H / 4H / 8H pocket bands (to reduce plot limits when combined with heavy scripts), use the author’s “Golden Pocket Syndicate mini” (GPSM) publication if offered.
Golden Pocket Syndicate mini (GPSM) — public description
Use this in the publication description field (English first).
GPSM is a lightweight companion overlay focused on 1-hour, 4-hour, and 8-hour Golden Pocket-style zones: two fib ratios applied to the prior completed bar’s range on each timeframe, with optional filled bands and optional GP-anchored VWAPs (off by default) that reset when price touches the matching pocket. The 1-hour band can optionally switch color using a simple prior closed 1H close vs EMA rule so you can see a regime-style split at a glance.
What it does
Uses request.security() on "60", "240", and "480" minute timeframes with the same prior-bar anchoring idea as the author’s main GPS Pro script.
Keeps the script small so it can run alongside heavier indicators without hitting Pine’s plot limits as quickly.
How to use
Add it to your chart, toggle 1H/4H/8H zones and fills, then optionally enable individual VWAPs. Match fib settings to your main workflow if you use GPS Pro on the same chart.
Important limitations
Not financial advice. No performance or profitability claims. Past chart behavior does not predict future prices.
HTF behavior varies by symbol and session (especially 8H). Confirm levels on your market.
You are solely responsible for trading decisions and risk.
Relationship to GPS Pro
GPSM does not duplicate the full confluence, SMC filters, or alerts stack from GPS Pro; it is meant as a focused HTF pocket + optional VWAP add-on. Indicateur
TTT - Trend Identification Moving AveragesWhat This Indicator Does
This indicator is designed to help traders identify and stay aligned with the dominant market trend by combining multiple moving averages with volume analysis. It provides a structured framework to evaluate trend direction, momentum, and participation—without relying on news, fundamentals, or opinions.
The Philosophy Behind It
Markets move in trends—and those trends tend to persist far longer than most investors expect. The biggest mistake traders make is trying to predict reversals instead of recognizing and following the current trend.
This tool is built on a simple principle: Trade with the trend, not against it.
As outlined in Technical Trading Mastery, price action reflects all known information, often reversing well before economic data or news confirms the move . By focusing on price and trend structure, traders can position themselves on the right side of the market rather than reacting emotionally.
How It Works
1. Multi-Timeframe Trend Structure
This indicator uses a combination of short-, intermediate-, and long-term moving averages:
5 EMA → Short-term momentum
20 EMA → Near-term trend direction
50 EMA → Intermediate trend
150 SMA → Long-term market direction
These averages act as dynamic support and resistance levels while also defining trend alignment .
2. Trend Confirmation Logic
The relationship between moving averages helps define market conditions:
- When shorter-term averages are above longer-term averages → Uptrend
- When shorter-term averages fall below longer-term averages → Downtrend
- When averages compress or move sideways → Consolidation / indecision
A key concept:
- When the 50 EMA is above the 150 SMA, the market is considered in a healthy uptrend
- When the 50 EMA falls below the 150 SMA, it signals a potential shift to a bearish environment
This provides a clear, rules-based way to stay aligned with the dominant trend.
3. Entry & Pullback Context
Trends do not move in straight lines—they move in waves. Price will naturally pull back toward moving averages during trends.
These areas can act as:
- Support in uptrends
- Resistance in downtrends
This allows traders to evaluate whether price is:
- Extending (higher risk)
- Pulling back (potential opportunity)
- Breaking trend (potential warning)
4. Volume as Participation Insight
Volume is displayed to provide context behind price movement.
- Rising price with increasing volume → stronger participation
- Rising price with declining volume → weaker conviction
- Sharp volume spikes → potential emotional or institutional activity
Markets are driven by waves of capital flow and crowd psychology, not just price alone . Volume helps reveal when those waves are gaining or losing strength.
Why This Matters
Most traders struggle not because they lack indicators—but because they lack structure and discipline.
This indicator simplifies decision-making by focusing on three key elements:
- Trend direction (Are you aligned with the market?)
- Price location (Are you chasing or buying weakness?)
- Participation (Is there real conviction behind the move?)
Instead of reacting to headlines or emotions, this framework encourages a rules-based approach to understanding market behavior.
How To Use It
- Focus on trading in the direction of the dominant trend
- Use moving averages as a guide for trend alignment and structure
- Observe how price reacts near key averages for potential continuation or warning signals
- Use volume to confirm whether moves are supported by participation
Final Perspective
This tool is not about predicting tops or bottoms.
It is about recognizing trends, understanding market structure, and staying positioned with the flow of capital.
Because in the end, the market rewards those who follow it—not those who fight it. Indicateur
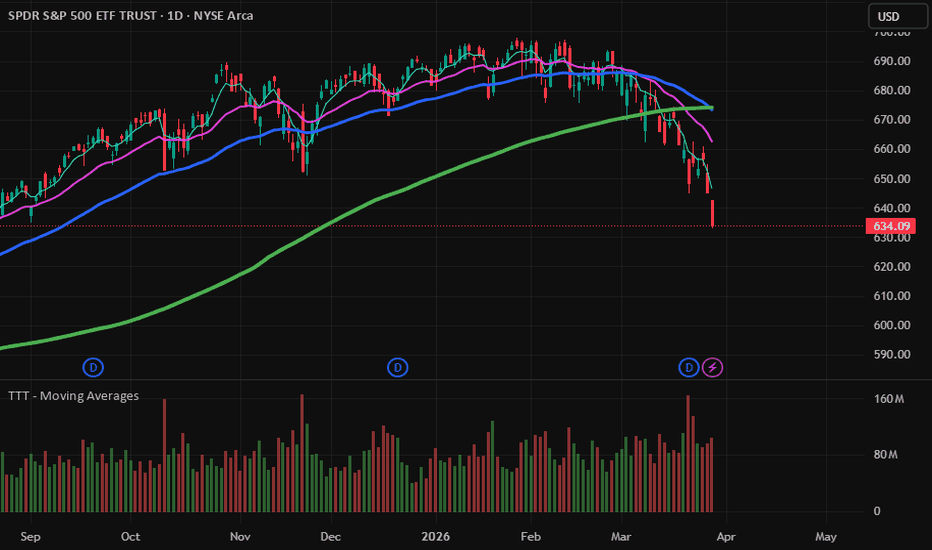
Quantum Flux Oscillator [JOAT]Quantum Flux Oscillator
Introduction
The Quantum Flux Oscillator is an advanced open-source momentum detection system that synthesizes six distinct analytical methodologies into a unified institutional-grade oscillator. This indicator combines Volume Flux Indicator (VFI), Laguerre RSI, Fisher Transform, True Strength Index (TSI), Money Flow Index (MFI), and On-Balance Volume (OBV) with Accumulation/Distribution analysis to create a comprehensive momentum engine that reveals institutional positioning and market regime shifts.
Unlike traditional single-dimension oscillators, the Quantum Flux Oscillator provides multi-layered momentum intelligence through weighted composite calculations, regime classification, velocity tracking, and divergence detection. The indicator is designed for traders who understand that momentum precedes price and that institutional footprints can be detected through systematic multi-indicator confluence.
Why This Indicator Exists
This indicator addresses a critical gap in momentum analysis: the ability to detect institutional momentum shifts before they become obvious to retail traders. By combining multiple momentum methodologies with volume-weighted analysis, this indicator reveals:
Volume Flux Intelligence: Detects unusual volume-price relationships that signal institutional activity
Laguerre RSI: Zero-centered adaptive RSI that responds faster to price changes while filtering noise
Fisher Transform: Converts momentum into a Gaussian normal distribution for clearer extreme identification
True Strength Index: Double-smoothed momentum that separates genuine trends from noise
Money Flow Analysis: Tracks buying and selling pressure through volume-weighted price movements
Volume Confirmation: Integrates OBV and A/D Line to confirm momentum with volume flow
Regime Classification: Categorizes market conditions as Extreme Bull, Bullish, Neutral, Bearish, or Extreme Bear
Multi-Timeframe Alignment: Confirms momentum across higher timeframes for conviction measurement
Each component provides a different perspective on momentum. VFI shows volume-driven momentum, Laguerre RSI shows adaptive momentum, Fisher Transform shows statistical extremes, TSI shows smoothed directional momentum, MFI shows money flow momentum, and OBV/A/D show cumulative volume momentum. Together, they create a comprehensive view of institutional momentum positioning.
Core Components Explained
1. Volume Flux Indicator (VFI)
VFI measures the relationship between price movement and volume to identify institutional accumulation or distribution. The calculation uses logarithmic price changes and volume cutoffs to filter significant moves:
The indicator classifies volume-price relationships by comparing actual volume against average volume with a cutoff threshold. When price moves significantly with volume above the cutoff, it signals institutional participation. VFI is scaled and smoothed to create a momentum baseline that responds to volume-confirmed price movements.
2. Laguerre RSI (Zero-Centered)
Laguerre RSI applies a four-stage Laguerre filter to price data, creating an adaptive RSI that responds faster to recent price changes while maintaining smoothness. The zero-centered output ranges from -50 to +50, making it easier to identify bullish and bearish momentum:
The Laguerre filter uses a gamma parameter (default 0.4) to control responsiveness. Lower gamma values create faster response, while higher values create smoother output. The zero-centered format allows direct comparison with other momentum components.
3. Fisher Transform
The Fisher Transform converts the composite momentum into a Gaussian normal distribution, making extreme values more identifiable. This transformation compresses the middle range and expands the tails, creating clearer overbought and oversold signals:
The Fisher Transform output oscillates around zero with extreme values typically beyond +2 and -2. These extremes often precede reversals as momentum reaches unsustainable levels.
4. True Strength Index (TSI)
TSI applies double exponential smoothing to price momentum, creating a smooth oscillator that filters out short-term noise while preserving trend direction. The calculation uses two EMA periods (default 25 and 13) to separate signal from noise:
TSI values above zero indicate bullish momentum, while values below zero indicate bearish momentum. The double smoothing reduces whipsaws while maintaining responsiveness to genuine momentum shifts.
5. Money Flow Index (MFI)
MFI is a volume-weighted RSI that measures buying and selling pressure. It calculates the ratio of positive money flow (volume on up days) to negative money flow (volume on down days):
MFI values above 80 indicate overbought conditions with high volume, while values below 20 indicate oversold conditions with high volume. The indicator normalizes MFI to a zero-centered scale for integration with other components.
6. On-Balance Volume (OBV) and Accumulation/Distribution (A/D)
OBV and A/D track cumulative volume flow to confirm momentum direction. OBV adds volume on up days and subtracts on down days, while A/D weights volume by the close's position within the day's range:
Both indicators are normalized to a 0-100 scale and then zero-centered for composite integration. Rising OBV/A/D with rising momentum confirms institutional accumulation, while falling OBV/A/D with rising price warns of distribution.
Quantum Flux Core Calculation
The Quantum Flux Core combines all components using weighted averaging:
Quantum Flux = (VFI × 0.20) + (Laguerre RSI × 0.20) + (Fisher × 0.15) + (TSI × 0.15) + (MFI × 0.10) + (OBV × 0.10) + (A/D × 0.05) + (CMF × 0.05)
This weighted approach emphasizes volume-driven components (VFI, Laguerre) while incorporating smoothed momentum (Fisher, TSI) and volume confirmation (MFI, OBV, A/D, CMF). The result is smoothed with an EMA to create the final Quantum Flux line.
Regime Classification System
The indicator classifies market conditions into five regimes based on Quantum Flux levels:
Extreme Bull (QF > 35): Institutional buying pressure at extreme levels, potential exhaustion
Bullish (QF > 25): Strong bullish momentum with institutional participation
Neutral (-25 < QF < 25): Balanced conditions, no clear institutional bias
Bearish (QF < -25): Strong bearish momentum with institutional selling
Extreme Bear (QF < -35): Institutional selling pressure at extreme levels, potential capitulation
Regime shifts often precede significant price moves as institutional positioning changes. The indicator tracks regime changes and generates signals when momentum confirms directional bias.
Multi-Timeframe Alignment
The indicator requests Quantum Flux data from three customizable higher timeframes (default: 5m, 15m, 60m) and calculates alignment:
Strong Aligned (3/3): All timeframes show bullish/bearish momentum - high conviction
Aligned (2/3): Majority timeframes confirm - moderate conviction
Weak (1/3): Only one timeframe confirms - low conviction
No Alignment (0/3): No timeframe confirmation - conflicting signals
Strong alignment across multiple timeframes indicates institutional participation at scale, as large orders are often split across timeframes to minimize market impact.
Velocity and Acceleration Tracking
The indicator calculates momentum velocity (rate of change) and acceleration (change in velocity):
Velocity: Current Quantum Flux minus previous bar's value
Acceleration: Current velocity minus previous velocity (second derivative)
Accelerating momentum often precedes breakouts as institutional orders hit the market. Decelerating momentum warns of potential reversals or consolidation.
Visual Elements
Quantum Flux Line: Main oscillator with regime-based color coding (cyan = extreme bull, aqua = bullish, yellow = neutral, red = bearish, magenta = extreme bear)
Threshold Lines: Horizontal lines at +35 (extreme overbought), +25 (overbought), 0 (zero line), -25 (oversold), -35 (extreme oversold)
Velocity Histogram: Shows momentum velocity with color-coded bars (green = rising, red = falling)
Acceleration Columns: Displays momentum acceleration to identify momentum shifts early
Regime Strength Bars: Visual regime indicator showing current market condition strength
Gradient Glow Effect: Multiple layered fills create a glowing effect that emphasizes momentum intensity
Information Dashboard: Comprehensive table displaying all metrics in real-time with color-coded cells
The dashboard displays 10 key metrics: Regime, Flux Value, HTF Confirmation, MFI, CMF, Velocity, Divergence, Volume, and Signal status.
Signal Generation
The indicator generates two types of signals:
Primary Reversal Signals:
Bullish Reversal: Quantum Flux in extreme oversold (< -35), rising momentum, positive velocity acceleration, and HTF confirmation
Bearish Reversal: Quantum Flux in extreme overbought (> 35), falling momentum, negative velocity acceleration, and HTF confirmation
Momentum Crossover Signals:
Bullish Momentum: Quantum Flux crosses above -25 (oversold threshold) with positive velocity and volume confirmation
Bearish Momentum: Quantum Flux crosses below +25 (overbought threshold) with negative velocity and volume confirmation
Signals include anti-overlap logic to prevent signal clustering and ensure clean chart presentation.
Divergence Detection
The indicator detects both regular and hidden divergences between price and Quantum Flux:
Regular Bullish Divergence: Price makes lower low, Quantum Flux makes higher low (potential reversal up)
Regular Bearish Divergence: Price makes higher high, Quantum Flux makes lower high (potential reversal down)
Hidden Bullish Divergence: Price makes higher low, Quantum Flux makes lower low (trend continuation up)
Hidden Bearish Divergence: Price makes lower high, Quantum Flux makes higher high (trend continuation down)
Divergences are drawn with clean lines (solid for regular, dashed for hidden) without text clutter.
How to Use This Indicator
Step 1: Monitor Regime Classification
Watch for regime shifts between Extreme Bear, Bearish, Neutral, Bullish, and Extreme Bull. Regime changes often precede significant price moves.
Step 2: Check Multi-Timeframe Alignment
Strong alignment (3/3) across timeframes confirms institutional conviction. Weak or no alignment suggests retail-driven moves that may lack follow-through.
Step 3: Analyze Velocity and Acceleration
Accelerating momentum (positive acceleration) often precedes breakouts. Decelerating momentum (negative acceleration) warns of potential reversals.
Step 4: Look for Divergences
Regular divergences at extreme levels (QF > 35 or < -35) often signal reversals. Hidden divergences confirm trend continuation.
Step 5: Confirm with Volume Metrics
Check MFI, CMF, OBV, and A/D for confirmation. Rising volume metrics with rising Quantum Flux confirms institutional accumulation.
Step 6: Wait for Signal Confirmation
Primary reversal signals at extreme levels with HTF confirmation provide highest probability setups. Momentum crossover signals work best in trending markets.
Best Practices
Use on liquid instruments (major forex pairs, large-cap stocks, major crypto) for most reliable signals
Combine with price action analysis - momentum shows intent, price shows result
Pay attention to extreme levels (QF > 35 or < -35) as these often precede reversals
MTF alignment is most reliable in trending markets, less reliable in choppy conditions
Extreme momentum can persist longer than expected during strong trends - use stops
Look for momentum divergences at key support/resistance levels for highest probability setups
Monitor velocity and acceleration for early warning signs of momentum shifts
Use the dashboard to quickly assess overall market condition and signal status
Indicator Limitations
Momentum analysis works best on liquid instruments with consistent volume patterns
Low-volume instruments or off-market hours can produce unreliable readings
MTF alignment requires sufficient data on all timeframes - may not work on newly listed instruments
Momentum precedes price but doesn't guarantee direction - high momentum can occur on both breakouts and fakeouts
Extreme momentum levels can persist longer than expected during major news events or market dislocations
The indicator shows what is happening, not why - fundamental catalysts can override technical momentum patterns
Divergences are more reliable at extreme levels than in neutral zones
Multiple components mean the indicator can be slower to respond than single-component oscillators
Input Parameters
Core Engine:
Primary Length: Period for momentum calculations (default: 14)
Smoothing Period: EMA smoothing for final output (default: 7)
Sensitivity Factor: Multiplier for Fisher Transform input (default: 1.5)
Volume Flux Engine:
VFI Coefficient: Cutoff multiplier for significant moves (default: 0.2)
Volume Cutoff: Maximum volume multiplier (default: 2.5)
Scale Multiplier: VFI output scaling (default: 4.0)
Laguerre Transform:
Gamma: Responsiveness parameter (default: 0.4, lower = faster)
Threshold Zones:
Extreme Overbought: Upper extreme threshold (default: 35)
Overbought: Upper threshold (default: 25)
Oversold: Lower threshold (default: -25)
Extreme Oversold: Lower extreme threshold (default: -35)
Money Flow & Volume:
MFI Length: Period for Money Flow Index (default: 14)
OBV Smoothing: Smoothing period for OBV (default: 14)
A/D Smoothing: Smoothing period for A/D Line (default: 14)
Multi-Timeframe Analysis:
Enable Higher Timeframe: Toggle MTF calculations (default: enabled)
HTF Timeframe 1/2/3: Customizable timeframes (default: 5m, 15m, 60m)
Visual Configuration:
Color Theme: Choose from Gradient Glow, Professional Dark, Neon Spectrum, or Institutional Grey
Bullish/Bearish Spectrum: Customizable colors for momentum direction
Glow Layers: Number of gradient layers for glow effect (default: 20)
Show Divergence: Toggle divergence detection (default: enabled)
Show Volume Profile: Toggle volume profile histogram (default: enabled)
Technical Implementation
Built with Pine Script v6 using:
Custom VFI calculations with logarithmic price changes and volume cutoffs
Four-stage Laguerre filter for adaptive RSI
Fisher Transform for Gaussian distribution conversion
Double-smoothed TSI for noise filtering
Volume-weighted MFI calculations
Normalized OBV and A/D Line integration
Multi-timeframe security requests with proper lookahead settings
Velocity and acceleration calculations for momentum derivatives
Real-time regime classification system
Dynamic dashboard with 10 metrics and color-coded cells
Gradient glow effect with multiple layered fills
Divergence detection with pivot analysis
The code is fully open-source and can be modified to suit individual trading styles and preferences.
Originality Statement
This indicator is original in its comprehensive integration approach. While individual components (VFI, Laguerre RSI, Fisher Transform, TSI, MFI, OBV, A/D) are established concepts, this indicator is justified because:
It synthesizes six distinct momentum methodologies into a unified weighted composite system
The regime classification provides institutional momentum measurement not available in standard oscillators
Multi-timeframe alignment detection measures institutional conviction across timeframes
Velocity and acceleration calculations provide early warning of momentum shifts
The gradient glow visualization creates intuitive momentum intensity display
Integration of volume-weighted components (VFI, MFI) with smoothed momentum (Fisher, TSI) and cumulative volume (OBV, A/D) creates layered confirmation
The comprehensive dashboard presents 10 metrics simultaneously for holistic momentum analysis
Each component contributes unique information: VFI shows volume-driven momentum, Laguerre RSI shows adaptive momentum, Fisher Transform shows statistical extremes, TSI shows smoothed momentum, MFI shows money flow, OBV shows cumulative volume, and A/D shows distribution. The indicator's value lies in presenting these complementary perspectives simultaneously with a unified regime classification system.
Disclaimer
This indicator is provided for educational and informational purposes only. It is not financial advice or a recommendation to buy or sell any financial instrument. Trading involves substantial risk of loss and is not suitable for all investors.
Momentum analysis is a tool for understanding market dynamics, not a crystal ball for predicting future price movement. High momentum does not guarantee profitable trades. Past momentum patterns do not guarantee future momentum patterns. Market conditions change, and strategies that worked historically may not work in the future.
The metrics displayed are mathematical calculations based on current market data, not predictions of future price movement. Extreme momentum levels, regime classifications, and signal generation do not guarantee profitable trades. Users must conduct their own analysis and risk assessment before making trading decisions.
Always use proper risk management, including stop losses and position sizing appropriate for your account size and risk tolerance. Never risk more than you can afford to lose. Consider consulting with a qualified financial advisor before making investment decisions.
The author is not responsible for any losses incurred from using this indicator. Users assume full responsibility for all trading decisions made using this tool.
-Made with passion by officialjackofalltrades Indicateur
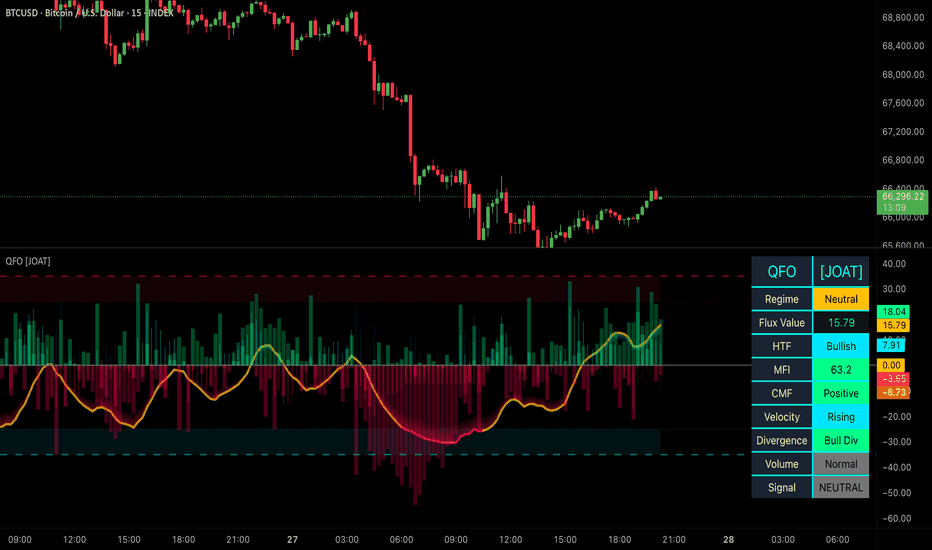
RSI Entry EngineRSI Entry Engine
RSI Entry Engine is an open-source RSI-based entry framework built around one specific analytical idea:
when a smoothed RSI leaves an extreme condition and reclaims back through a defined threshold, that reclaim can be treated as a structured entry event rather than as a generic oscillator fluctuation.
This script is not designed to mark every RSI movement, and it is not intended to behave like a generic “overbought / oversold indicator” that treats all oscillator readings the same way. Its purpose is to smooth RSI behavior, define a hierarchy of RSI states, detect reclaim-style transitions out of extreme zones, and optionally map those reclaim events into a projected risk framework directly on the price chart.
The script also includes a compact status panel and an alert structure so users can monitor RSI condition, internal signal state, and projected trade behavior in a more organized way. These features are included to support analysis and review, not to imply future performance.
OPEN-SOURCE NOTE
This script is published open-source so users can inspect the logic directly, verify what the script is doing, and adapt parts of the workflow for their own research if they wish.
Even though the code is open, this description is intentionally detailed because many TradingView users do not read Pine Script. The goal is for a user to understand what the script does, how it works, why its parts belong together, and how it may be used in practice without having to study the code line by line.
OVERVIEW
At a high level, the script does seven things:
1. It calculates a base RSI from a selected source and length.
2. It optionally smooths that RSI and also derives a separate signal line from the smoothed RSI.
3. It organizes RSI values into multiple zones such as overbought, oversold, extreme high, extreme low, bullish, bearish, and neutral.
4. It detects reclaim-style entry signals when the smoothed RSI exits an extreme condition by crossing back through the selected extreme boundary.
5. It can project entry, stop loss, and take profit structure onto the main chart.
6. It can maintain a compact status panel summarizing RSI state, momentum, and structure.
7. It provides alert conditions for RSI / signal crosses, reclaim events, centerline transitions, and optional trade outcomes.
The script is therefore meant to function as a complete RSI reclaim-entry and review framework rather than as a single-purpose oscillator plot.
CORE IDEA
Many RSI tools are used in one of two broad ways:
- as a visual overbought / oversold reference,
- or as a simple cross-based signal tool.
This script takes a narrower and more structured approach.
Its main idea is that a reclaim out of an extreme zone may be more useful than the extreme reading by itself.
In other words, the script does not assume that simply being overbought or oversold is enough. Instead, it focuses on the transition that occurs when smoothed RSI moves out of a more extreme condition and crosses back through a defined reclaim threshold.
That is the reason the main signal model is based on:
- reclaim above the extreme-low boundary for a bullish entry event,
- reclaim below the extreme-high boundary for a bearish entry event.
This means the script is not centered on “RSI is high” or “RSI is low” alone. It is centered on the moment when a smoothed oscillator moves from extreme positioning into a reclaim state that can be interpreted as a structured shift in short-term momentum.
WHY THIS SCRIPT IS NOT A SIMPLE MASHUP
This script combines several components, but they are not included simply to add more features to one publication.
Each part has a specific role inside the same analytical workflow:
- The RSI engine defines the core oscillator state.
- The smoothing layer reduces noise and makes reclaim logic less reactive to small fluctuations.
- The signal line provides a secondary internal reference for oscillator structure.
- The zone system divides RSI behavior into interpretable states such as neutral, bullish, bearish, oversold, overbought, and extreme conditions.
- The reclaim logic defines the actual entry event.
- The trade projection layer maps that event onto the price chart using entry, stop, and target logic.
- The panel and alerts organize the resulting information for monitoring and review.
These parts are interdependent.
Without RSI calculation, there is no oscillator framework.
Without smoothing, reclaim logic becomes more sensitive to noise.
Without the level structure, reclaim events lose contextual meaning.
Without the reclaim rule, the script becomes a more generic RSI plot.
Without trade projection, the user still has to manually draw entry, stop, and target after each signal.
Without the panel and alerts, the script offers less structure for monitoring and review.
For that reason, the script is intended as a single RSI reclaim-entry framework, not as a random collection of unrelated features.
WHAT THE SCRIPT DOES
The script calculates RSI from a selected source and length, then optionally smooths it using one of several averaging methods.
It also creates a signal line from the smoothed RSI.
Once those two internal series exist, the script can:
- classify RSI state using multiple threshold levels,
- highlight extreme conditions visually,
- detect reclaim signals out of extreme zones,
- plot labels on the RSI pane,
- project BUY / SELL trade structures on the main price chart,
- update TP / SL boxes over time,
- show a compact state panel,
- create alerts for multiple RSI-related events.
This means the script is not just an oscillator display. It is an oscillator-driven entry framework with optional on-chart trade projection.
HOW THE SCRIPT WORKS
1) RSI ENGINE
The script begins with a standard RSI calculation based on a user-selected source and length.
That raw RSI can then be smoothed using one of several methods:
- None,
- EMA,
- SMA,
- RMA.
The smoothed RSI is the main series used for interpretation and signaling.
A second line called the signal line is then derived from the smoothed RSI using its own smoothing method and length.
This creates two internal oscillator references:
- the smoothed RSI itself,
- and a signal line built from that smoothed RSI.
The spread between those two series is also used in the panel to describe whether RSI is currently above or below its signal structure.
2) RSI STATE MODEL
The script does not treat RSI as a single binary oscillator. It organizes RSI values into multiple states:
- Extreme High,
- Overbought,
- Bullish,
- Neutral,
- Bearish,
- Oversold,
- Extreme Low.
These states are determined by the user-defined threshold levels:
- Overbought,
- Oversold,
- Extreme High,
- Extreme Low,
- and the centerline area around 50.
This state model is important because it gives the reclaim signals context. A reclaim signal is not interpreted in isolation; it is interpreted relative to where the smoothed RSI has been and which region it is leaving.
3) LEVEL STRUCTURE
The script plots:
- 0,
- 100,
- 50 centerline,
- Overbought,
- Oversold,
- Extreme High,
- Extreme Low.
It also fills the overbought and oversold regions for easier visual reading, and can optionally highlight the background when RSI is in an extreme condition.
This visual structure is not only cosmetic. It helps the user see why the script treats certain transitions differently from ordinary oscillator movement.
4) PRIMARY ENTRY SIGNAL MODEL
The main entry logic is reclaim-based.
Bullish entry event:
- the smoothed RSI crosses upward through the Extreme Low level,
- and the bar must be confirmed on close.
Bearish entry event:
- the smoothed RSI crosses downward through the Extreme High level,
- and the bar must be confirmed on close.
This means the script does not trigger merely because RSI becomes extreme. Instead, it waits for RSI to transition back through the selected extreme boundary.
That distinction is important.
A low RSI reading alone can persist for multiple bars.
A reclaim above the extreme-low threshold is a different event.
Likewise, a high RSI reading alone can persist,
but a reclaim downward through the extreme-high threshold is a different event.
The script is built around that reclaim event rather than around static RSI position alone.
5) BAR-CLOSE CONFIRMATION
Signals are confirmed only on bar close.
This is an important implementation detail because RSI can move intrabar and then reverse before the bar closes. By requiring confirmation on the close, the script avoids treating temporary intrabar movement as a completed reclaim signal.
This makes the signal model more conservative and more stable.
6) OPTIONAL TRADE PROJECTION
When a valid bullish or bearish reclaim signal appears, the script can optionally project a trade framework onto the main price chart.
This is done even though the script itself is plotted in a separate RSI pane.
Depending on settings, the projection includes:
- entry reference,
- stop-loss calculation,
- take-profit projection,
- TP box,
- SL box,
- entry line,
- BUY or SELL label.
The user can choose the entry reference method:
- Close,
- Open,
- HLC3.
The user can also choose the stop-loss mode:
- Signal Candle,
- ATR,
- Percent.
This means the script separates signal generation from risk projection. The reclaim event comes from RSI behavior, but the projected stop logic can be adapted to different preferences.
7) STOP-LOSS MODES
The script supports three stop-loss methods:
Signal Candle:
The stop is based on the high or low of the signal candle, depending on trade direction.
ATR:
The stop is based on ATR distance from the projected entry.
Percent:
The stop is based on a percentage distance from entry.
This allows the same reclaim signal model to be projected using different risk frameworks without changing the core RSI logic.
8) TAKE-PROFIT PROJECTION
Take profit is projected using a risk/reward multiple applied to the chosen stop distance.
This means the target is not arbitrary. It is derived from the actual stop distance created by the selected stop-loss mode and then multiplied by the chosen RR value.
This makes the trade projection internally consistent:
signal
→ entry method
→ stop-loss method
→ risk distance
→ take-profit distance.
9) SAME-BAR TP / SL PRIORITY
The script includes an explicit rule for bars where both TP and SL appear to be touched after entry.
The user can choose whether the same-bar priority should be:
- SL,
- or TP.
This is an important implementation detail because it affects projected review behavior. Without an explicit priority rule, same-bar ambiguity can produce inconsistent outcome interpretation.
10) TRADE BOX MAINTENANCE
The script stores projected trades internally and extends TP / SL boxes and entry lines forward as long as the trade remains active.
It also limits how many historical projected trades remain visible by using a maximum stored trade setting. This keeps the chart more manageable and prevents the projection layer from expanding indefinitely.
11) STATUS PANEL
The script includes a compact panel that can display:
- the current RSI value,
- the signal-line value,
- the current RSI state,
- short-term momentum direction based on RSI change,
- whether RSI is above or below its signal line.
This panel is designed to summarize the oscillator’s state without requiring the user to read every value directly from the plot.
12) ALERT STRUCTURE
The script can generate alerts for several types of events:
- RSI crossing above its signal line,
- RSI crossing below its signal line,
- RSI reclaiming above oversold,
- RSI rejecting below overbought,
- RSI crossing above the centerline,
- RSI crossing below the centerline,
- bullish reclaim entry signal,
- bearish reclaim entry signal,
- projected TP hit,
- projected SL hit.
This allows the script to be used either visually or as an alert-based monitoring tool.
WHAT MAKES THIS SCRIPT ORIGINAL
This script uses familiar technical-analysis building blocks such as:
- RSI,
- smoothing methods,
- threshold zones,
- ATR-based risk projection,
- percentage-based stops,
- RR-based targets,
- on-chart annotation.
Those building blocks are not original by themselves.
The originality of this script is not in inventing a completely new oscillator primitive. The originality lies in how those familiar elements are arranged into one structured RSI reclaim workflow:
RSI calculation
→ smoothing
→ signal-line derivation
→ multi-zone RSI state model
→ reclaim detection out of extreme conditions
→ optional on-chart trade projection
→ panel-based monitoring
→ alert and review behavior
That full sequence is the main reason this script exists as its own publication.
It is not intended to be simply another RSI plot, another overbought / oversold overlay, another signal-line cross tool, or another TP / SL box script. It is specifically an RSI reclaim-entry framework that combines oscillator conditioning, reclaim detection, projection, and monitoring in one workflow.
WHAT APPEARS ON THE CHART
Depending on settings, the script may display in the RSI pane:
- smoothed RSI,
- the signal line,
- 0 / 100 bounds,
- centerline,
- overbought and oversold levels,
- extreme-high and extreme-low levels,
- overbought / oversold zone fill,
- optional extreme background highlights,
- UP / DOWN labels,
- a status panel.
On the main price chart, it may also display:
- BUY / SELL labels,
- entry line,
- TP box,
- SL box,
- TP hit labels,
- SL hit labels.
This split design is intentional. RSI analysis remains in the oscillator pane, while projected execution structure appears on the price chart.
HOW TO USE THE SCRIPT
A practical workflow is:
1. Add the script to a chart and choose the RSI source and RSI length.
2. Select whether the RSI should remain raw or be smoothed.
3. Configure the signal line used for internal oscillator structure.
4. Set the overbought, oversold, extreme-high, and extreme-low thresholds.
5. Decide whether you want trade projection on the main chart.
6. Choose entry mode, stop-loss mode, and risk/reward multiple.
7. Wait for a bullish or bearish reclaim signal to be confirmed on bar close.
8. Use the projected trade structure as an analysis framework rather than as a blind instruction.
9. Use the panel and alerts to monitor RSI state and signal transitions.
10. Adjust settings only after reviewing how the same logic behaves across the symbols and timeframes you actually use.
This script is best understood as a structured decision-support and review tool, not as a self-sufficient automated trading system.
SETTINGS REFERENCE
RSI Engine
- RSI Source: input source used for RSI calculation.
- RSI Length: length of the base RSI.
- RSI Smoothing: smoothing method applied to raw RSI.
- Smoothing Length: length of the first smoothing stage.
- Signal Length: length of the signal line.
- Signal Smoothing: smoothing method used for the signal line.
Zones
- Overbought: upper reference threshold.
- Oversold: lower reference threshold.
- Extreme High: upper extreme reclaim boundary.
- Extreme Low: lower extreme reclaim boundary.
Visuals
- Highlight Extreme Background: highlights the panel background during extreme conditions.
- Show Status Panel: enables or disables the panel.
- Panel Position: controls panel location.
- Panel Text Size: controls panel text size.
Trade Engine
- Show TP / SL Boxes On Main Chart: enables or disables price-chart projection.
- Entry Price: selects the projected entry reference.
- Stop Loss Mode: selects how stop loss is calculated.
- Risk Reward: sets the take-profit multiple.
- ATR Length: ATR length used when ATR stop mode is selected.
- ATR Multiplier: ATR multiplier used for ATR stop mode.
- Percent Stop Loss: percentage stop value used in Percent mode.
- Same Bar TP/SL Priority: defines which outcome wins when both are touched on one bar.
- Max Stored Trade Boxes: limits how many projected historical trades remain visible.
Alerts
- Enable RSI / Signal Cross Alerts: alerts for oscillator / signal crosses.
- Enable OB / OS Reclaim Alerts: alerts for reclaim behavior around overbought / oversold.
- Enable Centerline Alerts: alerts for 50-line crosses.
- Enable Entry Signal Alerts: alerts for bullish and bearish reclaim entries.
- Enable TP / SL Hit Alerts: alerts for projected trade outcomes.
IMPORTANT PRACTICAL NOTES
This script depends heavily on the chosen RSI thresholds.
If thresholds are too wide, signals may become very rare.
If thresholds are too narrow, signals may become too frequent.
Signal quality and frequency will also change depending on:
- RSI length,
- smoothing method,
- signal-line length,
- timeframe,
- symbol volatility,
- stop-loss mode.
Because trade projection is built from RSI events rather than from direct price-structure analysis, the projected boxes should be understood as a standardized review layer, not as proof that the market itself respects those projected levels.
LIMITATIONS AND SHORTCOMINGS
This script has important limitations:
- It is an oscillator-based reclaim model, not a full market-structure system.
- It does not identify support and resistance or discretionary chart structure.
- It does not claim that all extreme RSI conditions will reverse.
- It does not use volume profile, order flow, or trend structure beyond the oscillator model itself.
- Its signals depend on smoothing choices and threshold definitions.
- Projected TP / SL outcomes depend on the chosen entry and stop-loss method.
- Same-bar ambiguity is handled by a rule, not by true intrabar reconstruction.
- Historical projected trade behavior should not be interpreted as guaranteed live performance.
- No RSI-based reclaim model can remove all false signals or all regime-dependent behavior.
For those reasons, the script should be used as a structured analysis and review framework, not as a promise of future profitability.
WHO THIS SCRIPT MAY BE USEFUL FOR
This script may be useful for traders who:
- use RSI as a state and transition tool rather than as a static threshold indicator,
- care about reclaim behavior out of extreme zones,
- want optional projected risk structure on the price chart,
- want a compact RSI-state panel,
- want alert-based monitoring of oscillator events.
It may be less suitable for traders who:
- want a pure trend-following tool,
- want structural support / resistance logic,
- want a complete strategy with no need for outside confirmation,
- want projected trade statistics to be treated as live-execution evidence.
DISCLAIMER
This script is provided for educational and informational purposes only.
It does not constitute financial, investment, or trading advice.
Market conditions change, historical behavior does not guarantee future results, and users should perform their own analysis, validation, and risk management before using the script in live decision-making. Indicateur

Blanco V3 (PRO MTF System)**Blanco V3 – Advanced Precision Trading System**
Blanco V3 is the next evolution of the Blanco series, designed to deliver **precision entries, stronger confirmations, and cleaner decision-making**. It builds on the foundation of Blanco V1 and V2 by enhancing timing, filtering noise, and introducing smarter multi-timeframe alignment.
At its core, Blanco V3 uses a **Zero Lag EMA (ZLEMA)** to reduce delay and detect trend direction faster than traditional indicators. Combined with advanced filters, it helps traders enter earlier while avoiding weak or late setups.
---
### ⚙️ Intelligent Trading Modes
Blanco V3 features three adaptive modes that dynamically adjust strictness:
* **Aggressive Mode**
Faster signals with more entries. Ideal for scalping and lower timeframes.
* **Balanced Mode (Recommended)**
Optimized for consistency. Balances signal quality and frequency.
* **Conservative Mode**
Focuses only on the strongest setups. Best for swing trading and higher timeframes.
Each mode automatically adjusts:
* Trend strength thresholds (ADX)
* Momentum requirements (RSI)
* Entry precision (pullback sensitivity)
---
### 📊 Signal System
Blanco V3 delivers a refined 3-layer signal structure:
#### 🔺 Entry Signals (Precision Arrows)
Small arrows mark optimized entry points using:
* Pullbacks toward the ZLEMA
* Momentum confirmation (RSI alignment)
* Strong trend validation (ADX filter)
* Candle strength (price action confirmation)
These signals are designed to **improve timing and avoid chasing price**.
---
#### 🟢 BUY / 🔴 SELL Labels (Trend Confirmation)
Larger labels appear when the overall trend shifts direction, helping traders identify:
* Swing entries
* Trend reversals
* Continuation opportunities
---
#### ❗ Elite Signals (Full Alignment)
Blanco V3 introduces enhanced **Elite Signals**, which appear only when:
* A valid entry signal is triggered
* AND all monitored timeframes are aligned
These signals represent the **highest-probability setups**, combining trend, momentum, and full market agreement.
---
### 🧠 Multi-Timeframe Intelligence
Blanco V3 includes a bright, easy-to-read dashboard showing trend direction across:
* 5-minute
* 15-minute
* 30-minute
* 1-hour
* 2-hour
* 4-hour
Each timeframe is color-coded:
* 🟢 Green = Bullish
* 🔴 Red = Bearish
---
### 🔍 Smart Confirmation Logic (NEW)
Blanco V3 improves flexibility and accuracy with:
* **Partial Alignment (4/6 or more)**
Allows earlier entries while maintaining quality
* **Full Alignment (6/6)**
Triggers ❗ Elite Signals for maximum confidence
* **Noise Reduction Filters**
Avoids sideways markets and weak momentum conditions
---
### 🎯 Strategy Philosophy
Blanco V3 is designed around one key principle:
> **Trade with the trend, enter on pullbacks, and confirm with alignment.**
It focuses on:
* Entering **after retracements**, not breakouts
* Trading only in **strong market conditions**
* Aligning with **higher timeframe direction**
---
### ⚠️ Best Use
* Best on **1H and 4H charts**
* Works best in **trending markets**
* Combine with:
* Risk management
* Support & resistance
* Market structure
---
### 📌 Quick Guide
* 🔺 Arrows = precise entries
* 🟢 BUY / 🔴 SELL = trend shifts
* ❗ = elite high-probability trades
* 📊 Dashboard = multi-timeframe confirmation
---
**Blanco V3 is built for traders who want cleaner charts, smarter entries, and higher-quality signals — all in one system.**
Indicateur

Auto Parallel Channel - Trend & Reversal TrackerThis indicator automates a highly specific and effective manual charting technique for tracking trends and identifying potential reversal zones. It is designed to help traders visualize dynamic parallel channels without the hassle of constantly redrawing lines, making it especially useful for timing short entries or spotting bottom reversals in volatile markets like crypto and forex.
How It Works:
Unlike standard channel indicators that simply connect the highest highs and lowest lows, this script uses a refined pivot-based logic. During a downtrend, it identifies the last three Pivot Lows (PL) and the last Pivot High (PH). It constructs the foundational trendline by connecting the intermediate lows and projects a perfectly parallel upper boundary starting from the last confirmed PH.
Key Features:
Custom Key Levels: Includes specific internal and external parallel levels (-0.12, 0, 0.12, 0.5, 0.88, 1.0, 1.12) to identify precise support, resistance, and breakout zones.
Dynamic Peak Tracking (Prediction Line): Features a unique "memory" line. Before a new pivot is fully confirmed, a dashed tracking line anchors to the absolute highest price seen since the last Pivot High. This acts as an early-warning prediction channel that adjusts dynamically as price pushes higher, but stays firmly anchored if price drops.
Clean Chart Management: Prevents chart clutter by automatically limiting the number of historical channels shown at once (customizable).
Smart History Extension: Old channels don't just disappear or stretch to infinity. They are systematically frozen and extended backward/forward by a user-defined number of bars, allowing you to backtest how price reacted to past channel structures.
Customizable Settings:
Pivot Length: Adjust the sensitivity of pivot detection (Default: 25).
History Extension Bars: Control how far historical channel lines project into the past/future (Default: -65).
Max Historical Channels: Keep your chart clean by limiting visible past channels (Default: 3).
Toggles: Easily turn dynamic tracking, historical lines, and pivot labels on or off.
Whether you are riding a trend or looking for the exact moment a downtrend loses momentum, this automated channel system keeps your charts clean, precise, and highly actionable. Indicateur

Alpha Signal Engine [MarkitTick]💡 The Alpha Signal Engine is an advanced, multi-dimensional trend-following system designed to provide traders with highly filtered, high-probability market signals. At its core, it dynamically calculates a volatility-adjusted trailing band to determine the primary market direction. However, unlike traditional trend indicators that rely on a single data point, this engine passes every potential trend reversal through a rigorous, six-layer filtering mechanism. By requiring confluence across higher timeframe trends, momentum, volume, volatility regimes, and price action strength, it drastically reduces the noise and false signals inherent in choppy markets. It also features a built-in heads-up dashboard and fully formatted JSON webhook capabilities for automated trading integration.
✨ Originality and Utility
● A Dynamic, Adaptive Baseline
Standard trailing stop or trend indicators, such as the classic Supertrend, typically use a static multiplier against the Average True Range (ATR). The Alpha Signal Engine innovates by introducing a "Dynamic Factor." This factor continuously adapts the band's distance from price by factoring in the current baseline multiplier, the relative volatility (ATR normalized by price), and the immediate price change momentum. This allows the bands to tighten during periods of strong, directional momentum and widen during erratic volatility, providing a more responsive and intelligent trailing mechanism.
● The Six-Pillar Filtering Gateway
The true utility of this indicator lies in its modular filtering engine. Traders often have to clutter their charts with half a dozen indicators to confirm a setup. This script centralizes that logic. Users can selectively enable or disable filters based on their specific asset and trading style, turning the indicator into a customizable algorithmic engine. Whether you need volume confirmation, ADX trend strength, or simple RSI momentum, the script handles the complex boolean logic internally and only outputs a signal when your precise market conditions are met.
🔬 Methodology and Concepts
● Dynamic Factor Calculation
The indicator establishes its baseline trend using an upper and lower band. The distance of these bands from the median price is dictated by a dynamically calculated factor. This factor is the sum of a base value, a volatility component (ATR divided by Close, scaled by a user weight), and a price movement component (percentage change of the close, scaled by a user weight). This raw factor is then smoothed using a Simple Moving Average (SMA) to prevent erratic band shifts.
● Trend Determination
The trend direction flips when the closing price crosses the active dynamic band. If the price closes above the upper band, the trend shifts bullish, and the lower band becomes the active support. Conversely, closing below the lower band shifts the trend bearish, making the upper band the active resistance.
● The Filter Matrix
A signal is only generated when a trend flip aligns with all activated filters:
HTF Alignment: Uses the request context to pull the trend direction from a higher timeframe, ensuring you are not trading against the macro trend.
ADX Trending: Measures the Average Directional Index to ensure the market is in an active trending phase (above a defined threshold) rather than a sideways chop.
Volume Surge: Compares current volume against a Volume SMA. The current bar must exhibit a volume spike greater than the defined multiplier to confirm institutional participation.
RSI Momentum: A simple but effective gatekeeper requiring the Relative Strength Index to be above 50 for longs and below 50 for shorts.
ATR Volatility Regime: Compares the current ATR against a 50-period SMA of the ATR. It ensures the market is operating within a "normal" volatility ratio, preventing entries during extreme, unpredictable volatility spikes or dead, illiquid periods.
Candle Body Strength: Calculates the absolute size of the candle body (Open to Close) and mandates it must be larger than a specific fraction of the ATR, ensuring the signal candle has true directional conviction.
🎨 Visual Guide
● Chart Elements
Up Trend Line: Displayed as a solid, teal-colored line trailing below the price action during a bullish phase. It acts as dynamic support.
Down Trend Line: Displayed as a solid, bright pink/red line trailing above the price action during a bearish phase. It acts as dynamic resistance.
Trend Cloud (Fill): A colored gradient fill exists between the median price and the active trend line. A teal cloud visually represents bullish dominance, while a pink/red cloud represents bearish dominance.
Buy Signals: Indicated by small, teal "B" labels positioned below the signal candle.
Sell Signals: Indicated by small, pink/red "S" labels positioned above the signal candle.
● Filter Dashboard
Located in the top right corner of the chart, this HUD (Heads-Up Display) provides a real-time status check of your system.
The left column lists the available filters (HTF Align, ADX Trend, Vol Surge, RSI Gate, ATR Regime, Body Str).
The right column displays the current status of each filter.
A gray "OFF" indicator means the user has disabled the filter in the settings.
A green "ON" or "Aligned" text indicates the condition is currently met.
A red "Opposed" or unlit indicator means the condition is active but currently failing to meet the required criteria.
The bottom rows clearly state the current overarching trend direction and whether a signal is pending or waiting.
📖 How to Use
• Interpreting the System
To effectively use the Alpha Signal Engine, begin by observing the main trend lines and the color of the cloud. This provides your baseline bias. Do not take trades purely on the band flipping. Instead, rely on the explicit "B" and "S" labels.
• Signal Execution
When a "B" (Buy) or "S" (Sell) label appears, it means the price has successfully flipped the trend AND all user-activated filters in the dashboard are glowing green. This is your entry trigger. The active trend line (the teal line for longs, the pink line for shorts) serves as an ideal, dynamic stop-loss placement.
• Customizing the Engine
The system is designed to be tuned. If you are trading a highly liquid asset like major forex pairs, you may want to enable the ADX and HTF filters to catch long, sustained moves. If you are trading volatile crypto assets, enabling the Volume Surge and Candle Body filters can help you avoid fake-outs and trap wicks. Monitor the on-chart dashboard to see which filters are keeping you out of bad trades and adjust your settings accordingly.
⚙️ Inputs and Settings
• Supertrend Settings
ATR Length: The lookback period for calculating the Average True Range.
Base Factor: The starting multiplier for the dynamic bands.
Volatility & Price Change Weights: Determines how aggressively the bands react to sudden spikes in relative volatility and price momentum.
Factor Smoothing: Applies an SMA to the final dynamic multiplier to keep the bands stable.
• Filter Settings
Enable HTF Alignment: Toggle and define the higher timeframe (e.g., Daily) to align with.
ADX Settings: Toggle the filter, define the lookback length, and set the minimum trend strength threshold (default is 20).
Volume Settings: Toggle the filter, define the Volume MA length, and set the multiplier required to classify as a "surge."
RSI Settings: Toggle the filter and set the RSI lookback length.
ATR Regime Settings: Define the minimum and maximum acceptable ratios of current ATR versus historical ATR.
Candle Body Settings: Define the minimum required size of the candle body as a fraction of the current ATR.
• Webhook Action Names
These text inputs allow you to define specific payload strings (e.g., "long", "closeshort") that the indicator will output via JSON alerts, perfectly formatting the data for third-party automation services like 3Commas or PineConnector.
🔍 Deconstruction of the Underlying Scientific and Academic Framework
The Alpha Signal Engine is grounded in several well-documented tenets of quantitative financial analysis and statistical market theory.
● Volatility-Adjusted Trailing Stops
The foundation of the indicator relies on the Average True Range (ATR), introduced by J. Welles Wilder Jr. The ATR is a measure of the degree of price volatility. By tying the trailing stop (the dynamic band) to the ATR, the system acknowledges the statistical reality of market variance. The innovation here is the dynamic multiplier. By adjusting the distance based on the normalized rate of change (momentum), the script attempts to solve the lagging nature of fixed-multiplier trailing stops, utilizing principles found in adaptive moving averages (like Kaufman's AMA), where sensitivity increases alongside directional conviction.
● Multi-Dimensional Confluence Theory
The filtering engine operates on the academic principle of conditional probability and confluence. In market microstructure, no single indicator holds a permanent statistical edge.
The HTF filter is rooted in Dow Theory, prioritizing the primary trend over secondary reactions.
The ADX filter utilizes Wilder's Directional Movement Index to mathematically separate trending environments from mean-reverting environments, applying a statistical threshold to directional strength.
The Volume Surge filter relies on the Volume Price Trend concepts, positing that significant price movements must be sponsored by outsized volume to validate institutional participation and avoid anomalous low-liquidity spikes.
The ATR Regime filter applies mean-reverting principles to volatility itself (volatility clustering), ensuring that entries are only taken when the variance of the asset is within historically "normal" parameters, avoiding the fat tails of extreme market shocks.
By chaining these disparate mathematical models (trend, momentum, volume, volatility) via Boolean logic, the system mathematically reduces the frequency of trades while theoretically increasing the probability of the remaining sample size.
⚠️ Disclaimer
All provided scripts and indicators are strictly for educational exploration and must not be interpreted as financial advice or a recommendation to execute trades. I expressly disclaim all liability for any financial losses or damages that may result, directly or indirectly, from the reliance on or application of these tools. Market participation carries inherent risk where past performance never guarantees future returns, leaving all investment decisions and due diligence solely at your own discretion. Indicateur

ORB Pro Suite v6ORB Pro Suite v6 — Multi-Session + HTF ORB Build
ORB Pro Suite v6 is an advanced Opening Range Breakout (ORB) tool designed for traders who want clarity, structure, and adaptability across NY, London, and Asia sessions — without changing the core ORB logic that works.
This update expands the original ORB Pro Suite to support overnight markets and multi-timeframe workflows, while keeping the strategy behavior consistent and familiar.
✅ Multi-Session Presets
Choose from built-in session presets:
NY AM (RTH) — original behavior (unchanged)
London
Asia
Custom
Each preset aligns the ORB window with the selected session and pairs seamlessly with session-appropriate filters.
✅ ORB Build Mode
You now have two ways to build your ORB:
1️⃣ Time Window (Classic ORB)
Uses session start/end times
Identical to previous versions
2️⃣ HTF Candle Count (Advanced)
Build the ORB from 5m / 15m / 30m / 60m candles
Works on any chart timeframe
Ideal for traders who want ORB consistency across TFs
Example:
Build a 15-minute ORB from 1× 15m candle, even while trading on a 5m chart.
✅ Session Profile Defaults
ORB Pro Suite introduces Session Profiles that automatically tune filters for different market conditions — without changing the strategy logic.
Profiles include:
NY (Default)
London (Breakout)
Asia (Slow Session)
Custom
You can toggle Profile Defaults ON or OFF at any time.
🧠 Core ORB Logic (Unchanged)
Original ORB framework:
Opening range high/low
Breakout confirmation
Optional retest logic
Golden Pocket (0.5–0.618) validation
Local + higher-timeframe trend filters
Cooldown protection
Visual risk/reward mapping
If you traded NY with earlier versions, nothing has changed.
⚙️ Recommended Starting Settings
For most users:
ORB Build Mode: Time Window
Session Profile: Auto
Strictness: Balanced
Advanced users:
Enable HTF Candle Count
Select desired ORB TF (5m–60m)
Adjust candle count to match your style
All inputs remain fully customizable.
📊 Designed For
Futures (ES, NQ, YM, RTY)
Forex pairs
Gold & major indices
Intraday price-action traders
Session-based trading workflows
⚠️ Disclaimer
This indicator is for educational and informational purposes only.
It does not constitute financial advice or trade recommendations.
Trading involves risk. Always manage risk appropriately and trade responsibly. Indicateur
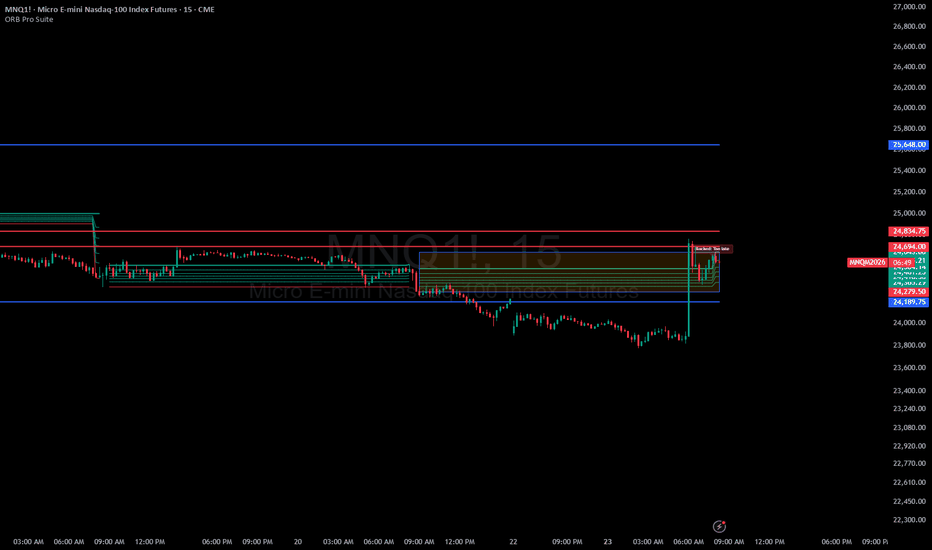
Gold Priceaction V2.001. Introduction
Welcome to Gold Priceaction V2.00, an incredibly powerful, all-in-one custom indicator built on Pine Script v5 specifically for TradingView. Unlike traditional lagging indicators that rely on past moving averages, this tool reads the raw footprint of the market. It is engineered to automatically map out institutional price action, dynamic support and resistance, exact trendlines, and high-probability entry zones in real-time.
Whether you are a scalper, day trader, or swing trader, Gold Priceaction V2.00 gives you an objective, crystal-clear view of market direction—removing emotion and guesswork from your trading routine.
2. Why it Works Exceptionally Well for Gold (XAUUSD)
The Gold (XAUUSD) market is notoriously volatile and highly manipulated by large institutional players (banks and hedge funds). Gold charts frequently experience "liquidity grabs"—sudden spikes that hunt retail traders' stop losses before reversing into the true trend direction.
Gold Priceaction V2.00 is tailored exactly for this environment. Instead of blindly following a breakout, this indicator mathematically calculates true swing points to identify areas where the market is most likely to reverse (Support/Resistance) or continue (Target Breakouts). By highlighting premium and discount zones alongside equal highs/lows (liquidity pools), it allows you to trade with the "Smart Money" rather than becoming their exit liquidity.
3. Core Features & Functions (What’s Inside & How It Works)
📈 Dynamic Trendlines: Forget drawing subjective lines manually. The indicator uses a complex algorithmic loop to find the sharpest, most accurate Ascending (Bullish) and Descending (Bearish) trendlines in real-time. It projects these lines forward, giving you dynamic, diagonal support and resistance levels.
🛑 Real-Time Support & Resistance: The script constantly analyzes market data to find minor and major pivot points.
• Strong Highs/Lows: Act as massive, rigid Support and Resistance boundaries.
• Weak Highs/Lows: Act as magnets. The indicator anticipates that these weak points will be broken, turning them into your primary Take Profit (Target) levels.
🎯 Clean Future Target Projection: Most indicators clutter your screen with dozens of old, useless lines. Gold Priceaction V2.00 features an advanced auto-cleanup system. It automatically deletes past targets that have already been hit and only projects a single, bold horizontal line deep into the future. This shows you exactly where the price is magnetically drawn to next.
📦 Institutional Zones (Order Blocks & FVGs): The indicator automatically highlights the hidden footprint of big banks:
• Order Blocks (Supply/Demand Zones): Identifies the last bearish candle before a strong bullish move (and vice versa). These colored boxes act as high-probability entry zones for reversals or continuations.
• Fair Value Gaps (FVG): Spots sudden imbalances in price where the market moved too fast, leaving a "gap." Price almost always returns to rebalance these zones.
🕰️ Multi-Timeframe Context (PDH/PDL): Context is everything. You can enable higher timeframe levels directly on your lower timeframe chart (e.g., 5-minute chart).
• PDH / PDL: Previous Daily High and Low.
• PWH / PWL: Previous Weekly High and Low.
• PMH / PML: Previous Monthly High and Low.
These act as massive macro support/resistance areas where major reversals frequently happen.
4. How to Use It in Live Trading (The 4-Step Playbook)
Step 1: Determine the Trend
Look at the real-time Dashboard on your screen. If the "Market Trend" says BULLISH, you only look for BUY setups. If it says BEARISH, you only look for SELL setups.
Step 2: Wait for Price to Reach an Entry Zone
Do not buy at the top! Let the price retrace (pullback) down into a Discount Zone, a Bullish Order Block, or touch the Ascending Trendline.
Step 3: Look for Confirmation
Wait for a minor trend shift on a lower timeframe. If you are in a Bullish zone, wait for the indicator to print a "Support Hold" or a lower-timeframe "Resistance Break" to prove buyers are stepping in.
Step 4: Execute & Manage Risk
• Entry: Enter the market when the setup is confirmed.
• Stop Loss (SL): Look at the Dashboard. It dynamically calculates the safest, tightest Stop Loss based on the "Immediate Swing Level" to minimize your risk.
• Take Profit (TP): Ride the trade directly to the "🎯 Future Target" line projected on your chart.
5. Recommended Timeframes
• Scalping (Quick Trades): 1-Minute (1m) or 3-Minute (3m) charts.
• Intraday (Day Trading): 5-Minute (5m) and 15-Minute (15m) charts. (Highly Recommended for Gold).
• Swing Trading (Holding for days): 1-Hour (1H) or 4-Hour (4H) charts.
6. The Interactive Dashboard & Customization
The indicator includes a completely clean, user-friendly settings menu. We have hidden all the messy background code values so your chart title remains pristine.
Dashboard Customization:
• Positioning: Using the settings menu (gear icon), you can move the dashboard anywhere on your screen (Top Right, Bottom Center, Right Center, Left Center, etc.) so it never blocks your price action.
• Target Probability Score: A built-in logic metric reading from 0% to 100%. It calculates the trend bias, verifies if the price is safely holding above support, and checks RSI confluence (Overbought/Oversold levels) to give you a live win-rate probability color-coded in Red, Yellow, or Green.
• Styling: You can fully customize the colors of your candles, Order Blocks, and zones to perfectly match TradingView's Light or Dark modes.
❓ Frequently Asked Questions (FAQ)
Q1: Does this indicator repaint?
A: No. The historical Support/Resistance lines and Order Blocks are drawn based on confirmed closed candles. Once a swing point is confirmed mathematically, it does not repaint or shift backward.
Q2: Is this only for Gold?
A: While it is highly optimized for the volatility and structure of XAUUSD, the pure price action mathematics behind it work excellently on Forex pairs (EURUSD, GBPUSD), Crypto (BTC, ETH), and Indices (US30, NAS100).
Q3: Why are my old Target lines disappearing?
A: That is by design! To keep your chart clean and easy to read, the indicator deletes old, irrelevant "past" targets and only shows you the "Future Target" that matters right now.
Q4: How do I get rid of all the text on my indicator title bar?
A: You don't have to! In Gold Priceaction V2.00, all input variables have been explicitly hidden (display.none). The indicator name on your chart will stay clean and professional without long strings of text.
Q5: What does "Premium" and "Discount" mean?
A: Think of it like shopping. The indicator draws a grid between the highest and lowest points of the current trend.
• Premium Level (Red): The price is too high/expensive. (Best place to SELL).
• Discount Level (Green): The price is cheap/on sale. (Best place to BUY).
Indicateur

Esco Theory v4Esco Theory maps the hidden geometry of price action. It identifies swing structure, plots geometric rails between pivots, detects supply and demand zones, fair value gaps, liquidity pools, compression patterns, and confluence clusters.
All signals are synthesized into a real-time dashboard so traders can read market structure and volatility conditions at a glance.
Built for traders who study displacement, structure shifts, and the expansion–compression cycles that drive price.
Features
Market Structure (BOS / MSS)
Automatically detects Break of Structure (BOS) and Market Structure Shifts (MSS) using configurable swing lookback. Bullish and bearish shifts are labeled directly on the chart with color-coded markers.
Displacement candles (body greater than 1.5× ATR) are highlighted to confirm impulsive moves.
Geometric Rails
Trendlines (“rails”) are drawn between consecutive swing highs and swing lows and extended forward.
Two tiers are available:
Minor Rails
Short-term pivots for intraday and swing geometry.
Major Cycle Rails
Higher-timeframe pivots that reveal broader structural channels.
Cross-rails connect swing highs to swing lows using dotted diagonals, revealing convergence and divergence patterns.
Cycle Fan
A fan of rays projects from the deepest major swing low through each major swing high (and vice versa), mapping the angular geometry of the current market cycle.
These angles often highlight reaction zones where time and price intersect.
Supply & Demand Zones
Zones are created at pivot candles confirmed by displacement on the following bar.
Each zone tracks retests and gradually fades in transparency as it is touched.
Mitigated zones are automatically removed to keep charts clean.
Fair Value Gaps (FVG) & Inverted FVGs
Three-candle imbalance gaps are detected and drawn as shaded boxes.
When a gap fills to its midpoint it converts into an inverted FVG, which can act as a continuation or re-entry zone.
Both gap types have independent color settings and optional auto-expiration.
Premium / Discount Zones
Using the most recent major swing high and low, price is divided into:
Premium (upper 25%)
Discount (lower 25%)
Equilibrium (midpoint)
A dotted equilibrium line marks fair value and helps filter entries.
Support & Resistance Clustering
All pivot prices are grouped by proximity.
Levels with multiple touches are drawn as dashed horizontal lines labeled with touch count:
S (3)
R (4)
Stronger clusters appear as thicker lines.
Confluence Zones
When three or more levels from different sources cluster together (pivots, S/R levels, supply and demand), a shaded confluence zone is drawn.
These areas often produce the strongest market reactions.
Liquidity — Equal Highs / Equal Lows
Swing highs and lows within a defined tolerance are identified as EQH and EQL liquidity pools.
These levels extend forward and often attract price before reversals or breakouts.
Liquidity Sweeps
When price wicks through an equal high or low and closes back inside the level, a sweep marker (✕) appears.
Sweeps often signal liquidity grabs before reversals.
Compression & Squeeze Detection
Two compression signals identify volatility contraction.
ATR Compression
Occurs when fast ATR drops below 60% of slow ATR.
Bollinger / Keltner Squeeze
When Bollinger Bands contract inside Keltner Channels.
When the squeeze releases, a triangle marker signals expansion.
A wedge overlay connects compression pivots to visualize tightening ranges.
Real-Time Dashboard
A compact panel displays current market conditions.
Bias
Current structure trend (Bullish / Bearish / Neutral)
Zone
Premium, Discount, or Equilibrium
Volatility
Squeeze, Compression, or Expansion
ATR Ratio
Fast ATR vs Slow ATR
BBW
Bollinger Band Width percentage
Wedge
Active compression wedge detection
FVG
Active gap count
Sweeps
Recent liquidity sweep count
Inputs & Customization
Every module can be toggled independently.
Key settings include:
Swing Lookback (minor and major)
Rail Extension length
Max Cross-Rails
Supply / Demand Pivot Length
FVG Minimum Size and Max Age
Support / Resistance Tolerance and Minimum Touches
Confluence Width and Minimum Levels
Equal High / Low Tolerance
All colors are fully customizable.
How to Use
Identify bias
Check the dashboard for current structure direction and premium/discount location.
Find confluence
Look for areas where rails, zones, gaps, and support/resistance overlap.
Watch compression
Squeeze diamonds and wedges signal volatility building.
Trade displacement
Highlighted candles confirm impulsive moves through key levels.
Monitor liquidity sweeps
EQH/EQL sweeps often precede reversals or expansions.
Notes
Overlay indicator designed for use directly on price charts.
Compatible with all markets and timeframes.
Lower timeframes with large bar counts may increase drawing load. Adjust lookback settings if needed.
Best used alongside discretionary price action and market context. Indicateur

Breakout Trend Bar AlertsEvery trend has a starting point. It's rarely a gradual drift — it's one massive, decisive candle that breaks the market out of consolidation and kicks off a sustained move. Breakout Bar Alerts is built to catch that exact moment.
The indicator monitors price action in real time and identifies when a bar forms that dwarfs everything around it — the largest high-to-low range of any candle in the last 250 bars. These are the bars where conviction enters the market, weak hands get flushed, and a new trend begins. When one appears, you get an instant alert so you're never late to the move.
Why these bars matter:
Big range bars represent a sudden surge of momentum and volume-backed commitment from one side of the market. Bulls or bears have taken control decisively. What follows is often the beginning of a trend leg — not a random spike.
Built to filter out the noise:
The opening bar of every session is excluded entirely. That first chaotic candle never skews your data or triggers a false signal.
Only bars within your active session window are counted. Off-hours price action is completely ignored, so your benchmark is always built from real, tradeable market conditions.
Three alert conditions — Bull Breakout Bar, Bear Breakout Bar, or Both — so you only get notified for the setups you actually trade.
Inputs:
Lookback Period — how many bars back to measure the largest range (default: 250)
Enable Time Filter — restricts detection and calculations to your active trading session
Active Session — define your session window in exchange time
Bull / Bear colors — fully customizable
Best used on intraday timeframes (1m – 15m) on futures, forex, or high-volume equities. When this fires, pay attention — the trend may already be starting. Indicateur

Dynamic Trendlines & Breakouts [identityKa]Overview
The Dynamic Trendlines & Breakouts is an automated structural analysis tool designed to remove human subjectivity from drawing trendlines. By utilizing mathematical pivot extremes, the script identifies the dominant market geometry in real-time. More importantly, it incorporates a Smart Volume Filter to distinguish between genuine structural breakouts and low-volume retail traps (fakeouts).
Core Engine Mechanics
The indicator operates on two primary algorithmic pillars:
Dynamic Coordinate Mapping: The script calculates the most recent pivot highs and pivot lows based on a user-defined lookback sensitivity. It then draws precision-extended dashed lines connecting these coordinates, forming dynamic Resistance (Upper Line) and Support (Lower Line) boundaries.
Volume-Confirmed Breakouts: The script continuously monitors the closing price relative to these extended lines. However, a crossover is not enough. If the "Volume Confirmation" feature is active, the engine checks a 20-period Simple Moving Average of the volume. A Bullish "B" (Buy) or Bearish "S" (Sell) label is only printed if the breakout candle is accompanied by above-average institutional volume, significantly increasing the probability of trend continuation.
HUD Dashboard & AI Proximity Logic
The integrated on-chart panel tracks the last confirmed breakout state and utilizes an ATR-based proximity sensor to generate the AI Suggestion:
Dangerous: Displayed actively whenever the current price is within a 0.5 Average True Range (ATR) distance of either the upper or lower trendline. This alerts the trader that the price is actively testing a major structural boundary, making new entries highly risky until a clear bounce or volume-confirmed breakout occurs.
LONG / SHORT: Triggered when the last structural breakout was Bullish (LONG) or Bearish (SHORT), provided the price is safely trending away from the immediate resistance/support lines.
How to Use It
This tool is ideal for momentum and breakout traders. When the price approaches a trendline (AI Suggestion reads "Dangerous"), prepare for a setup. Do not front-run the breakout. Wait for the engine to print the "B" or "S" label, confirming that both the structural level has been breached and the volume supports the move. Once confirmed, trade in the direction of the new momentum. Indicateur

Trendline Breakout with Volume Confirmation [Dots3Red]Financial markets generally move in trends or sideways ranges.
The core idea of this indicator is to detect bearish trendline channels and highlight potential breakout events.
How it Works
This indicator automatically detects descending trendline channels by dynamically analyzing pivot highs. Consecutive descending pivots are used to form bearish trendlines, which are then extended forward as the market evolves.
Once a valid trendline or channel is detected, the script continuously monitors its status. When price breaks above the upper boundary of the descending trendline/channel, the breakout is detected and the completed structure is drawn on the chart together with a visual breakout label.
A breakout is considered valid when the closing price exceeds the upper boundary of the trendline by a configurable percentage ( Breakout %) .
When a valid trendline is detected on real-time bars but has not yet been broken, the indicator will project the channel forward into the future to help visualize potential breakout zones.
Visual Styles
The indicator provides two visualization modes:
Channel (default) – Displays the full channel area between the trendline and its lower boundary.
Polygon – Displays the detected structure as a polygon, which can make overlapping structures easier to distinguish.
Volume Confirmation
The indicator can optionally display volume confirmation during breakout events.
When enabled, a normalized volume bar is drawn near the breakout location to indicate the relative strength of the breakout based on volume activity.
Settings
Boolean Options
Channel / Polygon Display – Choose how the detected structure is visualized.
Show Volume Breakout Bar – Enables or disables volume confirmation visualization.
Numerical Parameters
Breakout % – Minimum percentage the closing price must exceed the trendline to confirm a breakout.
Slope Factor – Controls how steep the detected trendline must be.
Pivot Length – Number of bars to the left and right used to determine pivot points.
Volume % Breakout – Minimum relative volume required to display a breakout volume bar.
Why Use Polygon Mode?
When multiple channels appear close to each other, the chart may become visually crowded. In such situations, the polygon mode can provide a clearer representation of overlapping structures.
For example, in the chart above for Palantir Technologies during the summer of 2023, two separate trendlines were detected in June and August. Their baselines were very similar, which resulted in channels having almost identical lows. Switching to polygon mode makes the structure easier to interpret.
Example:
Indicateur

Elite Session Volume Distribution Engine [JOAT]Elite Session Volume Distribution Engine
Introduction
The Elite Session Volume Distribution Engine is an open-source indicator that combines session-based analysis (London, New York, Asian sessions) with volume distribution profiling, VWAP analysis, volume-weighted momentum indicators, and session high/low tracking. This mashup creates a comprehensive session and volume analysis system designed to identify when institutional volume enters the market during specific trading sessions and how that volume is distributed across price levels.
The indicator addresses a critical market reality: different trading sessions have distinct volume characteristics and institutional participation levels. London and New York sessions typically have highest volume and volatility, while Asian session is quieter. By tracking volume distribution, momentum, and key levels within each session, this tool helps traders identify optimal trading windows and understand how institutional volume shapes price action during different global market hours.
Chart showing session boxes, volume distribution, and VWAP on 45M timeframe
Why This Mashup Exists
This indicator combines five analytical frameworks that address different aspects of session-based trading:
Session Identification: Tracks London, New York, and Asian trading sessions
Volume Distribution: Analyzes how volume is distributed across price levels within sessions
VWAP Analysis: Calculates session-specific Volume Weighted Average Price
Volume Momentum: Tracks volume trends and climax conditions
Session High/Low: Identifies key levels established during each session
Each component serves a specific purpose: Session identification shows when institutional traders are active, Volume Distribution reveals where volume concentrates (value areas), VWAP shows institutional average price, Volume Momentum identifies accumulation/distribution phases, and Session High/Low marks key reference levels. Together, they create a complete picture of how institutional volume flows through different trading sessions.
The mashup is justified because these components work together in session-based trading: institutions enter during specific sessions (London/NY), create volume distribution patterns at key levels, establish VWAP as benchmark, show momentum through volume trends, and set session highs/lows that become support/resistance. Tracking all simultaneously reveals the complete session-based institutional flow.
Core Components Explained
1. Session Identification System
The indicator identifies three major trading sessions:
// London Session (03:00-12:00 GMT)
londonSession = input.session("0300-1200", "London Session")
inLondonSession = not na(time(timeframe.period, londonSession))
// New York Session (08:30-17:00 EST)
nySession = input.session("0830-1700", "NY Session")
inNYSession = not na(time(timeframe.period, nySession))
// Asian Session (00:00-09:00 GMT)
asianSession = input.session("0000-0900", "Asian Session")
inAsianSession = not na(time(timeframe.period, asianSession))
// Session overlap (London + NY)
sessionOverlap = inLondonSession and inNYSession
Session characteristics:
London Session: High volume, major currency pairs active, trend establishment
NY Session: Highest volume, US markets active, major moves occur
Asian Session: Lower volume, range-bound often, JPY pairs active
London/NY Overlap: Highest volume period, most volatile, best liquidity
The indicator can optionally display session boxes as background colors (disabled by default to reduce clutter).
2. Volume Distribution Analysis
Volume distribution shows where volume concentrates within price ranges:
// Calculate volume at different price levels
volumeAtPrice = array.new_float()
// For each price level in session range
for i = sessionLow to sessionHigh by tickSize
volumeAtLevel = sum of volume where price traded at level i
array.push(volumeAtPrice, volumeAtLevel)
// Identify Point of Control (POC) - price level with most volume
poc = price level with maximum volume
// Identify Value Area (VA) - price range containing 70% of volume
valueAreaHigh = upper bound of 70% volume
valueAreaLow = lower bound of 70% volume
Volume Distribution concepts:
Point of Control (POC): Price level with highest volume - strong support/resistance
Value Area High (VAH): Upper bound of 70% volume distribution
Value Area Low (VAL): Lower bound of 70% volume distribution
High Volume Nodes: Price levels with significant volume - support/resistance zones
Low Volume Nodes: Price levels with little volume - price moves through quickly
The indicator plots volume distribution as a histogram or profile showing where institutional volume concentrated during the session.
3. Session-Specific VWAP
VWAP resets at the start of each session:
// Session VWAP calculation
var float sessionVWAP = na
var float cumulativeTPV = 0.0 // Typical Price * Volume
var float cumulativeVol = 0.0
if session_start
cumulativeTPV := 0.0
cumulativeVol := 0.0
typicalPrice = (high + low + close) / 3
cumulativeTPV := cumulativeTPV + (typicalPrice * volume)
cumulativeVol := cumulativeVol + volume
sessionVWAP = cumulativeTPV / cumulativeVol
Session VWAP significance:
Institutional traders use VWAP as execution benchmark
Price above session VWAP = buyers in control during session
Price below session VWAP = sellers in control during session
VWAP acts as dynamic support/resistance within session
Distance from VWAP indicates overextension
The indicator plots session VWAP with dynamic coloring based on price position.
4. Volume Momentum Analysis
Volume momentum tracks institutional accumulation/distribution:
// Volume moving average
volumeMA = ta.sma(volume, 20)
// Volume classification
highVolume = volume > volumeMA * 1.5
veryHighVolume = volume > volumeMA * 2.0
climaxVolume = volume > volumeMA * 3.0
// Volume trend
volumeRising = volume > volume and volume > volume
volumeFalling = volume < volume and volume < volume
// Accumulation/Distribution
accumulation = close > open and highVolume and volumeRising
distribution = close < open and highVolume and volumeRising
// Volume momentum indicator
volumeMomentum = (volume - volumeMA) / volumeMA * 100
Volume Momentum signals:
Rising Volume + Up Close: Accumulation - bullish
Rising Volume + Down Close: Distribution - bearish
Climax Volume: Potential exhaustion or strong institutional move
Declining Volume: Lack of institutional interest
Volume Momentum > 50%: Very strong institutional participation
The indicator plots volume bars with color coding based on momentum and direction.
5. Session High/Low Tracking
Session highs and lows become important reference levels:
// Track current session high/low
var float currentSessionHigh = na
var float currentSessionLow = na
if session_start
currentSessionHigh := high
currentSessionLow := low
else
currentSessionHigh := math.max(currentSessionHigh, high)
currentSessionLow := math.min(currentSessionLow, low)
// Previous session levels
prevSessionHigh = currentSessionHigh
prevSessionLow = currentSessionLow
Session High/Low significance:
Current session high/low show intraday range
Previous session levels act as support/resistance
Breaks above previous session high = bullish continuation
Breaks below previous session low = bearish continuation
Session range size indicates volatility and institutional activity
The indicator plots only CURRENT session high/low (2 lines instead of 6) to keep chart clean. Previous session levels can be toggled on if needed.
Example showing session VWAP, volume distribution, and session high/low levels
Volume Distribution Dashboard
The dashboard (bottom-right position) displays:
Current Session: London/NY/Asian/Overlap
Session VWAP: Current VWAP value
Price vs VWAP: Distance from VWAP in %
POC: Point of Control price level
Value Area: VAH and VAL levels
Volume Status: High/Normal/Low relative to average
Volume Momentum: Rising/Falling/Climax
Session Range: High - Low distance
Accumulation/Distribution: Current phase
Visual Elements
Session Boxes: Optional background colors for each session (default: OFF)
Session VWAP: Dynamic line with color based on price position
Session High/Low: Horizontal lines for current session (2 lines only)
Volume Bars: Color-coded based on momentum and direction
Volume Distribution Profile: Histogram showing volume at price levels
POC Line: Horizontal line at Point of Control
Value Area: Shaded zone between VAH and VAL
Accumulation/Distribution Markers: Labels for strong volume phases
Dashboard: Bottom-right table with session and volume metrics
Chart demonstrating session VWAP, volume bars, and dashboard
How Components Work Together
The mashup reveals session-based institutional flow:
Session Trading Sequence:
1. Session Opens: New session begins (London/NY/Asian)
2. VWAP Establishes: Session VWAP forms as volume enters
3. Volume Distribution: Institutions create volume at key levels (POC, Value Area)
4. Session Range: High and low established through institutional activity
5. Volume Momentum: Accumulation or distribution phase identified
6. Session Close: Levels become reference for next session
Example: London session opens, price trades above session VWAP with rising volume (accumulation). Volume distribution shows POC forming at 1.2500 level. Session high reaches 1.2550. NY session opens, price respects London session high and VWAP, continues higher with climax volume. Dashboard shows strong accumulation with volume momentum +75%.
Input Parameters
Session Settings:
London Session: Time range (default: 0300-1200)
NY Session: Time range (default: 0830-1700)
Asian Session: Time range (default: 0000-0900)
Show Session Boxes: Toggle background colors (default: OFF)
Highlight Overlap: Emphasize London/NY overlap (default: enabled)
VWAP Settings:
Show Session VWAP: Toggle VWAP line (default: enabled)
VWAP Reset: Session, Daily, Weekly (default: Session)
VWAP Bands: Optional standard deviation bands (default: disabled)
Distance Alert: Alert when price moves X% from VWAP (default: 2%)
Volume Settings:
Volume MA Length: Period for volume average (default: 20)
High Volume Threshold: Multiplier for high volume (default: 1.5x)
Climax Volume Threshold: Multiplier for climax (default: 3.0x)
Show Volume Bars: Color-coded volume bars (default: enabled)
Show Distribution Profile: Volume at price histogram (default: enabled)
Session Levels:
Show Current Session H/L: Toggle current session levels (default: enabled)
Show Previous Session H/L: Toggle previous session levels (default: disabled)
Show POC: Toggle Point of Control line (default: enabled)
Show Value Area: Toggle VAH/VAL zone (default: enabled)
Display Options:
Show Dashboard: Toggle metrics table (default: enabled)
Dashboard Position: Bottom-right, top-right, etc. (default: bottom-right)
Color Theme: Choose color scheme
Transparency: Adjust visual element transparency
How to Use This Indicator
Step 1: Identify Active Session
Check dashboard to see which session is active. Focus trading during London and NY sessions for highest volume and best opportunities.
Step 2: Monitor Session VWAP
Use session VWAP as directional bias. Price above VWAP = bullish bias, below = bearish bias. VWAP often acts as support/resistance.
Step 3: Check Volume Distribution
Identify POC and Value Area. These levels often provide strong support/resistance. Price tends to return to POC (fair value).
Step 4: Assess Volume Momentum
Check if volume is rising (accumulation/distribution) or falling (lack of interest). Climax volume often marks important turning points.
Step 5: Use Session High/Low
Current session high/low define intraday range. Breaks above/below these levels signal potential breakout moves.
Step 6: Watch for Session Transitions
Session opens and closes often bring volatility. London open and NY open are particularly important for major moves.
Best Practices
Use on 5-minute to 1-hour timeframes for optimal session analysis
London/NY overlap (08:30-12:00 EST) offers highest volume and best opportunities
Session VWAP acts as magnet - price often returns to it
POC from previous session often becomes support/resistance in current session
Climax volume at session high/low often marks reversal points
Accumulation during Asian session often leads to breakout during London open
Value Area breaks signal strong directional moves
Previous session high/low become key levels for current session
Combine session analysis with other technical tools for best results
Indicator Limitations
Session times are fixed and may not account for daylight saving time changes
Volume distribution requires sufficient data within session to be meaningful
VWAP can be less relevant in very volatile or trending markets
Session high/low can be broken multiple times in volatile conditions
Lower timeframes may show choppy session transitions
Volume data quality varies across different markets and brokers
Asian session analysis less reliable due to lower volume
Requires understanding of session-based trading concepts
Visual elements can clutter chart if all options enabled
Technical Implementation
Built with Pine Script v6 using:
Session detection using time() function with session strings
Session-specific VWAP calculation with reset logic
Volume distribution profiling with POC and Value Area calculation
Volume momentum tracking with MA comparison
Session high/low tracking with persistent variables
Accumulation/distribution detection using volume and price
Dynamic dashboard with real-time session metrics
Optional session boxes with transparency control
Color-coded volume bars based on momentum
The code is fully open-source and can be modified to adjust session times, volume thresholds, and visual preferences.
Originality Statement
This indicator is original in its comprehensive session and volume integration approach. While individual components (session identification, VWAP, volume distribution, volume momentum, session high/low) are established concepts, this mashup is justified because:
It combines session-based analysis with volume distribution profiling
Session-specific VWAP provides more relevant institutional benchmark than daily VWAP
Integration of volume momentum with session context reveals accumulation/distribution phases
Simplified visual presentation (current session H/L only) reduces clutter
Dashboard presents complex session and volume data clearly
Focus on institutional trading sessions (London/NY) aligns with volume reality
Each component contributes unique information: Session identification shows when institutions are active, Volume Distribution reveals where they're trading, VWAP shows their average price, Volume Momentum shows their intent, and Session High/Low marks their range. The mashup's value lies in presenting these complementary session-based perspectives simultaneously, allowing traders to understand how institutional volume flows through different global trading sessions.
Disclaimer
This indicator is provided for educational and informational purposes only. It is not financial advice or a recommendation to buy or sell any financial instrument. Trading involves substantial risk of loss and is not suitable for all investors.
Session-based analysis and volume distribution are analytical tools that analyze past data. They do not predict future price movement or guarantee that institutional traders are active at identified levels. Market conditions change, and session patterns that worked historically may not work in the future.
VWAP and volume distribution levels can fail to provide support/resistance. Session highs and lows can be broken without leading to sustained moves. Volume momentum can change rapidly. Past session behavior does not guarantee future session behavior.
Always use proper risk management, including stop losses and position sizing appropriate for your account size and risk tolerance. Never risk more than you can afford to lose. Consider consulting with a qualified financial advisor before making investment decisions.
The author is not responsible for any losses incurred from using this indicator. Users assume full responsibility for all trading decisions made using this tool.
-Made with passion by officialjackofalltrades Indicateur

Rolling Trendline [LuxAlgo]The Rolling Trendline indicator provides a dynamic, self-adjusting trendline that tracks price action using linear regression slope projections and automatically resets when price deviates beyond a specific threshold.
🔶 USAGE
The indicator is designed to provide a continuous trend bias without the "lag" often associated with static linear regression lines. It projects a line forward based on a calculated slope and only shifts its trajectory when the market demonstrates a significant change in momentum.
The addition of ATR-based volatility zones allows traders to visualize a range of expected price action around the projected trend, providing a buffer that accounts for market volatility at the time of each trend reset.
🔹 Interpreting the Line and Zones
Bullish Phase (Green): Indicates an upward-sloping trajectory. The trendline and its surrounding ATR zones will be colored green, suggesting a bullish bias.
Bearish Phase (Red): Indicates a downward-sloping trajectory. The trendline and its surrounding ATR zones will be colored red, suggesting a bearish bias.
ATR Zones: These shaded areas represent a volatility-adjusted range. As long as price remains within the deviation threshold, the zones follow the trendline's trajectory.
Reset Points: Visualized by a small circle and a break in the line, these occur when price moves too far from the projection. At this moment, the indicator re-anchors to the current price and recalculates both the slope and the ATR zone width.
🔶 DETAILS
The indicator follows a specific logic flow to maintain its "Rolling" characteristic:
1. Slope Calculation: It calculates the Linear Regression slope over a user-defined lookback period. This slope represents the average rate of change in price.
2. Projection: On every new bar, the indicator projects the next value of the trendline by adding the active slope to the previous trendline value.
3. Deviation Check: The indicator calculates a Standard Deviation threshold. If the distance between the current price and the projected trendline value exceeds this threshold, a reset is triggered.
4. Re-Anchoring: Upon a reset, the trendline "rolls" to the current price and adopts the most recent linear regression slope. Simultaneously, it captures the current ATR to set the width of the new trend zones.
🔶 SETTINGS
🔹 Trend Settings
Slope Lookback: The period used to calculate the linear regression slope. Higher values result in a slope that considers more historical data.
Deviation Multiplier: Determines how far price can deviate from the trendline before a reset occurs.
Slope Divisor: This setting allows you to tame the trajectory of the line. Higher values divide the captured slope, resulting in flatter trendlines.
Source: The price data used for all calculations (default is Close).
🔹 ATR Zones
ATR Length: The lookback period used for the Average True Range calculation, which determines the width of the volatility bands.
ATR Multiplier: Controls the width of the shaded zones around the trendline.
🔹 Visuals
Bullish/Bearish Trend Colors: Customizes the colors for the trendline and zones based on the slope direction.
Zone Color: Sets the base color for the ATR area fills.
Line Width: Adjusts the thickness of the primary rolling trendline.
Indicateur

Indicateur

Automatic Trendline [Metrify]Metrify Automatic Trendlines is an auto-drawing support/resistance channel built around pivot clustering + scoring, not “connect two perfect points”. The script continuously collects swing pivots (high/low) over a configurable lookback window, then searches for the best single support line and the best single resistance line that behave like a human-drawn trendline: multiple interactions, controlled slope, limited break-throughs, and (most importantly) still relevant to the current price. (configurable in "Max Relevance Distance" input)
The fundamental problem with algorithmic trendlines is subjectivity. To solve this mathematically, we treat trendlines as a statistical regression problem with specific constraints. We do not use linear regression on all candles, instead, we use a brute-force iterative approach on specific "Pivot Points."
The logic operates on a simple premise: Generate every possible line between past swing points, validate them against price history, score them based on fit, and render only the winner.
The Calculation Engine (f_find_best_line)
This function contains the primary computational load. It performs a nested loop operation:
Outer Loop (newer): Iterates through recent pivots.
Inner Loop (older): Iterates through older pivots to form a candidate line segment.
For every pair of pivots (P1,P2), we calculate the slope (m) and the y-intercept concept. This gives us a tentative trendline equation:
y=mx+c
The Scoring Matrix
We assign a score to each candidate line based on weighted heuristics:
Touch Count (touches * 2.8): The primary driver. More touches = higher statistical significance.
Recency (recency * 1.2): Lines originating closer to the current price action are weighted higher.
Tightness (avgErr): We calculate the average distance of all touches from the line. A "tighter" fit (lower error) increases the score.
Penalties:
violations * 2.2: False breaks heavily penalize the score.
barBreakRatio * 2.0: If the line cuts through candle bodies (even if pivots are fine).
The line with the highest localBest score is returned as the dominant trendline.
What you can use it for?
This is a structure visualizer that tries to keep a clean, current S/R channel on screen with volatility-aware rules. It’s not a signal generator, it doesn’t predict breakouts, and it won’t always draw something, if the market is messy and no line survives the filters, it will show none instead of hallucinating geometry. If you need more lines (multiple concurrent channels), that’s a different design tradeoff (and usually becomes clutter + false confidence fast). Indicateur