Indicateur

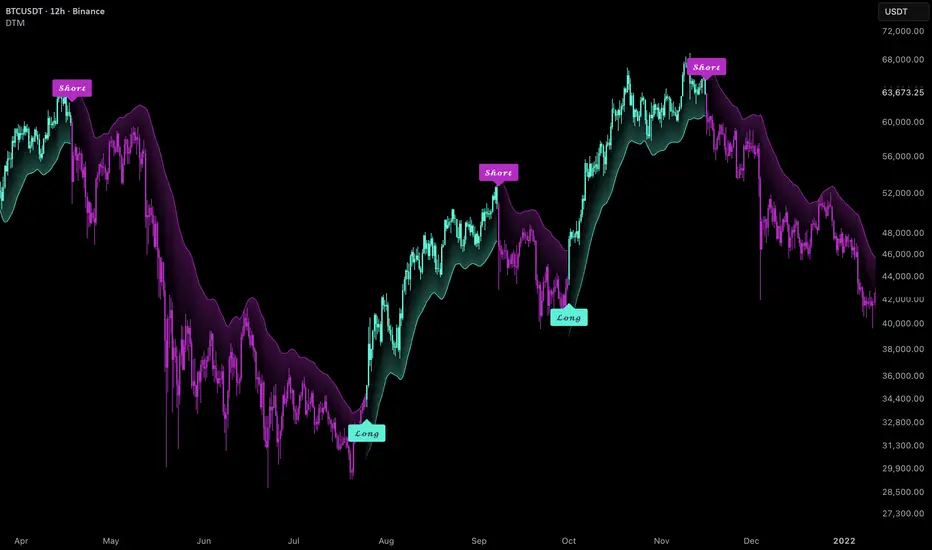
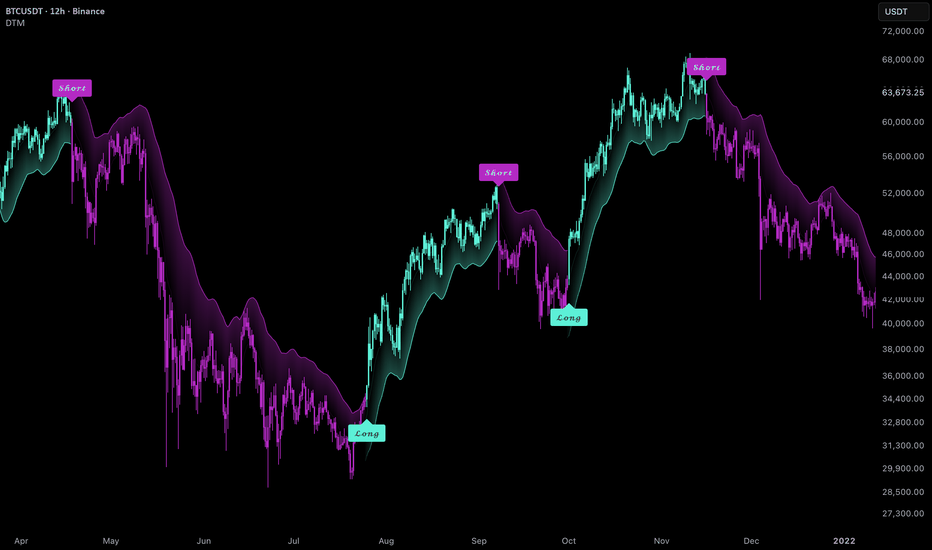
Uptrick: Dynamic Trend MatrixOverview
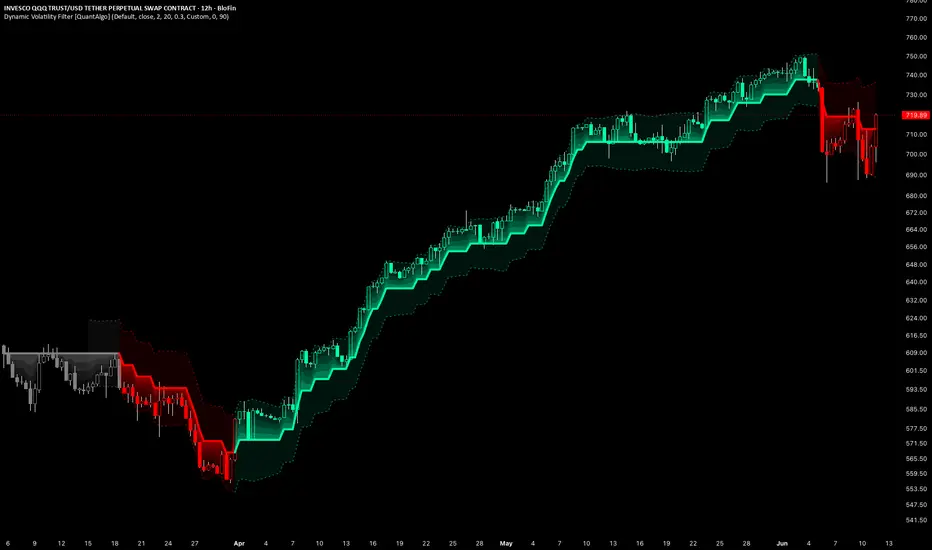
Dynamic Trend Matrix is an open-source trend-following overlay designed to help traders read market direction, trend strength, pullback areas, and optional take-profit progress from one chart-based tool. It is built to provide a structured view of trend conditions without relying on a single crossover or one isolated signal.
Introduction
The script combines EMA-based trend structure, ATR-based volatility bands, a dynamic trailing engine, candle coloring, signal labels, X-marker re-entry logic, take-profit markers, alerts, and a compact dashboard. Its goal is to make trend conditions easier to interpret by separating the main trend state, pressure confirmation, pullback behavior, and target tracking into clear visual components.
Originality & Uniqueness
Dynamic Trend Matrix uses a custom trend state model that blends moving-average alignment, smoothed slope pressure, ATR volatility boundaries, adaptive trailing logic, visual strength coloring, and staged take-profit tracking.
Instead of only showing a basic moving average crossover or a simple band break, the script organizes trend information into multiple layers. The trend flip logic identifies directional changes, the pressure filter evaluates whether EMA structure supports the active side, the trail helps show the active trend boundary, and the X markers highlight pullback interactions near the trend trail.
This layered design allows users to view both trend direction and trend quality, while keeping the chart visually organized.
How It Works
The script calculates fast, base, and slow EMA trend components from the selected source. These moving averages are used to measure directional structure and help determine whether the market is showing bullish, bearish, or mixed pressure.
ATR-based bands are then built around the base trend. A long trend state is triggered when price breaks above the upper ATR band, while a short trend state is triggered when price breaks below the lower ATR band. Once a trend state is active, the script maintains a dynamic trailing level that adjusts with volatility and trend direction.
Trend pressure is confirmed when the EMA structure and smoothed slope agree with the active trend. Trend strength is calculated by comparing the distance between the fast and slow trend components against ATR. This strength reading is used for dashboard values and optional candle coloring.
The take-profit system uses the active signal price and either risk from the trail or ATR from entry to create up to three visual target levels. These levels are for chart reference only and are not automated trade management.
Inputs
The main settings allow users to adjust the trend lengths, smoothing, ATR length, ATR multiplier, visual style, candle coloring method, signal confirmation, label appearance, X-marker behavior, take-profit calculation mode, dashboard position, and alert options.
The default settings are intended to provide a balanced trend-following view, but users should adjust them based on the market, timeframe, and volatility conditions they are studying.
Features
Dynamic trend flip detection using ATR-adjusted band breaks.
EMA-based trend structure using fast, base, and slow trend components.
Smoothed slope pressure filter to help distinguish stronger trend alignment from mixed conditions.
Adaptive trail that follows the active trend and adjusts with volatility.
Multiple visual modes, including bands, trend trail, and candles only.
Candle coloring based on either latest trend direction or trend strength.
Optional gradient visuals to make active trend zones easier to read.
Optional outer bands for additional volatility context.
Long and short signal labels with optional bar-close confirmation.
X-marker re-entry logic for pullback touches near the dynamic trail.
Configurable X-marker behavior, including first valid marker only or every valid marker.
Optional take-profit markers with one, two, or three target levels.
Take-profit calculations based on either risk from trail or ATR from entry.
Dashboard showing trend state, pressure, strength, trail value, visual mode, and TP state.
Alert conditions for long signals, short signals, X markers, and take-profit hits.
How To Use
Add the indicator to a standard candlestick chart and select the visual mode that best fits your workflow. The Bands mode provides a broader view of volatility zones around the trend basis. The Trend Trail mode focuses more directly on the active trailing level. Candles Only mode keeps the chart cleaner while still showing trend-based candle colors.
Long and short labels can be used as potential trend-change signals. The trail can be used as a visual reference for the active trend boundary. X markers are designed to show valid pullback interactions near the trail after a trend has already been established.
The dashboard provides a quick summary of current conditions, including trend state, pressure, strength, trail value, visual mode, and TP progress. Users who prefer confirmed signals can keep bar-close confirmation enabled. Users who want faster realtime feedback can disable confirmation, but signals may be less stable before the candle closes.
Limitations
This indicator is not a complete trading system and does not guarantee profitable results. It does not include position sizing, stop-loss execution, order management, commissions, slippage, or full strategy backtesting.
Signals may appear late during fast reversals because the model uses EMAs, smoothing, ATR bands, and trend confirmation. Sideways, choppy, or low-volatility markets may produce false flips, mixed pressure readings, or less useful pullback markers.
Take-profit markers are visual reference levels only. They do not guarantee that a trade should be entered, held, exited, or managed in a specific way. Users should test settings across different symbols, sessions, and timeframes before relying on the script for live decision-making.
The script does not use request.security(), lookahead, or negative plot offsets. With bar-close confirmation enabled, Long, Short, X-marker, and TP signals are confirmed after the candle closes. If confirmation is disabled, realtime signals may appear or change before the candle closes. The script should be used on standard chart types because non-standard charts can affect signal behavior.
Conclusion
Dynamic Trend Matrix is designed to provide a clean visual framework for reading trend direction, trend pressure, pullback context, and staged target progress. It can help organize trend-following analysis, but it should be used alongside market structure, risk management, and broader chart context.
Disclaimer
This script is for educational and informational purposes only. It does not provide financial advice, investment advice, trading advice, or guaranteed outcomes. Trading involves risk, and users are responsible for their own analysis, decisions, and risk management. Indicateur
Gap Detector [DYNA]Gap Detector finds the price gaps that form between trading sessions and tracks them visually on the chart from formation through fill. Every time a new session opens away from the previous session's close -- by more than a configurable fraction of the daily ATR -- the indicator drops a shaded rectangle covering the gap zone, color-coded green for an up-gap and red for a down-gap. The box stays on the chart, extending bar by bar, until price trades back through the prior close and fills it. When that happens, the box turns gray, a strikethrough line is drawn through the middle, and a fill alert fires.
The threshold is ATR-relative, not a fixed point amount, so the same default settings work across instruments with very different price scales. Stocks, indices, forex pairs, commodities, and crypto all use the same `0.5x daily ATR` filter -- the indicator scales itself. Up to N gaps (configurable) are kept on the chart at once, with optional fill-progress lines that show how close each open gap has come to filling.
Key Features
ATR-Relative Threshold -- Minimum gap size is expressed as a multiple of the 14-period daily ATR, so the same setting filters appropriately on a $50 stock and a $5,000 index.
Color-Coded Gap Boxes -- Green for gap-up, red for gap-down, gray for filled. The box always spans from the prior session close to the new session open.
Fill-Progress Tracking -- A dotted line inside each open gap marks the deepest price has penetrated so far. Lets you see at a glance how close a gap is to filling.
Strikethrough on Fill -- When price fully retraces back through the prior close, the box recolors and a horizontal line is drawn through it -- visual confirmation the gap is closed.
Configurable On-Chart History -- Cap the number of gap boxes shown so the chart stays clean. Optionally hide filled gaps entirely if you only want live structure.
Gap Size Labels -- Each gap shows its size in points and as a multiple of the daily ATR -- you can rank gaps by relative magnitude without doing the math.
No Repainting -- Gap detection runs only on confirmed bars. Once a box is drawn it never relocates; it only extends rightward and recolors when filled.
How It Works
At the open of each new session, the indicator compares the session's first-bar open to the previous session's last-bar close. If the absolute difference exceeds the configured `ATR multiplier x daily ATR` threshold, a new gap is registered. A shaded rectangle is drawn between the prior close and the new open -- green if the open is above (gap up), red if below (gap down). A small label on the box reports the gap's size in points and as a multiple of the daily ATR.
From the formation bar onward, every subsequent bar is checked against the prior close. For a gap up, the gap fills the moment any bar's low touches or crosses below the prior close. For a gap down, it fills when any bar's high touches or crosses above the prior close. While the gap remains open, a dotted "fill progress" line is updated to sit at the deepest penetration so far -- the closer that line is to the prior close, the closer the gap is to filling.
When a gap fills, the box's fill and border recolor to gray, a horizontal strikethrough line is drawn through the middle of the box, and a fill alert fires. If the "Keep Filled Gaps Visible" toggle is off, the gap is removed from the chart instead. Either way, the count of on-chart gaps respects the `Max Gaps to Show` cap -- the oldest gap (filled or not) is removed when the limit is reached, so the indicator never crowds the chart.
The daily ATR used for the threshold is fetched with non-lookahead higher-timeframe security calls, so the threshold at the open of session N is sized using only data available through session N-1. There is no peeking ahead.
Two open gaps and one filled gap on a daily chart. The green box marks an unfilled gap up, the red box an unfilled gap down (with the orange dotted line showing how far price has retraced into it), and the gray box with strikethrough marks a gap that has fully closed.
Settings
Min Gap Size (x Daily ATR) (default: 0.5) is the minimum gap size to qualify, expressed as a multiple of the 14-period daily ATR. Lower captures more, smaller gaps; higher filters down to large opening shocks. Set to 0 to flag every nonzero gap. Daily ATR Length (default: 14) is the lookback for the daily ATR -- 14 is the Wilder standard.
Max Gaps to Show (default: 5) caps the number of gap boxes (open and filled) kept on the chart at once. When the cap is hit, the oldest box is removed. Keep Filled Gaps Visible (default: on) controls whether filled gaps stay on the chart with a strikethrough or are removed the moment they fill.
Visual toggles independently control the fill-progress line, the gap-size label, and the colors used for gap-up, gap-down, and filled boxes. Box Transparency (default: 80) sets how see-through the box fills are; filled-gap boxes use a slightly higher transparency so they recede into the background. The two alert toggles enable or disable the new-gap and gap-filled alerts individually.
Alerts
New Gap Up -- Fires on the formation bar of a qualifying gap UP. "Gap Detector : A new bullish session gap UP has formed above the configured ATR threshold."
New Gap Down -- Fires on the formation bar of a qualifying gap DOWN. "Gap Detector : A new bearish session gap DOWN has formed above the configured ATR threshold."
Gap Up Filled -- Fires when an open gap UP fills. "Gap Detector : A bullish gap UP has been fully filled -- price traded back down to the prior session close."
Gap Down Filled -- Fires when an open gap DOWN fills. "Gap Detector : A bearish gap DOWN has been fully filled -- price traded back up to the prior session close."
To set up alerts: click TradingView's Alerts button, choose "Gap Detector " from the condition dropdown, pick the gap event you want, and select your notification channel.
Best Practices
Use the daily timeframe for the cleanest gap-by-gap reading. Drop to intraday timeframes (15m through 60m) when you want to watch a specific gap fill in real time during the session that's reacting to it.
Tune the ATR multiplier to your style: 0.2-0.3 for stocks with small absolute gaps, 0.5 for the default moderate filter, 0.8-1.0 for only large opening shocks.
The prior close (the far edge of the gap) is a natural reference level -- many traders watch it as a potential target when studying gap behavior. Use it as a level of interest if you're observing how a gap reacts.
The new session open (the near edge) often acts as the first support/resistance test. Use it as your structure for entries and stops.
If a gap doesn't fill for several sessions, you can study it as a structural reference -- a support/resistance level worth watching until price tests it again.
Reduce Max Gaps to Show to 3 on instruments that gap often (single-name stocks). Increase to 10-20 on instruments that gap rarely (FX majors).
Part of the DYNA Ecosystem
Gap Detector is a free indicator built with the same design standards as the DYNA premium suite. For complete trade management with automatic stop loss, break-even, trailing stops, and multi-target systems, explore the full DYNA indicator collection.
Disclaimer
This indicator is a technical analysis and educational tool only -- it is not financial advice and makes no guarantee of any outcome. Past gap behavior does not predict future results. Always do your own research and use proper position sizing and risk management.
Created by Varun Nidhi · varunnidhi.com
A free DYNA indicator — self-contained, no repainting.
Indicateur

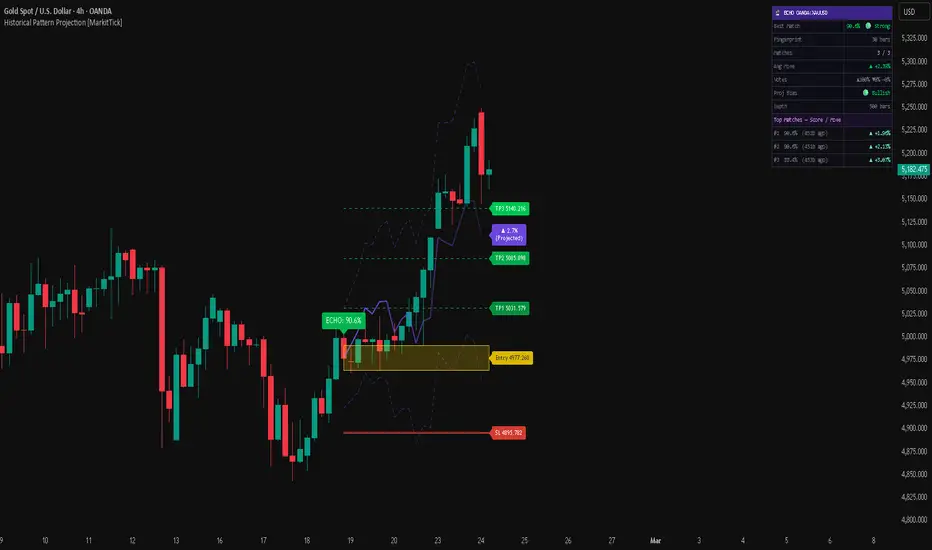
Historical Pattern Projection [MarkitTick]💡 An advanced analytical framework engineered to identify, isolate, and project current price action based on historically correlated market structures. Rather than relying on traditional lagging oscillators or subjective chart patterns, this tool continuously evaluates the most recent sequence of price movements—termed the "fingerprint"—and algorithmically scans historical data to find statistically similar precedents. By projecting the historical outcomes of these matching patterns onto the current chart, it provides an empirical, data-driven perspective on potential near-term price trajectories, seamlessly bridging the gap between quantitative correlation analysis and practical trade management.
✨ Originality and Utility
Traditional technical analysis often relies on rigid, subjective patterns (such as head-and-shoulders or flags) which can be open to interpretation and cognitive bias.
This script completely bypasses subjective pattern drawing by employing a strictly mathematical approach to shape-matching.
It normalizes price action into a pure structural format, allowing it to compare the geometry of the current market with historical markets, regardless of the absolute price levels.
The utility lies in its ability to automatically synthesize the "what happened next" data from historical matches.
Instead of merely signaling overbought or oversold conditions, it provides a probabilistic projection path—a "ghost line"—complete with expected volatility bands and automated risk management levels based on the anticipated outcome.
🔬 Methodology and Concepts
● Core Recognition Engine
• Data Normalization: The current price sequence (the fingerprint) is converted using a statistical Z-Score. This transformation removes the absolute price values and leaves behind the raw volatility-adjusted shape of the trend.
• Deep Historical Scanning: The algorithm iterates backwards through user-defined historical bars (Search Depth) to extract rolling arrays of previous price action.
• Statistical Correlation: Each historical array is compared to the current fingerprint using the Pearson Correlation Coefficient. The resulting value (-1.0 to +1.0) is mathematically scaled into a percentage (0% to 100%) to represent a "Similarity Score."
● Outcome Synthesis and Extrapolation
• Match Aggregation: The script filters out matches that fall below the minimum Similarity Score threshold, keeping only the top configured matches.
• Trajectory Calculation: For each valid match, the script records the price movement that occurred immediately after the historical pattern completed.
• Price Scaling: The historical outcomes are structurally scaled and tethered to the current closing price, allowing the indicator to plot a composite average of these historical outcomes directly into the future empty space of the chart.
🎨 Visual Guide
● On-Chart Projections and Highlights
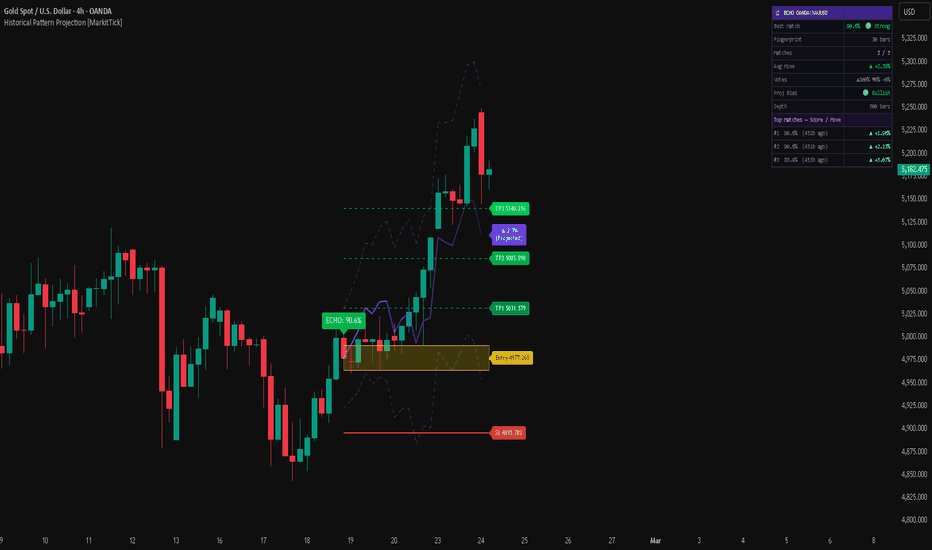
• ECHO Match Zones: The historical periods that closely match the current price action are highlighted with thick, colored vertical bands (defaulting to deep orange). These zones allow for immediate visual verification of the structural similarity.
• Ghost Line (Projection): Plotted into the future, this solid, fading purple line illustrates the average expected trajectory based on the historical matches. It features an arrow and percentage label at the terminus to indicate the total projected directional move.
• Range Bands: Dashed, semi-transparent purple lines expanding outward from the Ghost Line. These bands represent the expected volatility expansion over the projection period, calculated using a dynamically scaling Average True Range (ATR).
● Trade Management Ecosystem
• Entry Box: A highlighted zone (default yellow) projecting forward from the current bar, representing an optimal entry width based on a fraction of the current ATR.
• Stop Loss (SL) Line: A solid red horizontal line indicating the suggested invalidation level, dynamically placed away from the entry using an ATR multiplier.
• Take Profit (TP) Lines: Three dashed green horizontal lines representing tiered profit targets (TP1, TP2, and TP3), scaled mathematically via ATR multipliers in the direction of the historical bias.
● The ECHO Dashboard Table
• Top Match Score: Displays the similarity percentage of the most highly correlated historical pattern. Color-coded for rapid assessment (Green for Strong >80%, Yellow for Moderate, Orange for Weak).
• Fingerprint & Depth: Confirms the lookback length and the total bars scanned.
• Outcome Metrics: Displays the historical "Votes" (percentage of matches that went Bullish, Bearish, or Neutral) and the overall Average Move.
• Historical Roster: The bottom half of the dashboard ranks the individual top historical matches, detailing their exact score, how many bars ago they occurred, and their specific post-pattern return.
📖 How to Use
• Pattern Validation: Monitor the ECHO Dashboard for patterns that achieve a Similarity Score of 80% or higher. Lower correlation scores should be treated with high skepticism as the historical geometries are not closely aligned.
• Bias Confirmation: Check the "Proj Bias" and "Votes" metrics on the dashboard. A strong projection should ideally have unanimous or near-unanimous historical consensus (e.g., 100% Bullish votes).
• Trade Execution: If a high-probability setup is identified, utilize the projected Trade Management levels. The highlighted Entry Box provides a buffer for execution, while the SL and TP lines offer an objective, volatility-adjusted framework for placing orders.
• Alert Integration: The indicator can be tied to dynamic webhooks. Set an alert on the indicator, and when a "Strong" match is found, it will automatically transmit a JSON payload containing the Entry, Stop Loss, and Take Profit levels for automated systems or notifications.
⚙️ Inputs and Settings
● Core Settings
• Freeze Data: A toggle that stops the algorithm from updating on every tick, locking the current projection in place for stable analysis.
• Fingerprint Length: The number of current bars used to form the recognizable pattern. Shorter lengths are highly responsive but prone to noise; longer lengths find deep structural macro-patterns.
• Search Depth: The maximum number of historical bars the algorithm will scan. Increasing this expands the database but requires more computational resources.
• Min Score (%): The correlation threshold required for a historical pattern to be considered valid.
● Projection & Risk Settings
• Ghost Length: Defines how many bars into the future the algorithm should project the historical outcome.
• Entry Width (xATR): Defines the vertical height of the entry box based on current volatility.
• SL & TP Multipliers: Adjustable factors that determine the distance of Stop Loss and Take Profit levels based on the current 14-period ATR.
🔍 Deconstruction of the Underlying Scientific and Academic Framework
• Z-Score Standardization: The algorithm employs standard score normalization to analyze price action. By subtracting the moving average (mean) from the price and dividing by the standard deviation, the data is transformed into a dimensionless unit. This ensures that a pattern occurring in a low-volatility environment can be mathematically matched to the exact same geometric structure occurring in a high-volatility environment.
• Pearson Correlation Coefficient: The core matching engine relies on Pearson's *r*, a measure of linear correlation between two sets of data. The formula computes the covariance of the current fingerprint and the historical candidate window, divided by the product of their standard deviations. This rigorously quantifies how closely the two price paths mirror each other over the specified timeframe.
• Volatility-Adjusted Target Extrapolation: Rather than using fixed percentages or subjective support/resistance, the script utilizes the Average True Range (ATR) to govern its forward-looking risk management bands. Because market regimes shift, the ATR ensures that the projected bands and trade levels expand during turbulent market phases and contract during periods of consolidation, maintaining mathematical proportionality to current market conditions.
• Algorithmic Caveats: Because the script continuously scans and matches the most recent data, the projected path will shift dynamically as new bars form, unless the "Freeze" function is engaged. Furthermore, the indicator evaluates the close of bars; running this framework on non-standard synthetic charts (such as Heikin Ashi or Renko) is fundamentally flawed due to the artificial smoothing of synthetic price data, which alters the underlying statistical distribution.
⚠️ Disclaimer
All provided scripts and indicators are strictly for educational exploration and must not be interpreted as financial advice or a recommendation to execute trades. We expressly disclaim all liability for any financial losses or damages that may result, directly or indirectly, from the reliance on or application of these tools. Market participation carries inherent risk where past performance never guarantees future returns, leaving all investment decisions and due diligence solely at your own discretion. Indicateur
Reversion Setup - Bollinger Bands + RSI Live Dashboard📊 REVERSION SETUP — Bollinger Bands + Live RSI Dashboard
A focused mean-reversion tool combining Bollinger Bands with a real-time
RSI dashboard — built to spot potential reversal zones without cluttering
your chart or burning extra indicator slots.
✅ Bollinger Bands — fully configurable (period, deviation, source, color)
✅ Live RSI Dashboard — current RSI value, overbought/oversold levels,
and real-time alert status, shown in a clean table instead of a
separate pane
🎯 WHY THIS COMBO
Bollinger Bands highlight when price stretches to a statistical extreme,
while the RSI dashboard confirms whether momentum actually backs up that
move. When price tags a band AND RSI flags overbought/oversold at the
same time, that's your reversion signal — two confirmations, one chart.
🔧 FULLY CONFIGURABLE
— Adjust Bollinger period, deviation, source, and color
— Set your own RSI period and overbought/oversold levels
— Adjust dashboard text size
💡 HOW IT WORKS
The RSI dashboard updates live as new candles form, showing:
— Current RSI value
— Upper/Lower band levels
— Alert status (Overbought ↑ / Oversold ↓ / Neutral →)
🔗 PAIRS WELL WITH
Check out my Trend Setup (EMA 50/100/200 + RSI Dashboard) for the
trend-following counterpart to this mean-reversion tool.
💬 Suggestions for the next setup? Drop a comment below — more tools
coming based on community feedback.
If this helped your charts, a like goes a long way 🙏 Indicateur

Indicateur
Indicateur

ATR Trailing SL From Entry Time# ATR Trailing SL From Entry Time
## Overview
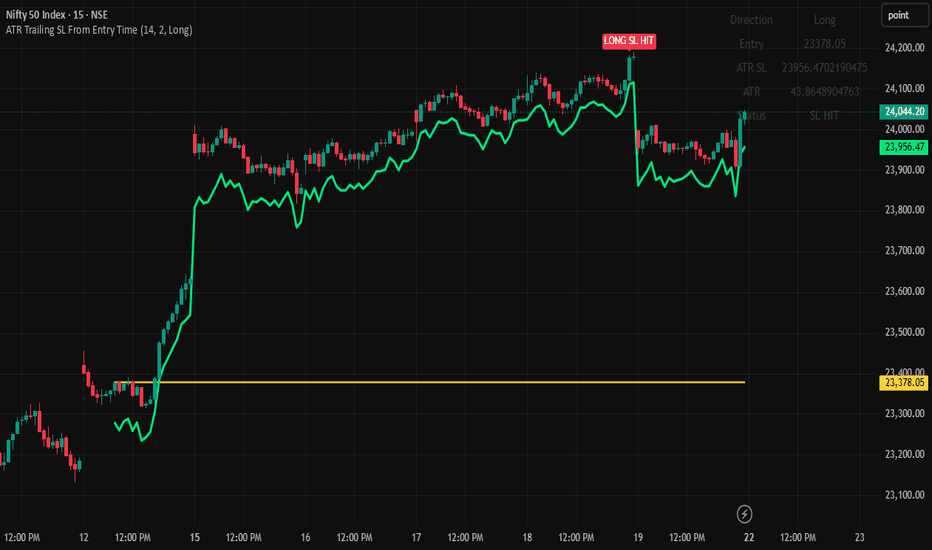
ATR Trailing SL From Entry Time is a simple and practical trade management indicator that helps traders monitor a dynamic ATR-based stop-loss after entering a trade.
Instead of manually adjusting stop-loss levels as volatility changes, the indicator automatically recalculates the stop-loss on every candle using the Average True Range (ATR).
Simply select your trade direction, choose the entry candle using the Entry Time input, and the indicator will continuously update the ATR stop-loss level while monitoring the position.
When price reaches the ATR stop-loss level, the indicator generates a visual chart label and alert notification.
This tool is designed for trade management, stop-loss monitoring, and risk control.
---
## Key Features
### Dynamic ATR Stop Loss
The stop-loss is recalculated on every candle using current market volatility.
**Long Position**
ATR Stop = Close - (ATR × Multiplier)
**Short Position**
ATR Stop = Close + (ATR × Multiplier)
This allows the stop-loss to automatically adapt to changing market conditions.
---
### Entry Time Selection
Instead of manually entering a price, users simply select the candle where the trade was entered using the Entry Time input.
The indicator automatically captures the entry candle and begins monitoring the position from that point forward.
---
### Long & Short Support
Works with both:
• Long Positions
• Short Positions
Simply select the desired direction from the settings panel.
---
### Visual Entry Line
A horizontal entry line is plotted on the chart, making it easy to identify the original trade entry level.
---
### Dynamic ATR Stop Line
The ATR stop-loss line is plotted directly on the chart and updates automatically with every new candle.
This provides a clear visual representation of the current stop-loss level.
---
### One-Time Alert System
When price reaches the ATR stop-loss level:
• A visual chart label appears
• An alert condition becomes true
• The alert triggers only once for the active setup
This prevents repeated notifications after the stop-loss has already been hit.
---
## Inputs
### ATR Length
Determines the ATR calculation period.
Common values:
• 14 (Default)
• 21
• 50
Lower values react faster to volatility changes.
Higher values produce smoother stop-loss levels.
---
### ATR Multiplier
Controls the distance between price and stop-loss.
Examples:
• 1.0 ATR
• 1.5 ATR
• 2.0 ATR
• 3.0 ATR
Higher multipliers create wider stop-loss levels.
Lower multipliers create tighter stop-loss levels.
---
### Direction
Select trade direction:
• Long
• Short
---
### Entry Time
Choose the candle where the trade was entered.
The indicator will automatically begin monitoring the position from that candle onward.
---
### Show Entry Line
Enable or disable the entry price visualization.
---
### Show ATR SL Line
Enable or disable the ATR stop-loss visualization.
---
## How To Use
### Long Trade Example
Step 1
Add the indicator to your chart.
Step 2
Open indicator settings.
Step 3
Select:
Direction = Long
Step 4
Choose the Entry Time corresponding to your trade entry candle.
Step 5
Configure ATR settings.
Example:
ATR Length = 14
ATR Multiplier = 2
Step 6
The indicator will automatically:
• Detect the entry candle
• Plot the entry level
• Plot the ATR stop-loss level
• Update the stop-loss every candle
Step 7
Monitor the trade and wait for either:
• Trade management decisions
• Stop-loss trigger notification
---
### Short Trade Example
Step 1
Select:
Direction = Short
Step 2
Choose your Entry Time.
Step 3
Adjust ATR settings if desired.
The ATR stop-loss line will now be calculated above price and updated continuously.
---
## Alert Setup Guide
### Creating Alerts
1. Add the indicator to your chart.
2. Click the TradingView "Create Alert" button.
3. Under Condition select:
ATR Trailing SL From Entry Time
4. Choose one of the following alert conditions:
• Long ATR SL Hit
or
• Short ATR SL Hit
5. Select your preferred notification method:
• App Notification
• Popup Notification
• Email Notification
• Webhook Notification
6. Click Create.
The alert will trigger automatically when the ATR stop-loss level is reached.
---
## Logic Explanation
### Long Position Logic
ATR Stop = Close - (ATR × Multiplier)
If:
Low <= ATR Stop
The stop-loss event is triggered.
---
### Short Position Logic
ATR Stop = Close + (ATR × Multiplier)
If:
High >= ATR Stop
The stop-loss event is triggered.
---
## Best Use Cases
This indicator can be used for:
• Swing Trading
• Day Trading
• Scalping
• Trend Following Strategies
• Futures Trading
• Forex Trading
• Cryptocurrency Trading
• Stock Trading
---
## Important Notes
• This indicator is a trade management tool and not an entry signal generator.
• ATR values change with market volatility, therefore stop-loss levels will continuously update.
• Always combine ATR-based stop-loss management with proper position sizing and risk management.
• No indicator can guarantee profits or eliminate trading risk.
---
## Open-Source Notice
This script is published as Open Source for educational and research purposes.
Feel free to study, modify, improve, and adapt the code to fit your own trading style and risk management requirements.
If you find this indicator useful, consider leaving a like, sharing feedback, and supporting future development.
Happy Trading and Trade Safe!
Indicateur
Volume Pressure & Support/Resistance [Proxy]
1.Spread & Close Position (Execution at Ask/Bid): We calculate the candle's spread (high - low). A close near the high indicates buying pressure (trades clearing the Ask), while a narrow spread with unusually high volume often indicates absorption (limit orders absorbing market selling).
2.Support & Resistance: We dynamically identify support and resistance levels using pivot highs and lows to define where "trend continuations" and "reversals" are likely to occur.
3.Trend Continuation Buy (Breakout): Fires when the price crosses above a known resistance level, accompanied by high volume and a strong close (proxy for clearing large Asks at resistance).
4.Reversal Buy (Absorption): Fires when the price drops to or slightly below a known support level but manages a strong close on high volume. This serves as a proxy for a large, replenishing Bid absorbing downward pressure at support.
How to Use It
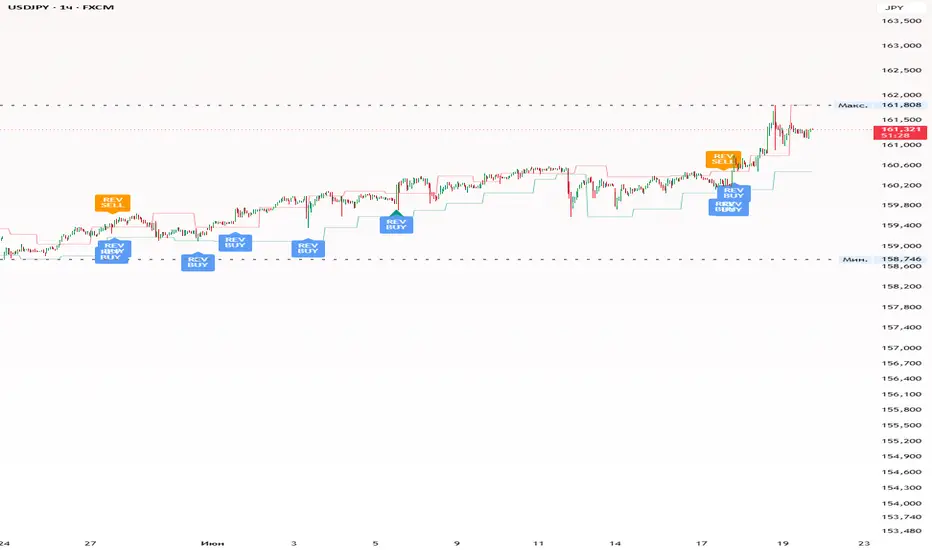
Blue 'REV' Labels represent Reversal Buys. Watch for these when the stock is bouncing off the green Support lines.
Green Triangles represent Trend Continuation Buys. Watch for these when the stock is breaking above the red Resistance lines.
You can adjust the Pivot Length (how far back to look for support/resistance) and the High Volume Multiplier in the indicator settings to fine-tune the strictness of the signals.
Here is how the new sell proxies work:
Trend Continuation Sell (Breakdown):
Fires when the price crosses below a known support level (proxy for a large Bid being cleared out).
Confirmed by high volume and a weak close (closing near the bottom of the candle's spread), which acts as a proxy for trades executing predominantly at the Bid price.
Reversal Sell (Absorption at Resistance):
Fires when the price pushes up into a known resistance level but is met with high volume and a weak close.
This represents a lack of further price appreciation despite rising volume, acting as a proxy for a large, replenishing Ask absorbing the buying pressure.
Visual Updates:
*Red Triangles: Indicate a Trend Continuation Sell (breakdown below support).
*Orange 'REV SELL' Labels: Indicate a Reversal Sell (price stopping at resistance, signaling absorption by sellers).
Adjustable Sensitivity Inputs:
I added a new settings group called "Volume & Sensitivity".
You can now adjust the Strong Close Threshold and Weak Close Threshold. For example, setting the strong close threshold to 0.8 means the candle must close in the top 20% of its range to count as a proxy for "execution at the Ask" (stricter than before).
The High Volume Multiplier and Volume Moving Average Length are now fully customizable so you can decide exactly what constitutes a "high volume" spike.
Volume Delta Proxy:
*Since Pine Script doesn't have native real-time bid/ask volume delta on the chart directly, I created a mathematical proxy for it.
*It estimates how much of the bar's volume was "buying" versus "selling" based on where the close is within the high-low spread.
*A new toggle called Use Volume Delta Proxy is enabled by default.
*If enabled, a Buy Signal will only fire if the estimated buying volume was greater than the selling volume (positive delta). A Sell Signal will only fire if the estimated selling volume outweighed the buying volume (negative delta). Indicateur

Alpha Forge Liquidity Matrix v2.2# Liquidity Matrix
Liquidity Matrix is a native TradingView overlay designed to map probable liquidity zones, identify sweep traps, and help traders understand where price may be hunting stops.
Instead of focusing only on traditional trend signals, this tool looks at market structure through the lens of liquidity.
Where are traders likely trapped?
Where are stops likely clustered?
Where did price sweep liquidity and reject?
Did the reclaim actually confirm, or did it fail?
Liquidity Matrix was built to answer those questions directly on the chart.
---
## What It Does
Liquidity Matrix tracks recent swing highs and swing lows, then clusters nearby levels into projected liquidity zones.
These zones represent areas where stop orders may be concentrated:
* Swing highs can create buy-side liquidity above price
* Swing lows can create sell-side liquidity below price
* Repeated reactions near the same area increase the weight of that zone
* Stronger zones are shown as heavier projected boxes
The result is a visual map of where liquidity may be sitting before price reaches it.
---
## Liquidity Zones
The indicator draws forward-projected heat boxes directly on the chart.
Upper zones represent probable buy-side liquidity.
Lower zones represent probable sell-side liquidity.
Zone strength is classified as:
* Minor
* Active
* Major
The stronger the zone, the more important that area may become when price approaches it.
These zones are not standard support and resistance lines. They are designed to highlight areas where traders may be trapped, where stops may be clustered, and where fake breakouts or sweep moves may occur.
---
## Sweep and Reclaim Logic
A key feature of Liquidity Matrix is its ability to identify liquidity sweeps.
A sweep occurs when price pushes beyond a liquidity zone, grabs that liquidity, and then rejects or reclaims.
The script separates these events into clearer signal types:
### Buy Signal
A buy signal can occur when sell-side liquidity is swept and price confirms a bullish reclaim.
This suggests price pushed below a lower liquidity zone, triggered stops, and then recovered back above the level.
### Sell Signal
A sell signal can occur when buy-side liquidity is swept and price confirms a bearish rejection.
This suggests price pushed above an upper liquidity zone, triggered stops, and then failed to hold the breakout.
### Exit Long
An exit long signal appears when price sweeps upper liquidity and rejects strongly enough to trigger a structural warning.
This is designed as a circuit-breaker style warning for long positions.
### Exit Short
An exit short signal appears when price sweeps lower liquidity and reclaims strongly enough to trigger a structural warning for short positions.
---
## Signal Strictness
Liquidity Matrix includes three signal strictness modes:
### Early
Signals can trigger faster using wick-based reclaim or rejection logic.
This mode is more responsive, but may produce more early signals in choppy markets.
### Balanced
Signals require a cleaner close-based reclaim or rejection.
This is the default mode and is designed to balance responsiveness with confirmation.
### Confirmed
Signals require follow-through confirmation after the sweep.
This mode is stricter and may reduce false signals, but signals can appear later.
---
## Trade Direction Control
The indicator includes trade direction settings so users can match the tool to their trading style.
Options include:
* Longs & Shorts
* Longs Only
* Shorts Only
In Longs Only mode, buy signals remain active while short-style sell signals are treated as warnings instead of short entries.
In Shorts Only mode, sell signals remain active while long-style buy signals are treated as warnings instead of long entries.
This makes the tool easier to use for stock traders, crypto traders, futures traders, and users who only trade one side of the market.
---
## Signal Label Styles
Liquidity Matrix includes flexible label wording.
Users can choose between:
* Liquidity Terms
* Plain Buy/Sell
* Both
Liquidity Terms display labels such as SSL Reclaim and BSL Reject.
Plain Buy/Sell mode displays simple BUY, SELL, EXIT LONG, and EXIT SHORT labels.
Both mode displays the trade meaning and the liquidity event together.
This allows advanced traders to keep the market-structure terminology, while newer users can choose simpler chart labels.
---
## Dashboard
The dashboard provides a quick read of the current liquidity environment.
It can show:
* Current analysis timeframe
* Nearest upper liquidity zone
* Nearest lower liquidity zone
* Circuit breaker state
* Latest event
* Current bias
* ATR sweep power
* Confirmation status
The bias reading helps identify whether the chart is currently leaning toward sweep risk above, sweep risk below, post-sweep bullish behavior, post-sweep bearish behavior, or a circuit-breaker state.
---
## Confirmation Filters
Liquidity Matrix includes several optional filters to improve signal quality.
### Volume Confirmation
Requires relative volume to meet a minimum threshold before sweep signals are confirmed.
### Trend Filter
Allows signals to be filtered by trend conditions.
Modes include:
* Off
* Signal Quality
* Strict Signals
### Session Killzones
Allows users to define preferred trading windows.
Signals can be filtered to specific sessions, and optional session shading can be displayed on the chart.
### ATR Sweep Strength
The dashboard can show how powerful a sweep is relative to ATR.
This helps separate small liquidity taps from stronger displacement-style sweeps.
---
## Alerts
The indicator includes simplified alert names for easier setup.
Available alert types include:
* Buy Signal
* Sell Signal
* Exit Long
* Exit Short
* Any Buy/Sell Signal
* Any Exit Signal
* Long Warning
* Short Warning
This makes it much easier to create TradingView alerts without needing to understand every internal liquidity term.
Webhook-ready JSON alert calls are also available for users who want structured alert messages for automation, bots, dashboards, or external systems.
---
## How to Use It
Liquidity Matrix is best used as a structure and risk tool, not as a blind signal generator.
Common use cases include:
* Avoiding breakout traps near major liquidity zones
* Spotting failed sweeps before price reverses
* Confirming potential entries after sell-side or buy-side liquidity is swept
* Exiting long positions after upper liquidity rejection
* Exiting short positions after lower liquidity reclaim
* Identifying areas where price may be drawn toward liquidity
* Filtering trade ideas with volume, trend, session, and ATR confirmation
A strong use case is combining Liquidity Matrix with a separate trend or momentum tool.
For example:
A buy signal after sell-side liquidity is swept may carry more weight when trend, volume, and momentum are also aligned.
A sell signal after buy-side liquidity is swept may be more meaningful when price rejects a major upper zone with strong ATR expansion.
---
## Important Notes
Liquidity Matrix does not know where actual stop orders are placed.
It estimates probable liquidity areas using swing structure, repeated reactions, clustering, volatility, and rejection behavior.
The indicator does not guarantee future price movement.
It is designed to help traders better understand where liquidity may be building, when price may be sweeping that liquidity, and when a move may be a trap instead of a true breakout.
As always, this tool should be used with proper risk management and as part of a complete trading plan.
---
## Summary
Liquidity Matrix is a visual liquidity-mapping system built for traders who want to look beyond basic support, resistance, and lagging indicators.
It identifies probable stop clusters, projects liquidity zones forward, detects sweeps and reclaims, provides buy/sell/exit signals, and gives traders a clearer view of when price may be hunting liquidity.
The goal is simple:
See the trap before reacting to it.
Indicateur

Indicateur

Stratégie

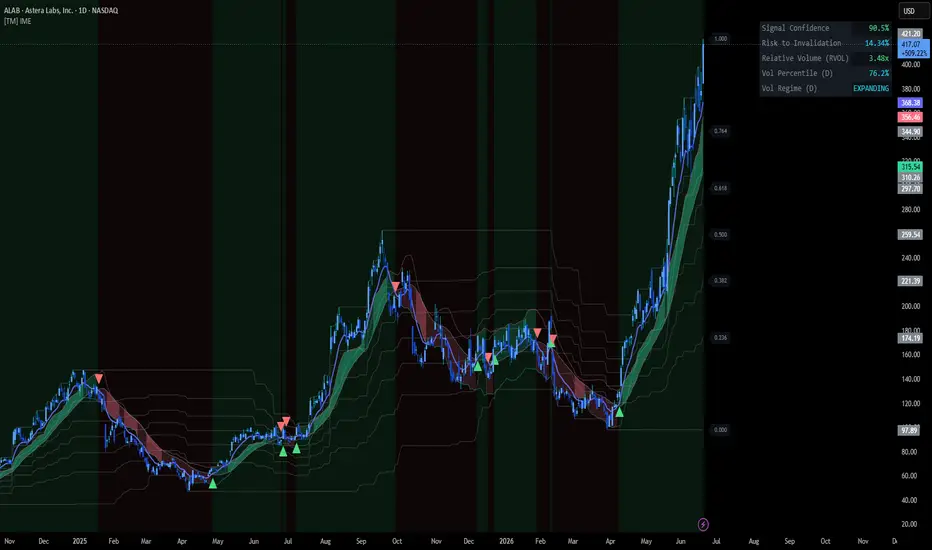
TrendMatrix: Institutional Momentum & Regime Engine Institutional Momentum Engine.
The market is driven by vast amounts of data—volatility regimes, relative volume, and macro trend alignment. The Institutional Momentum Engine is designed to capture this institutional-grade data and bring it to your fingertips in one clean, actionable dashboard.
This engine is the precision counterpart to the TrendMatrix Screener suite. While our screeners scan the market to identify opportunities, this engine is the tactical tool you use to manage them—providing the structural clarity needed to execute with confidence, whether you are analyzing a 5-minute chart or planning a 4-hour swing trade.
Key Technical Advantages:
• Macro Regime Alignment: The MTF (Multi-Timeframe) engine automatically scans higher-timeframe volatility to ensure your trades are synchronized with the broader market pulse.
• Momentum Clarity: By blending Z-Score extensions with trend slope analysis, the engine isolates high-conviction momentum, helping you identify opportunities where volume and price are in harmony.
• Volume-Weighted Confidence: Every signal is cross-referenced with Relative Volume (RVOL), ensuring you only focus on moves supported by significant market participation, effectively helping you filter out noise.
• Adaptive Risk Management: The "Risk-to-Invalidation" feature maps out the structural boundaries of your trade automatically, providing a clear visual for your risk management strategy.
• Clean, Professional UI: A powerful HUD dashboard that organizes your critical data into a clean, distraction-free interface.
The Dashboard as a Confluence Engine Most single stock indicators display technical metrics in isolation. The Momentum Engine synthesizes these distinct streams—Momentum (Z-Score), Volume (RVOL), and Volatility (MTF Regime)—into a single, cohesive "Risk" state.
• Risk-On (Momentum Runway): When the engine detects High Confidence + Expanding Volatility + Rising RVOL, the HUD highlights "Momentum Runway." This indicates that price, volume, and volatility are moving in structural alignment, signaling an institutional breakout.
• Risk-Off (Neutral/Compression): When confidence dips or volatility regresses (or volume dries up), the HUD dynamically updates to reflect a "Standard" or "High-Risk" zone. This signals that the institutional fuel has subsided and the market has entered a phase where mean-reversion is more likely than trend continuation.
Precision, not Prediction. The Institutional Momentum Engine doesn't guess where the price is going. It uses advanced mathematical modeling to show you exactly where the "institutional runway" is forming. It is the perfect tool for traders who want to transition from reacting to noise to following structural logic.
The TrendMatrix Workflow: From Screening to Execution This indicator is designed to complement our Matrix Screener suite. Use the TrendMatrix Screeners to identify high-potential assets, and apply the Institutional Momentum Engine to your chart to map your entries, manage your risk, and ride the institutional wave with precision.
TrendMatrix Labs: Advanced Analytics. Accessible Flow. Indicateur

Multi-Timeframe CandlesMULTI-TIMEFRAME CANDLES
WHAT IT IS
Multi-Timeframe Candles is a visual context tool that displays the current (still-forming) candle from higher timeframes directly on your chart, without requiring you to switch the chart's timeframe. Instead of flipping back and forth between 5m, 15m, 1h, 4h, and Daily charts to check what the bigger picture looks like, this indicator brings that information to you in real time, rendered as a small set of candles off to the side of the price action.
The timeframe list is fixed: 5 minutes, 15 minutes, 1 hour, 4 hours, and Daily. The indicator automatically compares each of these against the timeframe you are currently viewing and only draws the ones that are strictly higher. For example, if you are on a 5-minute chart, you will see 15m, 1h, 4h, and D. If you are on a 1-hour chart, you will only see 4h and D, since 5m and 15m are no longer higher timeframes relative to your current view. This keeps the display relevant no matter which timeframe you trade on.
WHAT IT IS MADE OF
Each higher timeframe is represented by a single candle, built from three drawing elements:
- A rectangular body showing the open and close of that timeframe's current candle, colored green (bullish) if close is greater than or equal to open, or red (bearish) otherwise.
- A thin vertical wick showing the full high-to-low range of that timeframe's current candle.
- A text label positioned below the candle, identifying which timeframe it represents (5m, 15m, 1h, 4h, or D).
These candles are placed in a horizontal row to the right of your current price action, spaced evenly apart, ordered from the smallest qualifying timeframe to the largest (left to right). They update live as price moves, since each candle reflects the still-forming candle of its respective timeframe, not a closed historical one.
HOW TO READ IT
Each candle should be read exactly like you would read it on its native timeframe's chart:
- A green candle means that timeframe is currently trading above where it opened — net bullish pressure so far on that timeframe.
- A red candle means that timeframe is currently trading below where it opened — net bearish pressure so far on that timeframe.
- The length of the wick relative to the body tells you about volatility and rejection within that timeframe's current candle: a long wick with a small body suggests indecision or a strong intra-candle reversal, while a large body with short wicks suggests a strong, decisive directional move.
- Comparing the candles across timeframes side by side lets you quickly judge alignment: if your lower timeframe and the higher timeframes are all the same color, you have multi-timeframe confluence in one direction. If they disagree (e.g., the 5m candle is red while the 4h and Daily candles are green), you are likely looking at a short-term pullback or reaction within a larger prevailing trend, which carries very different implications than a same-direction move.
HOW TO USE IT
This indicator is meant purely as a contextual reference, not a standalone signal generator. The intended use is:
1. Stay on your working timeframe (the one you actually use for entries, e.g., 1m or 5m).
2. Glance at the row of higher-timeframe candles to instantly understand where price stands relative to the open of each larger timeframe, without needing to switch charts and lose your current view, drawings, or zoom level.
3. Use this context to filter or qualify setups on your working timeframe. For example, a bullish setup on a lower timeframe may carry more weight if the higher timeframe candles are also green, indicating you are trading with the larger trend rather than against it.
4. Use it to anticipate behavior near higher-timeframe candle opens, since price often reacts around these levels even when they are not explicitly plotted as horizontal lines.
All visual aspects (candle width, spacing between candles, distance from the last bar on the chart, bullish/bearish colors, and label size) are configurable through the indicator's settings panel to fit your chart layout and personal style. Indicateur

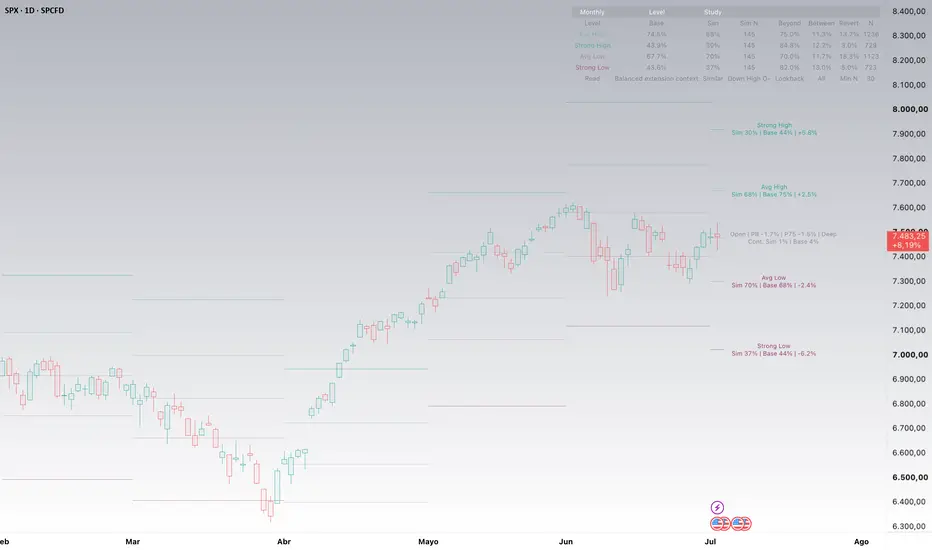
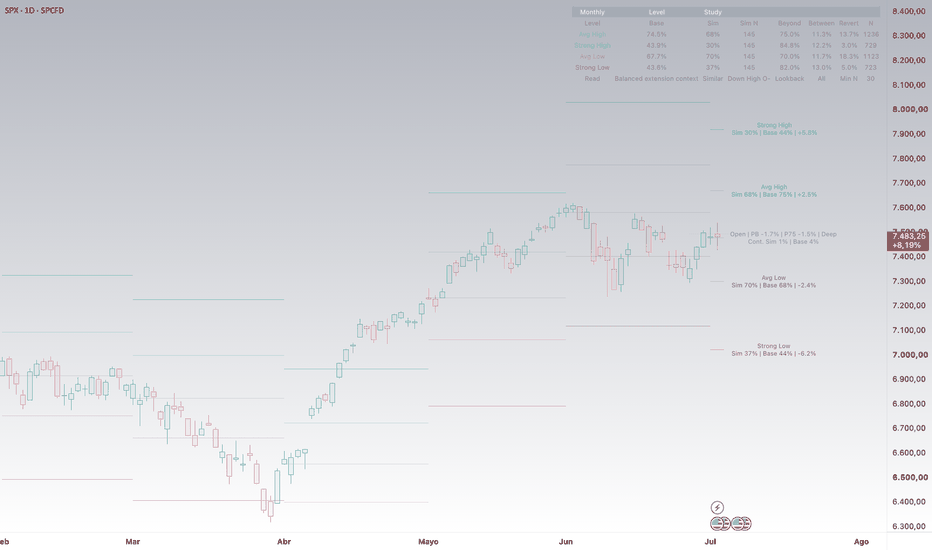
Monthly Statistical LevelsMonthly Statistical Levels is an open-source indicator that plots monthly reference levels based on historical monthly price extensions from the monthly open.
The goal of the script is to provide a clean statistical map for the current and recent months. It is designed as a market structure and reference-level tool, not as a buy/sell signal system.
How it works
The script uses completed monthly candles from TradingView data.
For each completed month, it calculates two historical extensions:
High extension:
Monthly High minus Monthly Open, divided by Monthly Open.
Low extension:
Monthly Open minus Monthly Low, divided by Monthly Open.
These historical extensions are stored separately for upside and downside movement.
At the start of each new month, the script uses the current monthly open and projects five reference levels:
Strong High
Avg High
Open
Avg Low
Strong Low
Avg High is based on the historical average upside extension from the monthly open.
Avg Low is based on the historical average downside extension from the monthly open.
Strong High uses the average upside extension plus a configurable standard deviation multiplier.
Strong Low uses the average downside extension plus a configurable standard deviation multiplier.
By default, the strong multiplier is set to 1.0, meaning strong levels use the historical average extension plus one standard deviation.
Lookback options
Users can choose the statistical lookback used for the calculations:
24 months
36 months
60 months
120 months
All available history
Using all available history can make the levels more stable, but it may also mix different market regimes. This is especially important for assets with structural changes, short trading histories, or very different behavior across cycles.
No lookahead logic
The indicator uses completed monthly candles to build the historical sample.
Each month keeps the levels calculated with the information available at the start of that month. The current month is used only for its monthly open, which is known once the month begins.
This means the levels are not recalculated using future monthly highs or lows.
How to use it
The levels can be used as a visual reference for monthly range structure.
Possible uses include:
Identifying where price is trading relative to its monthly statistical range.
Comparing the current month with recent monthly behavior.
Observing when price reaches average or stronger historical extension zones.
Keeping a cleaner chart with only the most recent visible months.
Main settings
Visible months:
Controls how many recent months are displayed. The default is 6 and the maximum is 12 to keep the chart readable.
Statistical lookback:
Controls the historical sample used to calculate average and strong levels.
Minimum closed months:
Defines the minimum number of completed monthly candles required before plotting levels.
Strong multiplier:
Controls how far strong levels are placed from average extension levels using standard deviation.
Labels:
Users can show labels only for the current month, for all visible months, or turn labels off.
Alerts
The script includes optional alert conditions for touches of:
Strong High
Avg High
Open
Avg Low
Strong Low
Limitations
This indicator does not predict future price movement.
It does not identify support or resistance with certainty.
It does not generate buy or sell signals.
It does not evaluate trend, fundamentals, macro conditions, liquidity, positioning, or news.
The levels depend on the TradingView symbol selected, the available historical data, and the chosen lookback window.
Why it may be useful
Many traders look at monthly opens, monthly ranges, and volatility-based zones separately. This script combines those ideas into one clean open-source tool: monthly open-based statistical levels built from completed historical monthly extensions.
It helps traders visualize where price is trading relative to its own historical monthly behavior, while keeping the chart simple and readable. Indicateur
Pulse Squeeze Matrix (PSM)🚀 PULSE SQUEEZE MATRIX
The Pulse Squeeze Matrix (PSM), engineered by gunebak4n, is a multi-layer volatility compression and breakout detection framework designed to identify high-probability expansion phases within structurally defined market ranges.
PSM is built on the principle that significant market movement originates from volatility contraction phases where energy accumulates across multiple dimensions simultaneously. By combining Fibonacci-based structural mapping, dual volatility squeeze detection, volume normalization, and momentum scoring, the system isolates compression zones that precede directional expansion.
Unlike conventional squeeze indicators that rely on a single volatility metric, PSM integrates multiple independent compression signals and validates them through volume pressure and trend context to reduce false breakout interpretation.
💡 CORE DESIGN PRINCIPLE
🧭 Multi-Dimensional Market Compression
PSM interprets the market as a layered compression system where price, volatility, and volume converge before expansion. True breakout conditions emerge only when these layers align structurally.
🧬 Structure–Volatility–Flow Interaction Model
The system evaluates three interacting components:
• Structure: Fibonacci-derived equilibrium zones
• Volatility: Bollinger Band width + ATR contraction
• Flow: volume z-score + momentum dynamics
The alignment of these components defines the probability of directional expansion.
💡 KEY FEATURES
📊 Fibonacci Structural Framework
Market structure is mapped using dynamic Fibonacci retracement levels (0.382, 0.5, 0.618) derived from a rolling high–low range. These levels act as probabilistic reaction zones for breakout and reversal behavior.
🧪 Dual Volatility Squeeze Engine
PSM detects compression using:
• Bollinger Band width contraction relative to recent extremes
• ATR suppression below its local mean
A valid squeeze state occurs only when both volatility conditions are simultaneously satisfied.
📦 Volume Z-Score Confirmation Layer
Volume activity is normalized using a z-score model to identify statistically significant participation spikes. Breakouts without volume confirmation are filtered out or downgraded.
📈 Momentum Pressure Scoring
Short-term price changes are smoothed via exponential momentum averaging and normalized against recent volatility of momentum, producing a relative pressure metric rather than absolute direction.
🧠 Breakout Context Filter
Breakout signals are defined as structural crossings of Fibonacci levels adjusted by ATR buffers, ensuring that only volatility-backed expansions trigger signal conditions.
🎨 Regime-Sensitive Candle Dynamics
Candlestick coloring reflects combined regime state:
• Compression regime: squeeze state highlighting
• Bull regime: price above long-term trend baseline
• Bear regime: price below long-term trend baseline
• Momentum intensity modulates transparency to reflect pressure strength
🔬 MATHEMATICAL STRUCTURE
Price displacement:
ΔP(t) = Close(t) − Close(t−1)
Structural range:
R = HighestHigh(n) − LowestLow(n)
Fibonacci levels:
Fₓ = High − R × x
Volatility compression:
BBWidth = (UpperBB − LowerBB) / SMA(Close)
ATR compression condition:
ATR(t) < SMA(ATR, n)
Squeeze condition:
S = (BBWidth in local contraction zone) ∧ (ATR compression)
Volume normalization:
Zv = (Volume − Mean(Volume)) / Std(Volume)
Momentum field:
M(t) = EMA(ΔP, k)
Normalized momentum pressure:
P(t) = M(t) / Mean(|M(t)|)
Breakout conditions:
BullBreak = Close crosses above (F0.382 + ATR buffer)
BearBreak = Close crosses below (F0.618 − ATR buffer)
This structure ensures that breakout signals only occur when structural, volatility, and participation conditions align simultaneously.
🛠️ USAGE FRAMEWORK
1. Volatility Compression Detection
Identify squeeze zones where both ATR and Bollinger Band width contract simultaneously, indicating energy accumulation.
2. Structural Breakout Mapping
Use Fibonacci levels as dynamic equilibrium zones to evaluate breakout validity and directional bias.
3. Volume-Validated Expansion
Prioritize signals where volume z-score exceeds baseline activity thresholds, confirming real participation.
4. Momentum Regime Interpretation
Monitor normalized momentum pressure to assess whether breakouts are sustained or fading.
5. Trend Context Filtering
Align signals with higher-timeframe trend bias (above/below moving average equilibrium) to reduce countertrend noise.
⚙️ SYSTEM CHARACTERISTICS
• Multi-layer volatility compression detection
• Fibonacci-based structural probability mapping
• Volume-normalized confirmation filtering
• ATR-adjusted breakout sensitivity control
• Momentum-regime adaptive interpretation
• Noise-reduced signal architecture across consolidation phases
📌 CREDIT
Pulse Squeeze Matrix (PSM) is developed by gunebak4n as a structural volatility compression and breakout detection framework for TradingView.
The system is designed for identifying statistically significant expansion phases emerging from multi-factor market compression, rather than isolated indicator-driven signals.
⚠️ DISCLAIMER
PSM is a probabilistic analytical model. It does not predict market outcomes or guarantee trading performance. All signals must be interpreted within a disciplined risk management framework and validated with broader market context. Indicateur

Levels V1.5 Wall Street RedneckLevels V1.5 — Wall Street Redneck
🔵 OVERVIEW
Levels V1.5 is a multi-layer price structure tool that maps three distinct areas of market interest onto a single, clean chart overlay.
Rather than relying on a single reference point, this script combines dynamic price averaging, volatility-based swing detection, and historically significant price levels to give traders a complete picture of where price has been, where it is, and where it may interact next.
The script is designed to support high-probability entry and exit decisions by identifying zones of confluence — areas where two or more layers of interest overlap, increasing the significance of a reaction.
It also helps traders identify zones to avoid, preventing entries into areas of historically poor risk-to-reward or active congestion.
🔵 CORE CONCEPTS
Candle Average Price Structure
A dynamic average derived from ongoing price action is used to identify the mean of recent candle behavior. This creates a reference band that adapts to current market conditions and helps define whether price is extended above or below its natural center of gravity.
ATR-Based Swing Interaction
An Average True Range component measures the current volatility environment and projects interaction boundaries around active price swings. This layer adjusts dynamically as volatility expands and contracts, providing context for how far price can realistically move before encountering resistance or support.
Key Price Level Mapping
Previously established and currently active price reference points are plotted directly on the chart. These include:
• Current Day High, Open, and Low
• Previous and Current Daily High and Low
• Previous and Current Weekly High and Low
• Previous and Current Monthly High and Low
• Previous and Current Yearly High and Low
• Previous and Current 4-Hour High and Low
These levels represent areas where institutional and retail participants have previously reacted, making them high-probability zones for future interaction.
🔵 HOW IT WORKS
The three layers of this script work together to define a structured decision-making framework:
• The candle average identifies price location relative to recent action
• The ATR layer defines the active swing range and volatility context
• The key level map identifies historically significant price points within that range
When price approaches an area where multiple layers converge, the significance of that zone increases. Entries taken at isolated levels carry less context than entries taken at zones of multi-layer confluence.
Customizable Zone Mapping
Each plotted zone displays both a top price and a bottom price, giving traders exact reference points for zone boundaries. These values can be used directly for limit order placement, stop positioning, or target identification.
Zone inputs are fully customizable, allowing traders to adjust sensitivity and range to match their preferred instrument and timeframe.
🔵 TRADE MANAGEMENT APPLICATIONS
• Use zones of confluence as high-probability entry areas
• Avoid initiating new trades inside areas of active congestion or between two opposing levels
• Use ATR interaction boundaries to set realistic target expectations
• Reference the key level map to identify where price may stall, reverse, or accelerate
• Use zone top and bottom prices for precise bracket order placement
🔵 IMPORTANT NOTES
This script is designed for EDUCATIONAL PURPOSES and is intended to support a structured trading process, not replace one. No indicator guarantees trade outcomes.
Developed and maintained by Wall Street Redneck. Licensed for personal and student use only. Redistribution is not permitted. Indicateur

Indicateur

AetherEdge - Volatility Forecast🖊️ Overview
ATR shows yesterday's volatility; AE-VOL forecasts the next move and states the uncertainty honestly. An adaptive EWMA variance model estimates forward volatility, drawn on price as a conformal-calibrated expected-range envelope, alongside a volatility regime and a vol-targeted position-size readout.
🔶 Key Features
Adaptive vol forecast — the EWMA decay λ is learned online and reacts to volatility clustering
Calibrated range envelope — the N-bar range is statistically calibrated to hit a target coverage
Forward cone — projects the forecast range into the future
Volatility regime — low/normal/high with expanding ↑ / contracting ↓
Expected move — next-bar ±% and N-bar ±%
Vol-targeted sizing — a multiple that shrinks when forecast vol is high, grows when low
Alerts on regime change; bar-close updates — no repaint
🧠 Technical Architecture
Vol model (adaptive EWMA): h_t = λ·h_{t-1} + (1-λ)·r² (RiskMetrics — a GARCH(1,1) special case with ω≈0; reactivity = 1-λ, persistence = λ). The single decay λ is learned online by quasi-likelihood (QLIKE) with a recursive derivative. A full 3-parameter GARCH has a flat, ill-conditioned likelihood that single-pass SGD won't recover, so AE-VOL adapts one well-conditioned parameter — robust and honest. Returns are in % for numerical stability.
Calibration (split-conformal): the forecast is wrapped in a distribution-free band — the (1-α) quantile of realized standardized moves rescales the envelope so coverage matches the target empirically (fat tails included). No lookahead: the standardizer is the forecast made N bars ago.
Sizing: multiple = clamp(target vol / forecast vol, min, max).
Honest scope: an EWMA variance recursion + one online-adapted parameter + nonparametric conformal calibration (this tool uses no RL). Not deep learning, not a guarantee.
⚙️ Recommended Settings & Tuning Guide (crypto 15m–4H)
Key parameters: decay learning rate, initial λ, horizon N, band significance (1-α), calibration window, target per-bar vol %.
Initial λ ≈ 0.94 is standard; it auto-adjusts (higher-vol assets converge to lower λ = more reactive)
N is how far ahead you care about; 5–20 bars for 15m–1H
Calibration window ≈ 200; longer is steadier, shorter tracks the recent regime
Target vol % is the per-bar vol you want per position; 0.5–1.5% for crypto 15m–1H
Band significance defaults to 0.90 (10% expected outside); the HUD shows realized coverage
💡 How to Use in Practice
Use the range envelope for take-profit/stop or range judgment (outside the band = statistically unusual)
Regime HIGH favors breakout/trend; LOW (squeeze) flags reversal/range setups
Use the size multiple for vol-targeted money management (auto-smaller in high vol)
The closer coverage is to target, the more trustworthy the band; if it drifts, adjust N or the window
Combine with AE-BPE (breakout probability) or AE-AVP (volume profile) to layer regime × level
⚠️ Important Notes
Needs a learning period (warmup); λ re-learns on timeframe/parameter change
The envelope is a probabilistic range, not a guarantee that price stays inside
The vol forecast gives magnitude, not direction
Probability, not a guarantee — always do your own due diligence and use risk management
🚨 Disclaimer
This indicator is for educational and informational purposes only and is not financial advice or a recommendation to buy or sell. No method guarantees future profits; past performance does not indicate future results, and trading carries the risk of loss. All decisions are your own — use proper validation and disciplined risk management. Indicateur

Friction Map [NovaLens]Friction Map reads price structure the way a floor trader reads a room: it finds the price shelves where the market actually spent time, marks which ones are still live versus which the market has abandoned, and measures how much clear air you have to the nearest live shelf in each direction. It is a map of where structure is, how alive it is, and where the open space sits - not a buy or sell signal.
Most support/resistance tools draw static lines and leave them there forever, so the chart fills with levels that stopped mattering 300 bars ago. Friction Map keeps the same structure honest over time: every shelf carries a freshness that decays once the market stops trading at it, so the orange (live) shelves are the ones price has interacted with recently and the gray (fading) ones visibly age out.
═════════════════════════════════════════
◈ HOW TO READ IT
Friction Map draws directly on the price chart. There are two views of the same structure.
The shelves.
Orange = LIVE - price traded here recently; this is the current structure context.
Gray = FADING - price has not returned in a while; the market has moved on and the shelf dims the longer it stays untouched.
Faint dotted = BROKEN - price closed through it; an x-cross marks the exact bar it failed, and the dotted tail is kept so you can still see it existed.
KEY LEVEL - the strongest live shelf on the map (boldest line, brightest tag). The eye's anchor.
The room boxes. On the right edge, a box runs from current price to the nearest LIVE shelf above and below, with a label that reads the distance as a near-to-far range in ATR, for example "1 to 2.1 ATR" - meaning roughly 1 ATR of clear air, then the shelf running out to 2.1 ATR. ATR units make the read comparable on any symbol and timeframe. Teal means clear room; orange means a live shelf sits within about 1 ATR. When there is no live shelf in a direction the label reads "open air".
The breakout badge. On a confirmed close that breaks the recent range, and only at the extremes, the map prints a one-word context badge: CLEAR RUNWAY when there is no live shelf within the runway band ahead, or WALLED (with the distance) when a live shelf stands within about 1 ATR of the path. Only one CLEAR RUNWAY prints per clear-air leg - no repeats while price keeps running in the same open space, and it resets once price pulls back into a shelf. It is breakout context, never a direction call.
The info panel. A compact info panel compiles the read: the structure memory in bars; Room above and Room below as ATR ranges; Price now (open air, on a live shelf, or on a fading shelf); Last breakout (the most recent badge and how many bars ago); Shelves (how many live versus fading); and a one-line Reading takeaway.
The two views (Level view).
Anchored (default): each shelf line starts at its origin diamond, shows its current live (orange) / fading (gray) state from that origin, and marks the x-cross where it broke. An anchored structure story - where structure formed, how it reads now, and where it broke if broken - not a full per-era ledger.
Zones : every live shelf drawn as a clean full-width band straight across the chart, like a supply/demand map. Instant "where are my levels right now". No origin/break markers; broken shelves drop off.
═════════════════════════════════════════
◉ HOW IT WORKS
The density field. Across the lookback window, the indicator measures how often each price level sat inside the high-low range of the lookback bars - a time-at-price-style structure read. For every bar it asks which price levels the bar's high-low range covered, and accumulates that into a density field using a difference-array method (O(L+bins) per bar) so the script stays fast even on long charts and heavy lookbacks. Price levels where many bars overlapped are dense; levels price passed through quickly are thin.
Where shelves are born. A shelf forms at a density peak whose strength clears a RELATIVE floor - it must be at least a set fraction of the strongest peak currently on the map. That relative test is self-calibrating: it adapts to each asset and regime instead of relying on a fixed tick count, so the same indicator is designed to read BTC, SPY, EURUSD and gold without constant retuning. A small absolute floor screens out noise on near-empty windows.
Data-driven width. Each shelf's band is not a fixed width. It expands outward from the peak for as long as the neighbouring density holds at least half the peak value, then is capped to a readable range in ATR units. A wide consolidation earns a wide shelf; a tight one stays thin.
Aliveness (freshness). Every shelf carries a freshness equal to an exponential decay of the bars since the band was last traded (2^(-barsSinceTouch / halfLife)). Freshness is 1 while price is in the band and halves every half-life once price leaves. Above the live threshold a shelf renders LIVE (orange); below it the shelf renders FADING (gray) and dims further until it drops off the map.
Causal lifecycle. Shelves are born on confirmed bars and never re-placed. A shelf becomes BROKEN only when price, after arming on one side with real separation, closes through to the other side - the break bar is frozen and the line continues as a faint dotted tail. The ORIGIN anchor (the earliest bar within the lookback where price actually traded that level) and the BREAK anchor are both set once and never rewritten. That frozen history is the trust element: the map cannot quietly redraw the past to look right.
═════════════════════════════════════════
✦ HOW WE USE IT
A common read on a liquid crypto or index chart, default memory: price is pushing toward the top of its recent range. The panel Room above reads "0.4 to 1.6 ATR" in orange - there is a live shelf close overhead, so the map reads the upside as walled in the near term. Room below reads "open air" - nothing live underneath. Price is sitting in open air between an overhead live shelf and abandoned structure far below.
Now price closes through the recent high. Because the nearest live shelf overhead was inside the runway band, the map prints WALLED with the distance, not CLEAR RUNWAY - the break is into immediate structure, not open space. The badge does not say the break fails; it says there is a live shelf standing in the path, which is the context a discretionary trader wants before deciding whether the move has room.
Flip the situation: a confirmed break with Room ahead reading "open air" prints CLEAR RUNWAY . In our testing, clear-runway breakouts travelled further on average than walled ones (the effect was modest and weakest on rates). That is an observation about context, not a guarantee about the next bar.
The point of the map is the same in every case: see where the live structure is, see how much clear air you have to it in ATR, and read the breakout against that structure instead of against a static line.
═════════════════════════════════════════
❖ OTHER APPLICATIONS
Trade-location context : read entries against the nearest live shelf rather than a static S/R line - the orange shelves are the structure price has interacted with most recently.
Breakout context : CLEAR RUNWAY versus WALLED on a confirmed break, as a read on whether there is open space ahead or a live shelf in the path.
Stop and target context : the room ranges in ATR give a structure-aware sense of where the nearest live shelves sit above and below, for evaluating whether planned stops or targets sit near recent structure or out in open air, instead of at round numbers.
Chop filter : many overlapping live shelves with price standing on one ("on a live shelf" in the panel) is a congested read; sustained open air is cleaner trend space.
Structure classifier : use the Shelves row (live versus fading) and Room rows as a top-down structure filter for any external trade plan, independent of the badges.
Alert-driven workflow : subscribe to the clear-runway and walled breakout alerts and check the chart only when a confirmed breakout actually changes the structural picture.
═════════════════════════════════════════
⚙ GETTING STARTED
Friction Map ships with pre-tuned memory profiles plus a Custom override. Pick a memory and start reading the map - the default Auto setting matches the chart timeframe for you.
Structure memory:
Auto (match timeframe) (default): reads the chart - 30-minute and faster get Short, everything slower gets Medium.
Short (60 bars) : about one trading day on 5m, a week on 1H. Faster-moving map.
Medium (120 bars) : about a month on 1H, six months on 1D. Balanced.
Long (240 bars) : slow, full-cycle structure.
Custom : unlocks the Advanced group for full manual control.
Core display:
Level view : Anchored (causal story, default) or Zones (clean full-width bands).
Structure shelves : master toggle for the shelf lines. On by default. Under it, three per-state toggles let you choose which states draw:
Live shelves (orange) , Fading shelves (gray) , Broken shelves (dotted) - all on by default. Turn Broken off to declutter when a level has rebuilt live on top of old broken tails.
Room boxes + labels : the price-to-nearest-live-shelf boxes and ATR range labels. On by default.
Breakout badge : CLEAR RUNWAY / WALLED context badges on confirmed breakouts. On by default.
Shelf state tags : a small LIVE / FADING / KEY LEVEL tag at the right end of each shelf. On by default; turn off for a cleaner chart once the colours are familiar.
Show real shelf width : off by default (live shelves get a thin subtle halo). On draws each live shelf at its true data-driven width as a wider transparent band.
Info panel : pick where the summary panel anchors - Top Right (default), Top Left, Bottom Right, Bottom Left, Middle Right, or Off to hide it.
Dark theme panel : panel colours for dark charts; turn off on a light background.
Level reach (bars) : how far back the shelf lines and halos draw, so old structure does not stretch across the whole chart.
Appearance / Colours (4 pickers):
Live shelf, Fading shelf, Clear air, Broken shelf - each on its own line. The shelf lines, halos, room boxes, tags and badges all reference these inputs, so the palette adapts for colour-blind, light-mode or brand themes without forking the script.
Advanced (Memory = Custom only): Custom opens on the same defaults as the Medium profile (not a live copy of whichever profile you are currently on), so coming from Medium the switch is seamless; coming from Short or Long the map steps to that baseline first. Then every dial below is yours.
Lookback (bars) : structure memory in bars. Larger = more history considered, slower-moving map.
Freshness half-life : how fast a shelf fades once the market stops trading at it. After this many bars untouched a shelf is at half freshness.
Breakout lookback : a breakout is a confirmed close that newly breaks beyond the prior N-bar high or low (a fresh cross, so a sustained trend does not re-fire it every bar).
Min strength (vs strongest) : a shelf is born only if its density is at least this fraction of the strongest peak on the map. Raise for fewer, stronger shelves.
Merge distance (ATR) : shelf candidates closer than this to an existing shelf refresh it instead of spawning a duplicate.
Max shelves : cap on simultaneously tracked (non-broken) shelves; the weakest is pruned when a stronger one is born.
Live threshold : freshness above this renders a shelf LIVE (orange).
Runway band (ATR) : how far ahead of a breakout to scan for live shelves when deciding CLEAR RUNWAY versus WALLED.
═════════════════════════════════════════
△ LIMITATIONS
Descriptive, not predictive : Friction Map shows where price spent time and how alive that structure is. It makes no claim that a shelf will hold or that a breakout will follow through. There is no buy or sell signal anywhere in the tool.
Time-at-price, not volume : the density field is built from how much of the traded range sat at each level, not from volume. That keeps the read universally stable across every asset and data feed (crypto volume is fractured by exchange, FX volume is a tick proxy), but it does not weight a busy bar more than a quiet one.
Backward-looking by construction : in fast moves and gaps, room can jump to "open air" quickly as price leaps into untraded territory. That is accurate but may not persist.
Room measures to LIVE shelves only : the room ranges and the badge ignore fading shelves on purpose - the room read focuses on the current (orange) structure. A fading shelf still shows on the chart as a gray line; it just is not counted as room.
The breakout effect is context, not edge : in testing, clear-runway breakouts travelled further than walled ones on average, but the difference was modest and weakest on rates. Treat the badge as context to read alongside your own plan, not as a validated signal.
Recency fade : a structurally important level that has not been traded in a long time will fade from the map even if you still consider it important. Lengthen the memory or half-life if you want older structure to persist.
═════════════════════════════════════════
🔔 ALERTS
Two alert conditions are built in so you can monitor structure without watching every bar:
Clear-runway breakout : a confirmed breakout into clear air (no live shelf within the runway band ahead).
Walled breakout : a confirmed breakout into nearby live structure (a live shelf within about 1 ATR of the path).
Both fire on bar close (gated on `barstate.isconfirmed`) - no intrabar repaint. The indicator also emits a richer alert with a pure-JSON payload for routing to your own automation or webhook stack. The payload carries the brand, the indicator name, the event, the direction, the up and down clearance in ATR, the current price, the ticker, the timeframe and the bar time (the clearance fields are sent as text and read "open" when there is no live shelf that way). Pick ONE mechanism per event - the dropdown alert condition for a simple notification, or the JSON alert for a webhook - so you do not get duplicate notifications. Badges and alerts fire even when the on-chart badge is toggled off; alerts should not require chart clutter.
═════════════════════════════════════════
⌁ NOTES
Built on a containment-count density field (time-at-price), with data-driven band width, exponential freshness decay, and a causal frozen lifecycle (origin and break anchors set once and never moved).
Method lineage: the density field is a time-at-price construction, in the tradition of Market Profile (J. Peter Steidlmayer, popularised at the CBOT in the 1980s), which reads structure from where the market spent time rather than from volume. Friction Map adds the freshness decay and the causal live/fading/broken lifecycle on top of that classical time-at-price idea.
Repaint: non-repainting on confirmed bars. Births, breaks, clearance, badges and alerts are computed on bar close; the current bar updates in real time. Live/fading colour reflects current state, so a re-traded faded shelf can re-colour live - no past origin or break anchor is ever changed.
Original construction. The engine is built from first principles for this tool; there is no external reference implementation, so no validation-correlation claim is made.
Open-source under MPL 2.0. Free to use, fork, study.
NovaLens Indicateur

Volatility Reversion Bands Pro [JOAT]VOLATILITY REVERSION BANDS PRO
A two-layer reversion envelope: inner Bollinger band for the normal volatility envelope, outer ATR-extended band for the extreme envelope. Signals only fire when price has reached the outer ring — the inner band is context, the outer band is the trigger. The result is a clean mean-reversion engine that respects the difference between "stretched" and "actually stretched".
Two envelopes, one principle
Inner band — classic Bollinger: basis (SMA or EMA) ± stdev × multiplier. The familiar 20-period, 2-sigma defaults are preserved.
Outer reversion band — the outer envelope extends inner band ± ATR × multiplier . This is the band that triggers signals. Setting the ATR multiplier high makes signals rarer but deeper; setting it low makes them frequent and shallower.
Reversion bands using stdev alone collapse in low-volatility regimes (too many false signals) and explode in high-volatility regimes (signals come too late). The ATR extension on top of stdev fixes both: ATR adds a constant-floor protection in quiet markets and scales the outer band proportionally in loud ones.
Strong vs weak signals
Two signal tiers from a single channel-ratio read (close position within the outer band, normalised 0–1):
Strong signals — fire on the outer band itself (ratio ≤ 0 or ≥ 1). The high-conviction reversion read.
Weak signals — fire when ratio reaches a configurable near-band threshold (default 0.10 / 0.90). The "approaching outer band" read — useful for traders who want earlier hints. Easily disabled.
A signal cooldown suppresses same-side repetition; an exhaustion arrow prints when N consecutive bars (default 3) all live in the outer-band zone — a configurable escalating-glyph string ("^", "^^", "^^^"…) makes the run length visible at a glance.
Volatility regime classification
Independent of signals, the script classifies the current volatility regime by comparing current stdev to its own rolling average over a long lookback (default 100 bars):
Low regime — stdev / avgStdev below the low threshold (default 1.0×). Reversion is more reliable here.
High regime — above the high threshold (default 2.0×). Reversion is less reliable here; trends become dominant.
Normal regime — in between. Default mode.
Background tinting (toggleable, transparency-controlled) paints the chart by regime so the trader can see at a glance whether the current environment is suitable for reversion. This is the "do not fight the tape" filter — when the background is hot, every reversion signal is lower-conviction by definition.
Visual system
Bar gradient — bars are coloured by their position-in-band ratio (bull → mid → bear via plasma palette). At a glance you can see where price is sitting in the channel without reading the value.
Inner band fill — toggleable shoulder fill between BB and outer reversal bands with configurable transparency.
Inner BB lines and basis line are each independently toggleable for traders who want a minimalist or full envelope view.
Signal label style — Glyph (compact), Text (verbose), or Both.
A locked Plasma palette (yellow bull, magenta bear, violet mid) on a deep-void background gives the chart a distinctive look without competing with price action.
Dashboard
Monospaced table, positionable to any of nine corners, with togglable legend footer. Rows surface current basis, inner band values, outer reversion band values, channel ratio %, stdev / avgStdev ratio, regime label, last signal direction with age, and an exhaustion run counter.
Alerts
Four alert conditions, each independently controllable:
Strong Long / Short (outer band touch reversion)
Weak Long / Short (near-band threshold)
Vol Regime Change
Exhaustion Arrow (consecutive bars in outer-band zone)
How to read it
Two reads, in order of conviction:
Strong signal in a Low or Normal regime — the script's intended sweet spot. The outer band has been touched, price is statistically far from its mean, and the volatility environment supports the idea of mean-reversion.
Exhaustion arrow — when 3+ bars sit in the outer band, you usually have either a genuine breakout (the bands themselves will start to expand) or an exhaustion (the next reversal candle will be the signal). Either way, the next move is meaningful.
In a High regime, treat strong signals as cautionary at best — the bars are coloured by ratio for a reason; the gradient will tell you when one side is dominating.
Suggested settings
Defaults (length 20, stdev mult 2.0, ATR mult 1.5) are tuned to 1H–4H on liquid markets — the classical Bollinger settings plus a 1.5-ATR outer cushion. For 5m–15m, drop length to 14 and ATR multiplier to 1.0. For daily and above, raise length to 50 and ATR multiplier to 2.0. The regime thresholds (low 1.0×, high 2.0× of the long-run stdev average) are conservative — tighten the bands if your instrument is unusually quiet.
Originality / what's reused
Bollinger Bands and ATR are public-domain primitives. The implementation — the outer-band = inner-band ± ATR construction, the channel-ratio bar gradient, the regime classifier with auto-tinted background, the exhaustion-arrow consecutive-bar run logic, the weak/strong signal tiering, and the dashboard's monospaced regime-aware layout — is JOAT-original and tuned together. No third-party code reused.
Open source
Published open-source under the default Mozilla Public License 2.0. Section-headed source, tooltips on every input, helper functions documented inline. The band engine, the regime classifier, the exhaustion logic, and the dashboard are independent modules — fork or extend any single one without reading the whole file.
Limitations
Reversion bands are a counter-trend tool by construction. In sustained one-sided moves the outer band will be repeatedly touched without producing a profitable reversion — the High regime tint and the exhaustion-arrow run logic both exist to warn you when you are in this state. Signals are confirmed on bar close (non-repainting), so an intra-bar wick into the outer band that gets reabsorbed will not fire.
—
-made with passion by jackofalltrades
Indicateur

Dynamic Volatility Filter [QuantAlgo]🟢 Overview
Dynamic Volatility Filter is a trend-following indicator built on an adaptive volatility threshold rather than fixed bands or moving average crossovers. It quantifies the realized volatility of recent price movement to establish a dynamic noise floor that price must overcome before the line responds, anchoring a filtered trend line that only shifts when a directional move exceeds the prevailing volatility regime, helping traders separate statistically significant trend change from noise-driven fluctuation across every timeframe and market.
🟢 How It Works
The foundation of the indicator is a rolling volatility estimate derived from the Average True Range over a configurable lookback window, scaled by a noise multiplier to produce the threshold used in all line logic:
threshold = ta.atr(lookback) * noise_mult
This threshold functions as a deviation barrier the line will not cross until price movement breaches it. On each bar the filter measures the displacement between price and the current line position, and only when that displacement exceeds the volatility threshold does the line update:
float diff = src - dvf_line
if math.abs(diff) > threshold
dvf_line := dvf_line + diff * snap_speed
The line remains stationary through movement that falls within the volatility envelope and only commits once displacement clears the threshold. Rather than converging directly onto price, the line advances by a fraction of the residual distance governed by the catch-up coefficient, producing a damped response instead of an instantaneous one. Lower catch-up values introduce deliberate lag that requires a move to persist before the line follows, while higher values tighten the track to price.
Direction state is derived from the line's own first difference, comparing its current position against the prior bar:
if dvf_line > dvf_line
trend_dir := 1
else if dvf_line < dvf_line
trend_dir := -1
Because the line holds flat whenever displacement stays inside the threshold, those periods register no direction change. With Show Neutral enabled the state resets to neutral during these pauses, and with it disabled the line retains its last directional reading until the next threshold breach.
🟢 Signal Interpretation
▶ Bullish Trend (Green): When the filter line registers positive displacement against its prior position, the indicator enters bullish mode with green coloring applied across the line, gradient fill, and volatility bands. This state persists through pullbacks contained within the threshold, since direction only updates when the line moves. The transition into green marks a potential long/buy opportunity, with pullbacks toward the line during an established bullish reading offering potential continuation entries.
▶ Bearish Trend (Red): When the filter line registers negative displacement against its prior position, the indicator enters bearish mode with red coloring across all visual elements. The reading holds bearish until price clears the volatility threshold in the opposite direction. The transition into red marks a potential short/sell opportunity, with rallies back toward the line during an established bearish reading offering potential continuation entries on the downside.
▶ Neutral (Gray): When Show Neutral is enabled, the line and fills turn gray during flat stretches where price stays inside the threshold and the line holds still. This state signals an absence of confirmed direction and is best treated as a stand-aside condition, where waiting for the line to commit back to green or red avoids entering during indecisive, range-bound conditions.
🟢 Features
▶ Preconfigured Presets: Three parameter sets cover different trading approaches. "Default" targets swing trading on 4-hour and daily charts with a balanced threshold that filters moderate noise while staying responsive to genuine regime shifts. "Fast Response" lowers the volatility barrier and shortens the lookback for intraday charts where the line needs to adapt to shorter-duration moves. "Smooth Trend" raises the threshold and slows the catch-up for position trading on daily and weekly timeframes, where the cost of a false flip exceeds the cost of a delayed one. Selecting a preset overrides the individual noise, period, and catch-up inputs.
▶ Built-in Alerts: Three alert conditions cover all directional states. "Bullish Trend Signal" fires on the bar where the trend confirms bullish. "Bearish Trend Signal" fires on the bar where it confirms bearish. "Any Trend Change" combines both into a single condition for traders who want a unified notification regardless of direction.
▶ Visual Customization: Six color presets (Classic, Aqua, Cosmic, Cyber, Neon, and Custom) apply coordinated bullish and bearish color schemes across the line, gradient fill, volatility bands, and optional bar and background coloring. The volatility bands plot one threshold above and below the line to frame the deviation envelope price must breach, and can be hidden for a clean line-only view. Bar coloring tints price candles with the active trend color at a configurable transparency level, and background coloring extends the directional tint across the full chart pane. Both are disabled by default and controlled independently.
*Recommendation: Layer the Dynamic Volatility Filter with complementary analysis rather than treating it as a standalone decision tool. Combine direction changes with volume context, since expanding volume on a flip bar suggests the move has broader participation behind it, and read transitions against key structural levels, as a flip occurring near major support or resistance carries more weight than one in open space. Pairing this script with volume, open interest, CVD, market structure, and mean reversion indicators from our QuantAlgo toolkit can further validate directional bias before entry. Indicateur

Adaptive Baseline Suite | NAL1. Overview
Adaptive Baseline Suite | NAL is a multi-baseline trend indicator that compares price against five different adaptive baseline systems. Instead of relying on one smoothing method, it builds separate volatility bands around a Kijun Sen, DEMA, Median, Laguerre Filter, and Gaussian Filter.
Each baseline produces its own bullish or bearish state. These states are then averaged into a final TPI-style score, giving a broader view of whether price is generally trading above or below its adaptive baseline structure.
2. Calculation
The indicator starts by calculating five independent baselines:
baseline_1 = math.avg(ta.lowest(baseline1i), ta.highest(baseline1i))
baseline_2 = ta.dema(source, baseline2i)
baseline_3 = ta.median(source, baseline3i)
baseline_4 = f_laguerre(source, baseline4i)
baseline_5 = gaussianFilter(source, baseline5i, baseline5is)
Each baseline represents a different way of defining the market’s fair-value zone. The Kijun Sen captures midpoint structure, DEMA reacts faster to trend changes, Median reduces noise, Laguerre smooths price recursively, and the Gaussian Filter applies weighted smoothing around a bell-curve distribution.
After the baselines are created, volatility bands are calculated around each one. The indicator measures the residual between price and the baseline, then applies a MAD (Mean aggregate deviation) volatility estimate:
residual = srcPrice - srcBase
_mad = ta.sma(math.abs(residual - ta.sma(residual, volLen)), volLen) * 1.4826
volatility = volSmooth > 1 ? ta.ema(_mad, volSmooth) : _mad
upper = srcBase + volatility * mult
lower = srcBase - volatility * mult
This creates adaptive upper and lower bands around every baseline. A bullish state triggers when price closes above the upper band. A bearish state triggers when price closes below the lower band.
Each baseline receives a score:
score := close > upper_band ? 1 : close < lower_band ? -1 : score
The five scores are then averaged into the final output:
tpi_score = math.avg(score_1, score_2, score_3, score_4, score_5)
A positive final score means most baselines are in bullish expansion. A negative score means most baselines are in bearish expansion.
3. Key Features
Multi-baseline trend model using five different smoothing structures.
Adaptive volatility bands based on residual MAD-style volatility.
Final TPI-style score showing the average bullish or bearish state.
Optional plotting for each baseline’s upper and lower bands.
Candle coloring and histogram visualization for quick regime identification.
4. Use
Use it to identify when price is breaking away from several adaptive baseline models at the same time. A positive score suggests price is trading above the majority of its volatility-adjusted baselines, indicating bullish expansion. A negative score suggests price is trading below the majority of its baselines, indicating bearish expansion.
The individual baseline plots can be enabled when you want to inspect which smoothing model is driving the signal. When most baseline scores agree, the final score becomes more decisive. When the score is mixed or near zero, price is usually inside its adaptive fair-value zone and has not confirmed a clear directional regime. Indicateur