Stratégie

Indicateur

Indicateur

[SK] Custom Klinger OscillatorThis Custom Klinger Oscillator allows you to change the time frames for the Force Volume and Signal calculations to use instead of it's default values. Although the default Fibonacci values ( 34, 55 and 13 ) provide exceptional signals, you can now explore using lower Fibonacci numbers and get faster signals for your own adventures in the market.
This indicator adds conditional coloring of the Klinger line when over / under the signal along with a transparent fill cloud between both lines colored by the same condition. You can change colors to your preference on the style configurations.
--
Below is more information on the KIinger Oscillator from investopedia:
Interpretations for Price Direction
The Klinger Oscillator is fairly complex to calculate, but it's based on the idea of force volume, which accounts for volume, trend (positive or negative), and temp (based on multiple inputs and if/then statements). Using this data, the oscillator is created by looking at the difference between two exponential moving averages of force volume involving different time frames (typically 34 and 55). The idea is to show how the volume flowing through the securities is impacting its long-term and short-term price direction.
The Signal Line
A signal line (13-period moving average) is used to trigger buy or sell signals. This technique is very similar to signals that are created with other indicators such as the moving average convergence divergence (MACD). While these are the basic signals generated by these indicators, it's important to note that these techniques may generate a lot of trading signals that may not be as effective in sideways markets.
The Uptrend
When an asset is in an overall uptrend—such as when it is above its 100-period moving average and the Klinger is above zero or moving above zero—traders could buy when the Klinger oscillator moves above the signal line from below.
Klinger noted that when a stock was in an uptrend, and then dropped to unusually low levels below zero, and then moved above its signal line, this was a favorable long position to take.
The Downtrend
When an asset is in an overall downtrend, traders could sell or short-sell when the Klinger oscillator moves below the signal line from above. Klinger noted this was especially noteworthy when the indicator had seen an uncharacteristic spike above zero.
The zero line is also used by some traders to mark the transition from an uptrend to downtrend, or vice versa. While such signals won't always agree with price movements, a move above zero helps confirm a rising price, while a drop below zero helps confirm a falling price.
Klinger Oscillator and Divergence
The Klinger oscillator also uses divergence to identify when the indicator's inputs are not confirming the direction of the price move. It's a bullish sign when the value of the indicator is heading upward while the price of the security continues to fall. It is a bearish signal when the price is rising but the indicator is falling. Divergence can be coupled with signal line crossovers to generate trades. For example, if a bearish divergence forms, a sell or short-sell could be initiated the next time the Klinger crosses below the signal line. Indicateur

Indicateur

Indicateur

Indicateur
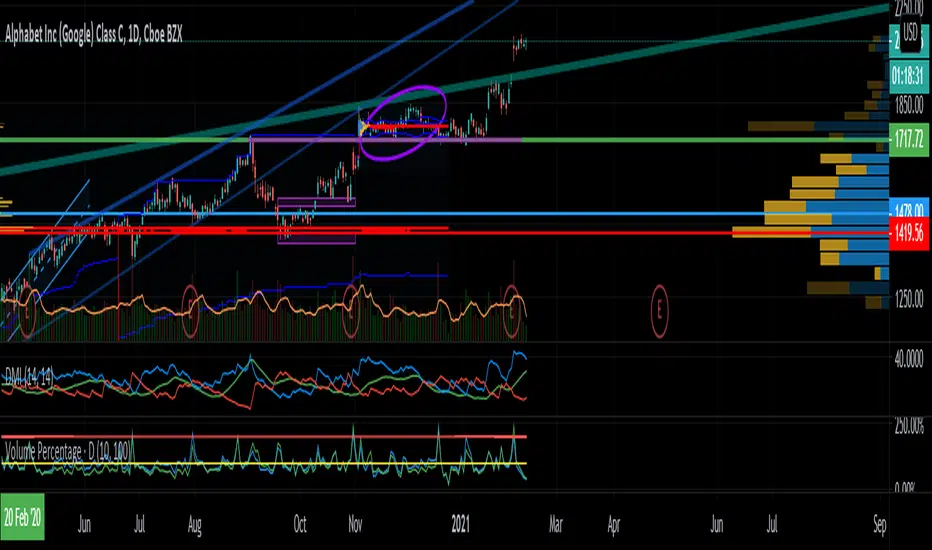
Volume Profile per day with support/resistance linesThis indicator shows the volume profile by daily blocks and draws on the chart the support or resistance lines produced by the previous volume profile block. A support line will be created if in the previous block, the VPOC line was closer to the lowest price line of that block. This support line will be placed below the VPOC line, at a distance equal to the difference between the highest price of that block and the VPOC price. For the case of the resistance line, the logic applied is analogous.
These support and resistance lines are introduced because, according to the Gaussian bell, the VPOC is likely to be located in the middle, and these deviations can be used to trace support and resistance.
In addition, the indicator includes the following features:
- Change the colors of all plotted lines.
- Define the number of daily blocks to be displayed.
- Define the resolution when calculating the volume of each candle.
- Define the number of support/resistance lines to be displayed.
- Highest and lowest price lines, as well as vpoc line, volume histogram and support and resistance lines.
- Display or not, the vpoc line and the volume histogram.
The calculations performed by the script improve if the candles used are of a lower timeframe. This indicator has been tested in several markets, including cryptos, CFDs, Forex and Indices. Indicateur

Indicateur

Indicateur

Stratégie

Indicateur

Indicateur

Indicateur
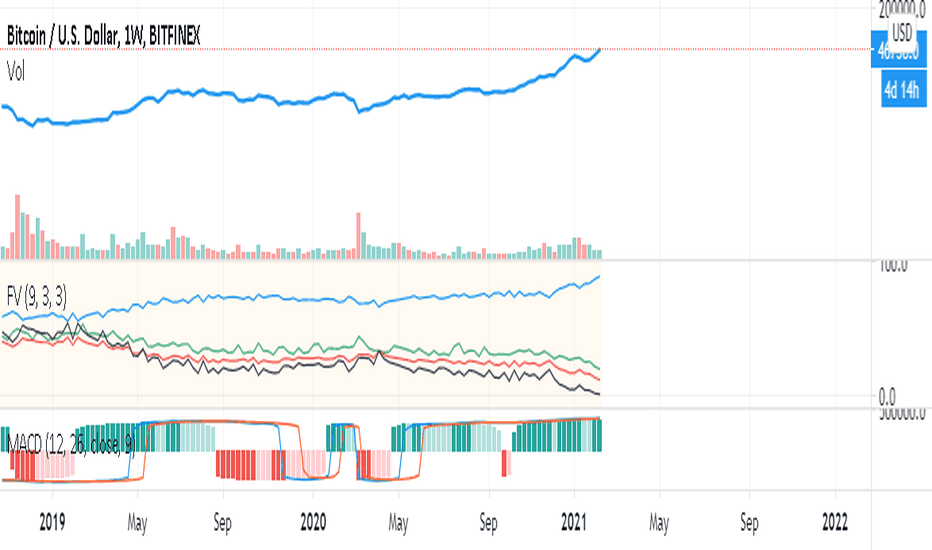
On Balance Volume FieldsThe On Balance Volume (OBV) indicator was developed by Joseph E. Granville and published first in his book "New key to stock market profits" in 1963. It uses volume to determine momentum of an asset. The base concept of OBV is - in simple terms - you take a running total of the volume and either add or subtract the current timeframe volume if the market goes up or down. The simplest use cases only use the line build that way to confirm direction of price, but the possibilities and applications of OBV go far beyond that and are (at least to my knowledge) not found in existing indicators available on this platform.
If you are interested to get a deeper understanding of OBV, I recommend the lecture of the above mentioned book by Granville. All the features described below are taken directly from the book or are inspired by it (deviations will be marked accordingly). If you have no prior experience with OBV, I recommend to start simple and read an easy introduction (e.g. On-Balance Volume (OBV) Definition from Investopedia) and start applying the basic concepts first before heading into the more advanced analysis of OBV fields and trends.
Markets and Timeframes
As the OBV is "just" a momentum indicator, it should be applicable to any market and timeframe.
As a long term investor, my experience is limited to the longer timeframes (primarily daily), which is also how Granville applies it. But that is most likely due to the time it was developed and the lack of lower timeframe data at that point in time. I don't see why it wouldn't be applicable to any timeframe, but cannot speak from experience here so do your own research and let me know. Likewise, I invest in the crypto markets almost exclusively and hence this is where my experience with this indicator comes from.
Feature List
As a general note before starting into the description of the individual features: I use the colors and values of the default settings of the indicator to describe it. The general look and feel obviously can be customized (and I highly recommend doing so, as this is a very visual representation of volume, and it should suit your way of looking at a chart) and I also tried to make the individual features as customizable as possible.
Also, all additions to the OBV itself can be turned off so that you're left with just the OBV line (although if that's what you want, I recommend a version of the indicator with less overhead).
Fields
Fields are defined as successive UPs or DOWNs on the OBV. An UP is any OBV reading above the last high pivot and subsequently a DOWN is any reading below the last low pivot. An UP-field is the time from the first UP after a DOWN-field to the first DOWN (not including). The same goes for a DOWN field but vice versa.
The field serves the same purpose as the OBV itself. To indicate momentum direction. I haven't found much use for the fields themselves other than serving as a more smoothed view on the current momentum. The real power of the fields emerges when starting to determine larger trends of off them (as you will see soon).
Therefor the fields are displayed on the indicator as background colors (UP = green, DOWN = red), but only very faint to not distract too much from the other parts of the indicator.
Major Volume Trend
The major volume trend - from which Granville says, it's the one that tends to precede price - is determined as the succession of the highest highs and lowest lows of UP and DOWN fields. It is represented by the colors of the numbers printed on the highs and lows of the fields.
The trend to be "Rising" is defined as the highest high of an UP field being higher than the highest high of the last UP field and the lowest low of the last DOWN field being higher than the lowest low of the prior DOWN field. And vice versa for a "Falling" trend. If the trend does not have a rising or falling pattern, it is said to be "Doubtful". The colors are indicated as follows:
Rising = green
Falling = red
Doubtful = blue
ZigZag Swing count
The swing count is determined by counting the number of swings within a trend (as described above) and is represented by the numbers above the highs and lows of the fields. It determines the length and thus strength of a trend.
In general there are two ways to determine the count. The first one is by counting the swings between pivots and the second one by counting the swings between highs and lows of fields. This indicator represents the SECOND one as it represents the longer term trend (which I'm more interested in as it denotes a longer term perspective).
However, the ZigZag count has three applications on the OBV. The "simple ZigZag" is a count of three swings which mainly tells you that the shorter term momentum of the market has changed and the current trend is weakening. This doesn't mean it will reverse. A count of three downs is still healthy if it occurs on a strong uptrend (and vice versa) and it should primarily serve as a sign of caution. If the count increases beyond three, the last trend is weakening considerably, and you should probably take action.
The second count to look out for is five swings - the "compound ZigZag". If this goes hand in hand with breaking a major support/resistance on the OBV it can offer a buying/selling opportunity in the direction of the trend. Otherwise, there's a good chance that this is a reversal signal.
The third count is nine. To quote Granville directly: "there is a very strong tendency FOR MAJOR REVERSAL OF REND AFTER THE NINTH SWING" (emphasis by the author). This is something I look out for and get cautious about, although I have found signal to be weak in an overextended market. I have observed counts of 10 and even 12 which did not result in a major reversal and the market trended further after a short period of time. This is still a major sign of caution and should not be taken lightly.
Moving average
Although Granville talks only briefly about averages and the only mention of a specific one is the 10MA, I found moving averages to be a very valuable addition to my analysis of the OBV movements.
The indicator uses three Exponential Moving Averages. A long term one to determine the general direction and two short term ones to determine the momentum of the trend. Especially for the latter two, keep in mind that those are very indirect as they are indicators of an indicator anyway and I they should not necessarily be used as support or resistance (although that might sometimes be helpful). I recommend paying most attention to the longterm average as I've found it to be very accurate when determining the longterm trend of a market (even better than the same indicator on the price).
If the OBV is above the long term average, the space between OBV and average is filled green and filled red if below. The colors and defaults for the averages are:
long term, 144EMA, green
short term 1, 21EMA, blue
short term 2, 55EMA, red
Divergences
This is a very rudimentary adaption of the standard TradingView "Divergence Indicator". I find it helpful to have these on the radar, but do not actively use them (as in having a strategy based on OBV/price divergence). This is something that I would eventually pick up in a later version of the indicator if there is any demand for it, or I find the time to look into strategies based on this.
Comparison line
A small but very helpful addition to the indicator is a horizontal line that traces the current OBV value in real time, which makes it very easy to compare the current value of the OBV to historic values (which is a study I can highly recommend). Indicateur

Indicateur
Indicateur

Indicateur

Indicateur

Waindrops [Makit0]█ OVERALL
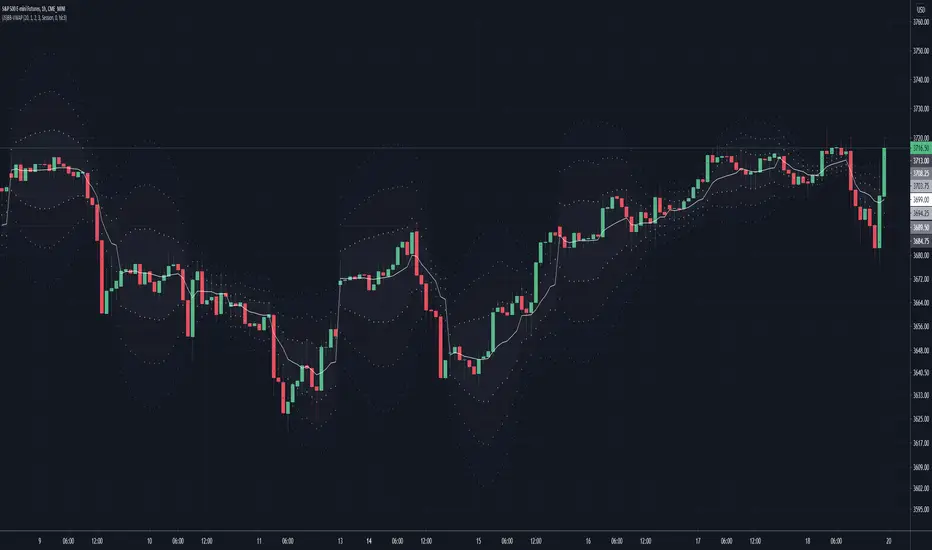
Plot waindrops (custom volume profiles) on user defined periods, for each period you get high and low, it slices each period in half to get independent vwap, volume profile and the volume traded per price at each half.
It works on intraday charts only, up to 720m (12H). It can plot balanced or unbalanced waindrops, and volume profiles up to 24H sessions.
As example you can setup unbalanced periods to get independent volume profiles for the overnight and cash sessions on the futures market, or 24H periods to get the full session volume profile of EURUSD
The purpose of this indicator is twofold:
1 — from a Chartist point of view, to have an indicator which displays the volume in a more readable way
2 — from a Pine Coder point of view, to have an example of use for two very powerful tools on Pine Script:
• the recently updated drawing limit to 500 (from 50)
• the recently ability to use drawings arrays (lines and labels)
If you are new to Pine Script and you are learning how to code, I hope you read all the code and comments on this indicator, all is designed for you,
the variables and functions names, the sometimes too big explanations, the overall structure of the code, all is intended as an example on how to code
in Pine Script a specific indicator from a very good specification in form of white paper
If you wanna learn Pine Script form scratch just start HERE
In case you have any kind of problem with Pine Script please use some of the awesome resources at our disposal: USRMAN , REFMAN , AWESOMENESS , MAGIC
█ FEATURES
Waindrops are a different way of seeing the volume and price plotted in a chart, its a volume profile indicator where you can see the volume of each price level
plotted as a vertical histogram for each half of a custom period. By default the period is 60 so it plots an independent volume profile each 30m
You can think of each waindrop as an user defined candlestick or bar with four key values:
• high of the period
• low of the period
• left vwap (volume weighted average price of the first half period)
• right vwap (volume weighted average price of the second half period)
The waindrop can have 3 different colors (configurable by the user):
• GREEN: when the right vwap is higher than the left vwap (bullish sentiment )
• RED: when the right vwap is lower than the left vwap (bearish sentiment )
• BLUE: when the right vwap is equal than the left vwap ( neutral sentiment )
KEY FEATURES
• Help menu
• Custom periods
• Central bars
• Left/Right VWAPs
• Custom central bars and vwaps: color and pixels
• Highly configurable volume histogram: execution window, ticks, pixels, color, update frequency and fine tuning the neutral meaning
• Volume labels with custom size and color
• Tracking price dot to be able to see the current price when you hide your default candlesticks or bars
█ SETTINGS
Click here or set any impar period to see the HELP INFO : show the HELP INFO, if it is activated the indicator will not plot
PERIOD SIZE (max 2880 min) : waindrop size in minutes, default 60, max 2880 to allow the first half of a 48H period as a full session volume profile
BARS : show the central and vwap bars, default true
Central bars : show the central bars, default true
VWAP bars : show the left and right vwap bars, default true
Bars pixels : width of the bars in pixels, default 2
Bars color mode : bars color behavior
• BARS : gets the color from the 'Bars color' option on the settings panel
• HISTOGRAM : gets the color from the Bearish/Bullish/Neutral Histogram color options from the settings panel
Bars color : color for the central and vwap bars, default white
HISTOGRAM show the volume histogram, default true
Execution window (x24H) : last 24H periods where the volume funcionality will be plotted, default 5
Ticks per bar (max 50) : width in ticks of each histogram bar, default 2
Updates per period : number of times the histogram will update
• ONE : update at the last bar of the period
• TWO : update at the last bar of each half period
• FOUR : slice the period in 4 quarters and updates at the last bar of each of them
• EACH BAR : updates at the close of each bar
Pixels per bar : width in pixels of each histogram bar, default 4
Neutral Treshold (ticks) : delta in ticks between left and right vwaps to identify a waindrop as neutral, default 0
Bearish Histogram color : histogram color when right vwap is lower than left vwap, default red
Bullish Histogram color : histogram color when right vwap is higher than left vwap, default green
Neutral Histogram color : histogram color when the delta between right and left vwaps is equal or lower than the Neutral treshold, default blue
VOLUME LABELS : show volume labels
Volume labels color : color for the volume labels, default white
Volume Labels size : text size for the volume labels, choose between AUTO, TINY, SMALL, NORMAL or LARGE, default TINY
TRACK PRICE : show a yellow ball tracking the last price, default true
█ LIMITS
This indicator only works on intraday charts (minutes only) up to 12H (720m), the lower chart timeframe you can use is 1m
This indicator needs price, time and volume to work, it will not work on an index (there is no volume), the execution will not be allowed
The histogram (volume profile) can be plotted on 24H sessions as limit but you can plot several 24H sessions
█ ERRORS AND PERFORMANCE
Depending on the choosed settings, the script performance will be highly affected and it will experience errors
Two of the more common errors it can throw are:
• Calculation takes too long to execute
• Loop takes too long
The indicator performance is highly related to the underlying volatility (tick wise), the script takes each candlestick or bar and for each tick in it stores the price and volume, if the ticker in your chart has thousands and thousands of ticks per bar the indicator will throw an error for sure, it can not calculate in time such amount of ticks.
What all of that means? Simply put, this will throw error on the BITCOIN pair BTCUSD (high volatility with tick size 0.01) because it has too many ticks per bar, but lucky you it will work just fine on the futures contract BTC1! (tick size 5) because it has a lot less ticks per bar
There are some options you can fine tune to boost the script performance, the more demanding option in terms of resources consumption is Updates per period , by default is maxed out so lowering this setting will improve the performance in a high way.
If you wanna know more about how to improve the script performance, read the HELP INFO accessible from the settings panel
█ HOW-TO SETUP
The basic parameters to adjust are Period size , Ticks per bar and Pixels per bar
• Period size is the main setting, defines the waindrop size, to get a better looking histogram set bigger period and smaller chart timeframe
• Ticks per bar is the tricky one, adjust it differently for each underlying (ticker) volatility wise, for some you will need a low value, for others a high one.
To get a more accurate histogram set it as lower as you can (min value is 1)
• Pixels per bar allows you to adjust the width of each histogram bar, with it you can adjust the blank space between them or allow overlaping
You must play with these three parameters until you obtain the desired histogram: smoother, sharper, etc...
These are some of the different kind of charts you can setup thru the settings:
• Balanced Waindrops (default): charts with waindrops where the two halfs are of same size.
This is the default chart, just select a period (30m, 60m, 120m, 240m, pick your poison), adjust the histogram ticks and pixels and watch
• Unbalanced Waindrops: chart with waindrops where the two halfs are of different sizes.
Do you trade futures and want to plot a waindrop with the first half for the overnight session and the second half for the cash session? you got it;
just adjust the period to 1860 for any CME ticker (like ES1! for example) adjust the histogram ticks and pixels and watch
• Full Session Volume Profile: chart with waindrops where only the first half plots.
Do you use Volume profile to analize the market? Lucky you, now you can trick this one to plot it, just try a period of 780 on SPY, 2760 on ES1!, or 2880 on EURUSD
remember to adjust the histogram ticks and pixels for each underlying
• Only Bars: charts with only central and vwap bars plotted, simply deactivate the histogram and volume labels
• Only Histogram: charts with only the histogram plotted (volume profile charts), simply deactivate the bars and volume labels
• Only Volume: charts with only the raw volume numbers plotted, simply deactivate the bars and histogram
If you wanna know more about custom full session periods for different asset classes, read the HELP INFO accessible from the settings panel
EXAMPLES
Full Session Volume Profile on MES 5m chart:
Full Session Unbalanced Waindrop on MNQ 2m chart (left side Overnight session, right side Cash Session):
The following examples will have the exact same charts but on four different tickers representing a futures contract, a forex pair, an etf and a stock.
We are doing this to be able to see the different parameters we need for plotting the same kind of chart on different assets
The chart composition is as follows:
• Left side: Volume Labels chart (period 10)
• Upper Right side: Waindrops (period 60)
• Lower Right side: Full Session Volume Profile
The first example will specify the main parameters, the rest of the charts will have only the differences
MES :
• Left: Period size: 10, Bars: uncheck, Histogram: uncheck, Execution window: 1, Ticks per bar: 2, Updates per period: EACH BAR,
Pixels per bar: 4, Volume labels: check, Track price: check
• Upper Right: Period size: 60, Bars: check, Bars color mode: HISTOGRAM, Histogram: check, Execution window: 2, Ticks per bar: 2,
Updates per period: EACH BAR, Pixels per bar: 4, Volume labels: uncheck, Track price: check
• Lower Right: Period size: 2760, Bars: uncheck, Histogram: check, Execution window: 1, Ticks per bar: 1, Updates per period: EACH BAR,
Pixels per bar: 2, Volume labels: uncheck, Track price: check
EURUSD :
• Upper Right: Ticks per bar: 10
• Lower Right: Period size: 2880, Ticks per bar: 1, Pixels per bar: 1
SPY :
• Left: Ticks per bar: 3
• Upper Right: Ticks per bar: 5, Pixels per bar: 3
• Lower Right: Period size: 780, Ticks per bar: 2, Pixels per bar: 2
AAPL :
• Left: Ticks per bar: 2
• Upper Right: Ticks per bar: 6, Pixels per bar: 3
• Lower Right: Period size: 780, Ticks per bar: 1, Pixels per bar: 2
█ THANKS TO
PineCoders for all they do, all the tools and help they provide and their involvement in making a better community
scarf for the idea of coding a waindrops like indicator, I did not know something like that existed at all
All the Pine Coders, Pine Pros and Pine Wizards, people who share their work and knowledge for the sake of it and helping others, I'm very grateful indeed
I'm learning at each step of the way from you all, thanks for this awesome community;
Opensource and shared knowledge: this is the way! (said with canned voice from inside my helmet :D)
█ NOTE
This description was formatted following THIS guidelines
═════════════════════════════════════════════════════════════════════════
I sincerely hope you enjoy reading and using this work as much as I enjoyed developing it :D
GOOD LUCK AND HAPPY TRADING! Indicateur

Indicateur
Indicateur
Anti-Volume Stop LossFINALLY!
As everyone who tried to create, understand, or even find the Buff Pelz Dormeier Anti-volume stop-loss indicator knows that - it's not easy. Personally, I have partially, or perhaps completely figured out, the tips Buff had given in Investing with Volume Analysis book.
AVSL now is ready.
Please do some test and give me a feedback how it works in your trade strategy.
Anti-Volume stop loss - AVSL
from Investing with Volume Analysis book CHAPTER 20 • RISKY BUSINESS 253-256:
"It is important in any risk-management process to predetermine an objective decision point level (a stop loss) to exit, thereby protecting principal in case you are wrong. My objective sell point is determined by using a quantitative formula I refer to as Anti-Volume Stop Loss (AVSL). Having a quantitative, yet intelligent sell point eliminates the emotional struggles involved in deciding when to exit a position.
AVSL is a technical methodology that incorporates the concepts of support, volatility, and, most importantly, the inverse relationship between price and volume. The AVSL combines the concepts of the VPCI (Volume Price Confirmation Indicator) and John Bollinger’s Bollinger Bands to create a trailing stop loss.
AVSL = Lower Bollinger Band – (Price, Length, Standard Deviation)
Where:
Length = Round (3 + VPCI)
Price = Average (Lows × 1 / VPC × 1 / VPR, Length)
Standard Deviation = 2 × (VPCI × VM)
One of the most difficult decisions is determining what one’s maximum loss threshold should be. Some say 2 percent; others say 20 percent. I believe the more volatile a security, the looser the stop should be. A nonvolatile security, such as Coca-Cola, might move 7 percent a year, while a volatile security such as Google might move 7 percent in a day. If you use a 7 percent stop for Coca-Cola, it might take a year to be stopped out while the security underperforms.
However, if you use 7 percent for Google, you can be stopped out intraday, not allowing the investment an opportunity to develop. By using the lower Bollinger Band of the securities lows, the AVSL considers each individual security’s own volatility. Thus, a volatile security would be granted more room of the stocks low while a stable security would have a tighter leash (see Figure 20.7).
The next important step is employing the price-volume relationship into the calculation. Volume gauges the power behind price moves. In accounting for this, when a security is in an uptrend and has positive volume characteristics, it is given more room. However, if the security exhibits contracting volume characteristics, then the stop is tightened. In this way, if a negative news event affects an unhealthy security, the stop is tighter, thus preserving more of your profits.
However, if the negative news event affects a security whose price-volume relationship is healthy, the stop has been loosened, avoiding the temporary whipsaw of an otherwise strong position. In these ways, AVSL lets the market decide when to exit your position.
AVSL tailors each security for support, volatility, and the pricevolume relationship based on an investor’s time frame as calculated from the chart data. For example, my portfolio positions are continually re-evaluated with this AVSL methodology, which yields the possibility of raising the decision point threshold periodically based on the time frame of my investment objective. With my short-term Giddy-up portfolios, I use daily chart data and seek to raise my maximum loss stop on a daily basis.
My intermediate ETF and stock positions are calculated off of weekly data and then re-evaluated weekly. With my longer term stock portfolios, the decision point is calculated off data revised monthly. This analytical approach that uses measurable facts over emotion or gut instincts allows me to maintain my objectivity. Thus objectivity, not emotion, informs my investment decisions."
How look mine AVSL:
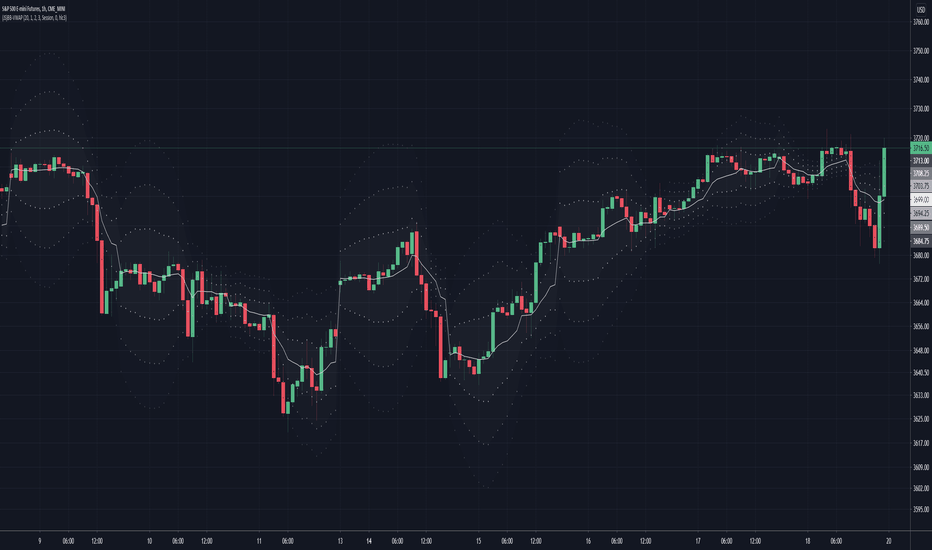
Price component = low × 1/VPC × 1/VPR : for VPC > 1 and VPC < -1 | low × 1 × 1/VPR : for 1 > VPC > 0 | low × -1 × 1/VPR : for 0 > VPC > -1
AVSL Price = sma((low × 1/VPC × 1/VPR) , length) / 100
length = round : for VPCI > 0 | round [ absolute ] : for VPCI < 0 | 3 : for VPCI=0
Standard Deviation = mult × VPCI × VM)
AVSL = sma(Actual low price - AWSL Price + Standard Deviation, 26)
It's hard to say is it the same as in Buff Pelz Dormeier book, but I encourage you to modify the script for better results. Indicateur