vol difflearn from change volume bar color vs sma , if bar up, volume bar change to orange, volume >20sma, volume change yellow. if bar down, volume bar change to silver , volume >20sma, volume change black.Indicateurpar UnknownUnicorn1409796Mis à jour 169
Bitcoin Total Output Volume (QUANDL:BCHAIN/TOUTV)Simple script that graphically represents the total dollar output volume at BITCOIN Blockchain data made available at QUANDL. Its logic is simple, search the data in the QUANDL database and plot it on the chart.Indicateurpar dc_analyticsMis à jour 22
Rolling Net VolumeMay still make changes, the current study should be helpful as is. Looking to highlight potential relative trend exhaustion in net volume. Should be most effective for stable supply assets. We're looking at an 100 day moving average of net volume essentially. The values of the RNV are slightly exaggerated to help with visibility PLEASE bear this in mind. Never the less, you can look at many commodities and notice moderate and extreme trend exhaustion on the positive and negative side using the tIndicateurpar SeanBronato268
Volume Divergence by MMIt's a simply volume indicator. You should watch for breaks on both volume uptrend and volume downtrend. It uses fibonacci numbers to build smoothed moving average of volume. Also you can check divergences for trend reversal and momentum loss. Indicateurpar baymucukMis à jour 43 5.6 K
Attributable VolumeA volume indicator which calculates "Attributable Volume”, the portion of volume which contributed to the direction in which the candle moved. Attributable Volume is calculated as: Total volume excluding the "counter wick" volume. Where for a green (up) candle, the "counter wick" volume is the top wick volume. In theory, Attributable Volume should better represent the effort of directional thrust of each candle. By default, this indicator displays “Attributable RVOL”, but can be set to: AIndicateurpar capriole_charlesMis à jour 11 1 K
Candle VolumeScript Based on Volume Based Coloured Bars by KivancOzbilgic ///////////// This indicator turns the candle into a volume-weighted signal, When the price falls, the candle is red, and when the price rises, the candle is green. In addition, we each have two colors Happening: Dark red: It is dark red when the downtrend trading volume is greater than 200% of its average price (default 20 days), which indicates that our price action is supported by strong bearish trading volume Red: When the priIndicateurpar MarqxMis à jour 4157
Volume, Simple Relative Volume HighlightThis script plots volume bars and highlight bars that have an unusual activity, compare to the average (Standard: Simple Moving Average, 50 periods). The script is useful for checking daily volume levels on equities. Where there is high volume, there is likely volatility, wich is good for day trading and swing trading entries.Indicateurpar Lupo_InvestingMis à jour 7565
Volume Weighted Exponential Moving AverageYou might have heard that simple moving average barks twice, then you will also notice that volume weighted moving average is even more horrible. Thanks to Trading View all I had to do was to replace SMA function with EMA. VWEMA can be used as an adaptive moving average or even an alternative to VWAP.Indicateurpar RezzaHmtMis à jour 12450
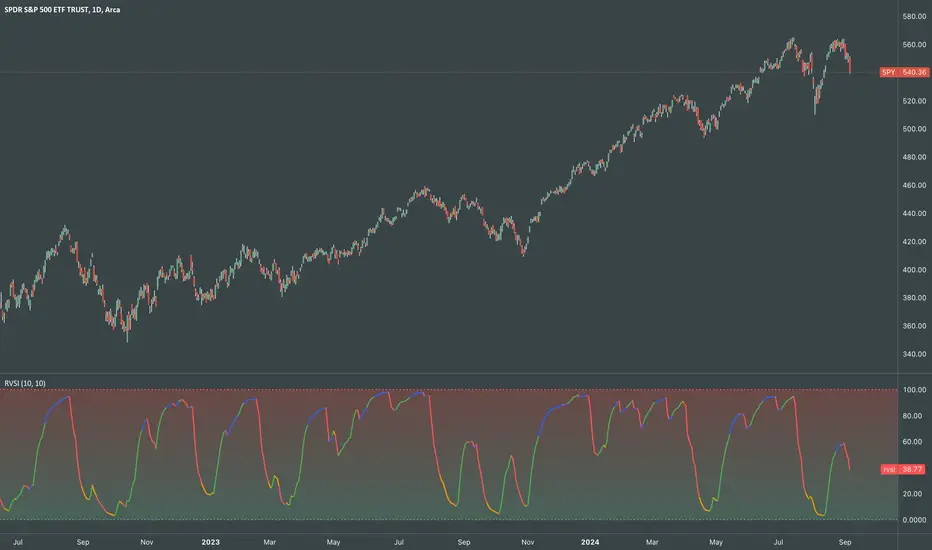
Relative Volume Strength IndexRVSI is an alternative volume-based indicator that measures the rate of change of average OBV. How to read a chart using it? First signal to buy is when you see RVSI is close to green oversold levels. Once RVSI passes above it's orange EMA, that would be the second alert of accumulation. Be always cautious when it reaches 50 level as a random statistical correction can be expected because of "market noises". You know it's a serious uptrend when it reaches above 75 and fluctuates thIndicateurpar fractMis à jour 44872
RedK_Supply/Demand Volume Viewer v1Background ============ VolumeViewer is a volume indicator, that offers a simple way to estimate the movement and balance (or lack of) of supply & demand volume based on the shape of the price bar. i put this together few years ago and i have a version of this published for another platform under different names (Directional Volume, BetterVolume) in case you come across them what is V.Viewer ===================== The idea here is to find a "simple proxy" for estimating the demand or supply portIndicateurpar RedKTraderMis à jour 44 1.8 K
Positive Volume Index + Negative Volume IndexThis is my version of plotting the classic Positive Volume Index and Negative Volume Index. They can be wildly different sometimes and not very helpful with entry and exit points but I hope this helps clearly identify buy and sell signals. Buy when the indicator is green and sell when it is red This was a special request so let me know when you want more scripts from me!Indicateurpar cheatcountryMis à jour 29 1.5 K
Negative Volume Disparity IndicatorThe Negative Volume Disparity Indicator was created by Phillip C. Holt (Stocks & Commodities V. 14:6 (265-269)). This converts the classic Negative Volume indicator into Bollinger Bands and calculates the percentage of where the value lies within the Bollinger Bands. Buy when the nvdi rises above its signal line and sell when it falls below the signal line. The OBVDI was a special request so I figured I would add this one as well. Let me know what other indicators you would like me to write scrIndicateurpar cheatcountryMis à jour 136
On Balance Volume Disparity IndicatorThe On Balance Volume Disparity Indicator was created by Phillip C. Holt (Stocks & Commodities V. 14:6 (265-269)). This converts the classic OBV indicator into Bollinger Bands and calculates the percentage of where the value lies within the Bollinger Bands. Buy when the obvdi rises above its signal line and sell when it falls below the signal line. This was a special request so let me know what other indicators you would like me to write scripts for!Indicateurpar cheatcountryMis à jour 8142
On Balance Volume ReflexThe On Balance Volume Reflex Indicator was developed by Fred Purifoy (Stocks & Commodities V 6:4 142-144) and it is similar in calculation to the On Balance Volume indicator but uses a lookback period for the change comparisons. Buy when the OVR is above the signal and sell when it falls below the signal. I have included my On Balance Volume Modified Indicator to highlight the differences between both indicators. Let me know if you would like to see me write scripts for more indicators! Indicateurpar cheatcountryMis à jour 3281
Relative Volume (RVOL)I have seen a few RVOL scripts floating around out there, but when creating alerts, the parameters have not been labeled clearly that makes it easy to say: "Alert me when RVOL crosses up my Treshold." Look no further than my retooled version that clearly separates the two data series by color and label. Enjoy!Indicateurpar Mik3Christ3ns3n1124
Volume xSMA ModSimple Volume indicator. showing rounded ratio of Current volume and simple moving average as xSMA (read as times SMA). Quick metric to understand the impact of volume in trends, etc. Example: if Vol = 50 and SMA = 5 xSMA = 50/5 = 10 Indicated as the Third Number in Volume label.Indicateurpar ForgedObliviousMis à jour 48
Delta Volume Columns Pro [LucF]█ OVERVIEW This indicator displays volume delta information calculated with intrabar inspection on historical bars, and feed updates when running in realtime. It is designed to run in a pane and can display either stacked buy/sell volume columns or a signal line which can be calculated and displayed in many different ways. Five different models are offered to reveal different characteristics of the calculated volume delta information. Many options are offered to visualize the calculationIndicateurpar LucFMis à jour 133 4.4 K
COVID-19: Daily changeNew daily infections (daily change) of COVID-19. The chart shows new daily cases across the entire planet, the US, EU (de+fr+it+es only) and a small country (RO) that does not matter to anybody but me. You can show/hide different country in Settings. Select "COVID-19: CONFIRMED" data in main chart and add the indicator.Indicateurpar icostanMis à jour 473
On Balance Volume ModifiedHere is a smoothed version of the classic OBV indicator with a signal line. You can use it to look for signal line crossovers and divergences. The signal line is a 10-day EMA of the OBVM line. Typically, the signal line can vary from 10 to 50. This was just published by Vitali Apirine in the latest issue of Stocks & Commodities (April 2020) p22-25 Please let me know if you want me to publish any other indicators or if you have any questions!Indicateurpar cheatcountryMis à jour 5426
On Balance Volume with CrossOBV indicator with a few key changes that can turn it into a filter or trading indicator as-is. Volume calculation given a look-back to help clarify trends without smoothing lag Change the source (HLC3 indicates a little faster in backtesting) Smooth the signal if desired Moving average (MA) added for crossover indication in trend change MA can be either EMA or HMA** ** My personal use: EMA for trend filtering trades: Trade long signals if OBV is above the MA, trade short signals if Indicateurpar fauxlifeMis à jour 3200
[fikira] Volume + MTF MAVolume normally has 1 Moving Average (standard orange coloured) This script gives 1 extra Moving Average (default blue coloured) BOTH MA can be shown with Multi Time Frames, based on the most excellent work of "PineCoders" (MTF Selection Framework functions)! This can provide more insights, also the crossovers can be interesting! So, default there are 2 MA's of the present Time Frame + extra 2 TF's of these MA's (default 2 and 4 times of the present TF) All can be enabled/disabled,Indicateurpar fikira2169
OBV Traffic LightsThe idea with On-balance volume (OBV) is to see price movement based on volume instead of the distance between the open and close of a candle. This can be used to find the relationship between volume and price action much easier than normal volume bars. This version spices the OBV up a bit by basing it off of the current and previous close of the Heikin Ashi of the current bar, as well as adding "traffic light" moving averages to the mix to get a better grasp of trends and when volume has shiftIndicateurpar lejmer24 2.7 K