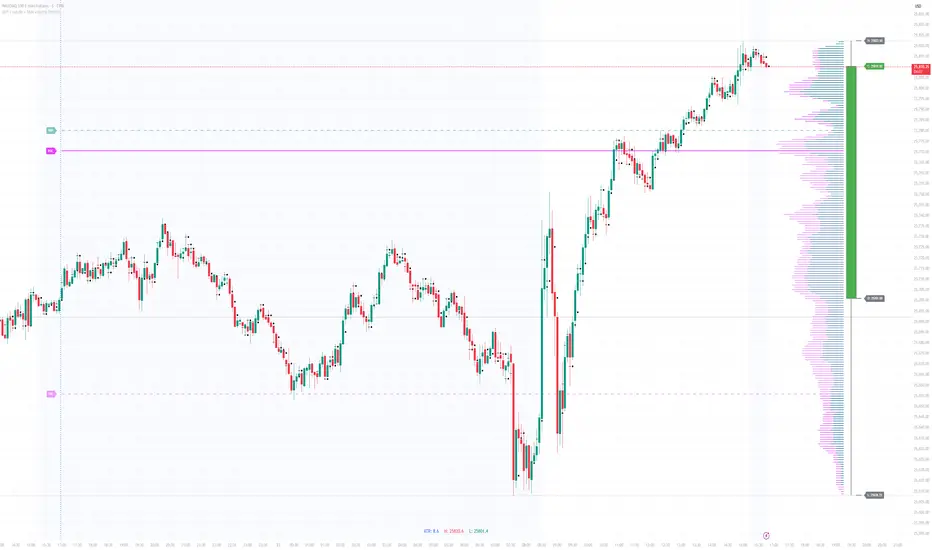
Volume Channel Flow [ChartPrime]⯁ OVERVIEW — Volume Channel Flow
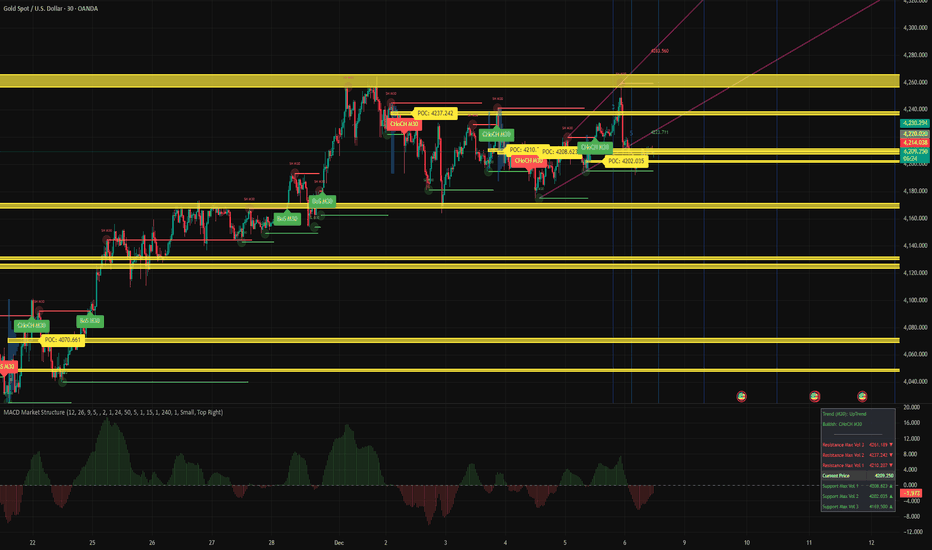
The Volume Channel Flow indicator dynamically tracks evolving trend channels while simultaneously analyzing volume distribution within each channel segment.
By combining adaptive volatility-based channel boundaries with real-time volume profiling, the tool highlights directional bias, structural breakouts, and zones where buy/sell pressure is concentrated.
This makes it a powerful hybrid of a trend-tracking system and a miniature volume-profile engine that updates live as the market moves.
⯁ CONCEPTS
Dynamic Volatility Channel:
Upper and lower channel levels are continuously recalculated using ATR. These levels shift only when price breaks outside the previous channel, signaling a trend transition.
Channel Segmentation:
When a channel shift occurs, the previous segment is closed and visually plotted as its own range — allowing traders to inspect each discrete “flow phase” of the market.
Embedded Volume Profile:
Inside each channel segment, the indicator builds a mini volume histogram using user-defined binning. This creates a quick visual read of how volume was distributed within that price range.
Point of Control (PoC):
The price level with the highest traded volume inside each completed segment is detected and plotted as a dashed horizontal PoC line.
Flow Bias (Bullish/Bearish):
The volume profile color adapts depending on whether cumulative delta volume (buy minus sell pressure) is positive or negative for the segment.
Breakout Labels:
When a new channel is formed, arrows mark whether the breakout occurred upward or downward.
⯁ FEATURES
Adaptive Trend Channel Construction
Channels update only when price closes beyond upper or lower volatility thresholds. This isolates trend shifts with minimal noise.
Channel Visualization Options
Choose to display full channel boxes or only trend lines using customizable styling.
Real-Time Volume Profiling
As long as the channel remains active, volume distribution is recalculated live on every bar.
PoC Projection
The PoC is drawn across the channel range, marking the highest-volume price level for each segment.
Directional Delta Coloring
Volume profiles automatically shift to bullish or bearish colors based on cumulative delta inside the channel.
Breakout Detection
Arrows highlight each transition into a new channel regime.
⯁ HOW TO USE
Spot trend changes using breakout arrows and the creation of new trend channels.
Gauge strength of a channel by examining the density and shape of the internal volume profile.
Use PoC levels as potential support/resistance interaction zones.
Validate momentum by checking whether volume delta shows bullish or bearish dominance.
Monitor channel edges to anticipate continuation or reversal setups.
⯁ CONCLUSION
The Volume Channel Flow indicator merges trend structure with volume analytics, providing a continuously adaptive picture of market flow.
It not only detects where trend phases begin and end, but also reveals what type of volume behavior shaped each segment, offering a deeper understanding of trend strength and directional pressure.
Indicateur

Indicateur

Indicateur

Indicateur

Indicateur

Indicateur
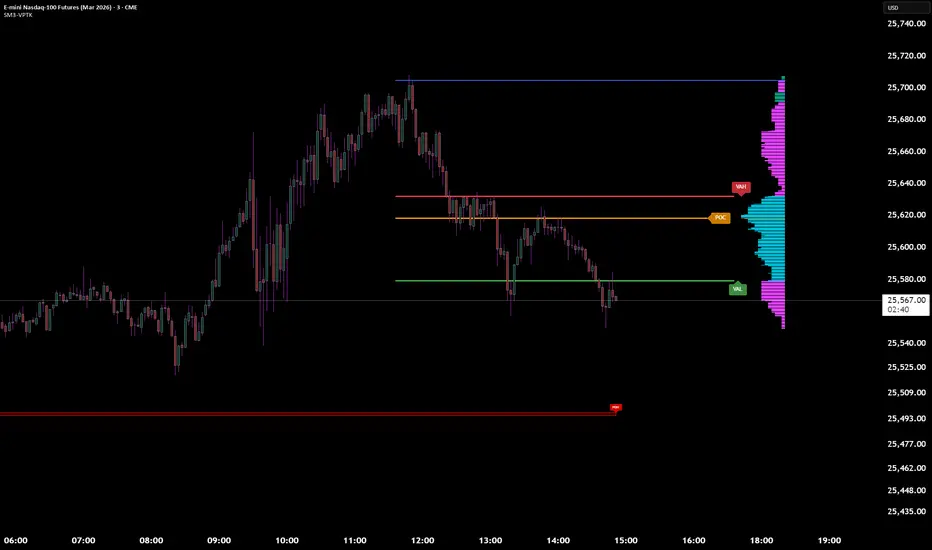
[Greeny] RTH Only Naked VPOCWhat it does
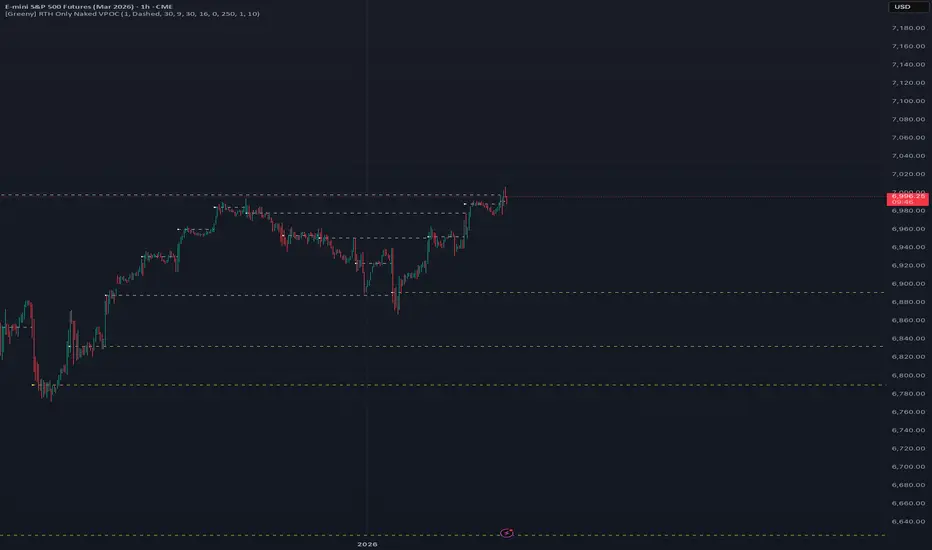
Calculates and displays daily Volume Point of Control (VPOC) levels based on RTH (Regular Trading Hours) session only. Tracks which VPOCs remain "naked" (untouched) and which have been hit - but only counts hits during RTH hours, ignoring overnight/globex touches.
Key Features
One VPOC per trading day calculated from entire RTH session volume profile
RTH-only hit detection - levels only marked as hit when touched during RTH, not overnight
Works on all timeframes - daily, hourly, or any chart timeframe
Volume-based filtering - automatically skips low-liquidity sessions (pre-front-month contract data)
Visual markers - small dash on origin bar shows where each VPOC was, even after being hit
Visual Guide
Yellow dashed line - Naked VPOC (not yet touched during RTH)
White dashed line - Hit VPOC (was touched during RTH)
Small dash on candle - POC origin marker
Settings
Display options: Toggle to show only naked POCs, customize hit/naked colors, adjust line width and style (solid/dashed/dotted), enable/disable line extension and origin markers.
RTH Session: Configure start and end time in NY timezone. Default is 9:30-16:00 (US equity market hours), which equals 15:30-22:00 Budapest time.
Advanced: Adjust volume profile resolution (default 250 bins), data source timeframe for calculations (5min recommended for daily charts), and minimum volume threshold to filter out low-liquidity sessions like pre-rollover contract data (default 10% of average).
Best For
ES/MES, NQ/MNQ futures traders
Mean reversion strategies using VPOC as support/resistance
Auction Market Theory practitioners
Anyone wanting clean RTH-only volume profile levels
Note on Contract Rollovers
When using specific contract symbols (e.g., ESH2026 instead of ES1!), the script may show many naked VPOCs from months before the contract became active. This happens because futures contracts have very low liquidity before becoming the front-month, creating unreliable VPOCs with gaps that never get hit. The volume filter helps reduce this, but you may need to increase the "Min Volume % of Average" setting or simply ignore older levels when viewing back-month data. Indicateur

Indicateur

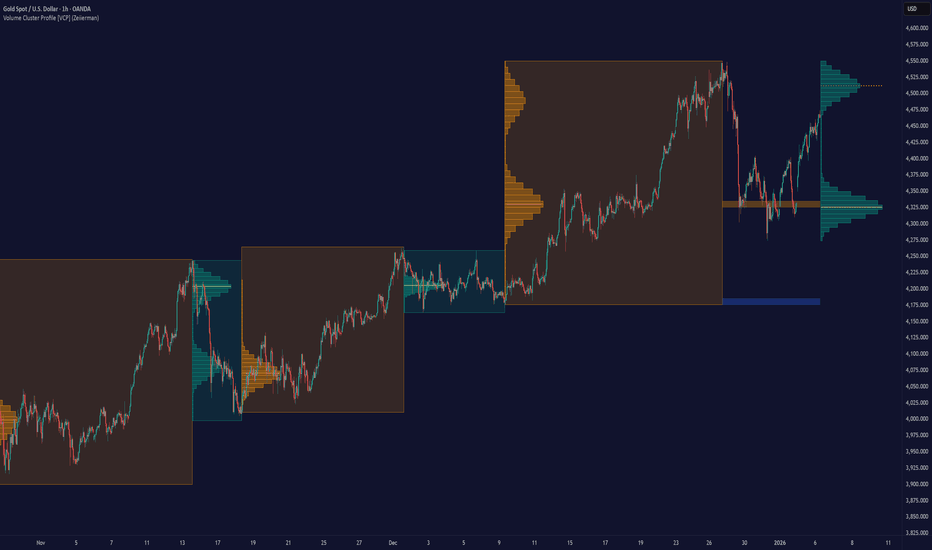
Volume Cluster Profile [VCP] (Zeiierman)█ Overview
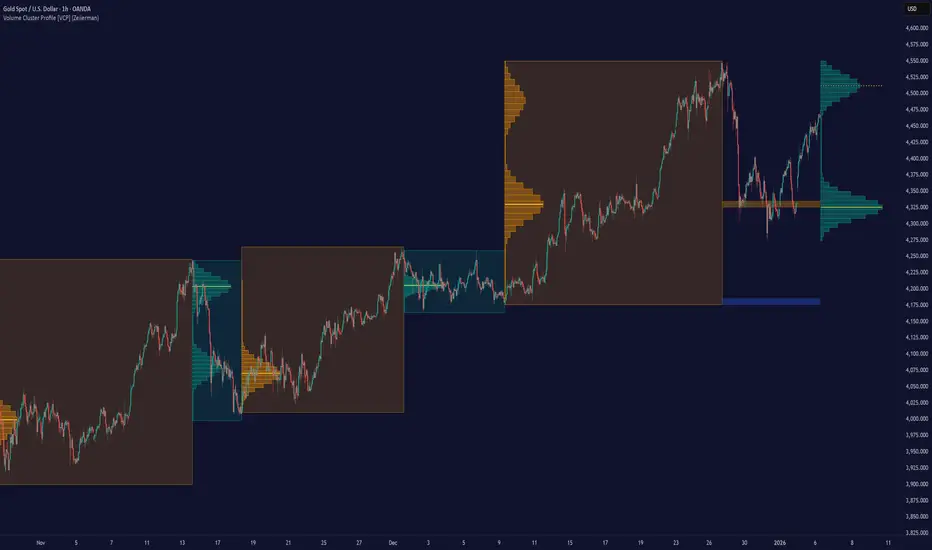
Volume Cluster Profile (Zeiierman) is a volume profile tool that builds cluster-enhanced volume-by-price maps for both the current market window and prior swing segments.
Instead of treating the profile as a raw histogram only, VCP detects the dominant volume peaks (clusters) inside the profile, then uses a Gaussian spread model to “radiate” those peaks into surrounding price bins. This produces a smoother, more context-aware profile that highlights where volume is most meaningfully concentrated, not just where it happened to print.
On top of the live profile, VCP automatically records historical swing profiles between pivots, wraps each segment for clarity, and can project the most recent segment’s High/Low Value extensions (VA/LV) forward to the current bar to keep key structure visible as price evolves.
█ How It Works
⚪ 1) Profile Construction (Volume-by-Price)
VCP builds a volume profile histogram over a chosen window (current lookback, or a swing segment):
Range Scan
The script finds the full min → max price range inside the window.
Bin the Range
That range is divided into a user-defined number of Price Bins (rows). More bins = finer detail, but heavier computation.
Accumulate Volume into Bins
For each bar inside the window, the script takes the bar’s close price, determines which price bin it belongs to, and adds the bar’s volume to that bin.
float step = (maxPrice - minPrice) / binsCount
for i = 0 to barsToUse - 1
int b = f_clamp(int(math.floor((close - minPrice) / step)), 0, binsCount - 1)
volBins += volume
Result: volBins becomes a standard volume-by-price histogram (close-based binning).
⚪ 2) Cluster Detection (Finding Dominant Peaks)
Once the raw histogram is built, VCP identifies cluster centers as the most meaningful volume “hills”:
Local Peak Test
A bin becomes a cluster candidate if its volume is greater than or equal to its immediate neighbors (left/right).
Filter Weak Peaks
Peaks must also be above a basic activity threshold (relative to the average bin volume) to avoid noise.
bool isPeak = v >= left and v >= right
if isPeak and v > avgVol
array.push(clusterIdxs, b)
Keep the Best Peaks Only
If too many peaks exist, the script keeps only the strongest ones, capped by: Max Cluster Centers
Result: clusterIdxs = the set of dominant profile peaks (cluster centers).
⚪ 3) Cluster Enhancement (Gaussian Spread Model)
This is what makes VCP different from a raw profile.
Instead of using volBins directly, the script builds an enhanced profile where each cluster center influences nearby price bins using a Gaussian curve:
Distance from each bin to each cluster center is computed in “bin units”
A Gaussian weight is applied so that bins near the center receive stronger influence, while bins farther away decay smoothly.
Cluster Spread (sigma) controls how wide this influence reaches: low sigma produces tight, sharp clusters, while high sigma results in wider, smoother structure zones.
enhanced += centerV * math.exp(-(dist*dist) / (2.0 * clusterSigma * clusterSigma))
volBinsAI := enhanced / szClFinal
Result: volBinsAI = the cluster-enhanced volume value for each bin.
In practice, VCP turns the profile into a structure map of dominant volume concentrations, rather than a simple “where volume printed” histogram.
⚪ 4) POC from the Enhanced Profile
After enhancement:
The bin with the highest volBinsAI becomes the POC (Point of Control)
POC is plotted at the midpoint price of that bin
if volBinsAI > maxVol
maxVol := volBinsAI , pocBin := b
So the POC reflects the cluster-enhanced profile rather than the raw histogram.
█ How to Use
⚪ Read Cluster Structure (Default = 2 Clusters)
By default, the Volume Cluster Profile (VCP) is configured to detect up to 2 dominant volume clusters within the profile. These clusters represent price zones where the market accepted trading activity, not just where volume printed randomly.
⚪ When TWO Clusters Appear
When VCP detects two distinct clusters, it usually indicates:
Two competing areas of value
Ongoing auction between higher and lower acceptance zones
Treat each cluster as an acceptance zone
Expect slower price action and rotation inside clusters
Expect faster movement in the low-volume space between clusters
Use cluster-to-cluster movement as:
rotation targets
range boundaries
acceptance vs rejection tests
Typical behavior:
Price enters a cluster → stalls, consolidates, rotates
Price rejects at cluster edge → moves toward the opposite cluster
⚪ When ONLY ONE Cluster Appears
If VCP detects only one cluster, or if two clusters visually merge into one:
Volume is no longer split
The market has formed a single dominant value area
Price consensus is strong
Treat the cluster as the primary value anchor
Expect pullbacks and reactions around this zone
Bias becomes directional:
Above the cluster → bullish context
Below the cluster → bearish context
Inside the cluster → balance/chop
This structure often appears during clean trends or stable equilibria.
⚪ VA/LV Extensions
VCP projects two zones from the end of the most recent swing segment:
VA extension = the segment’s highest enhanced-volume bin (dominant zone)
LV extension = the segment’s lowest enhanced-volume bin (thin/weak zone)
A breakout of the VA extension signals acceptance and potential continuation. A retest of the VA or LV extension is used to confirm acceptance or rejection, while rejection from either zone often leads to rotation back toward value.
█ Settings
Cluster Volume Profile
Lookback Bars – how many recent bars build the current profile
Price Bins – profile resolution (more bins = more detail, heavier CPU)
Cluster Spread – Gaussian sigma; higher values widen/smooth cluster influence
Max Cluster Centers – cap on detected peaks used in enhancement
Historical Swing Cluster Volume Profile
Pivot Length – swing sensitivity (larger = fewer, broader segments)
Max Profiles – how many historical segments to retain
Profile Width – thickness of each historical profile
High & Low Value Area
Profile VA/LV – extend the last segment’s top-bin and low-bin zones forward
-----------------
Disclaimer
The content provided in my scripts, indicators, ideas, algorithms, and systems is for educational and informational purposes only. It does not constitute financial advice, investment recommendations, or a solicitation to buy or sell any financial instruments. I will not accept liability for any loss or damage, including without limitation any loss of profit, which may arise directly or indirectly from the use of or reliance on such information.
All investments involve risk, and the past performance of a security, industry, sector, market, financial product, trading strategy, backtest, or individual's trading does not guarantee future results or returns. Investors are fully responsible for any investment decisions they make. Such decisions should be based solely on an evaluation of their financial circumstances, investment objectives, risk tolerance, and liquidity needs.
Indicateur
Delta Reaction Zones [BOSWaves]Delta Reaction Zones - Cumulative Delta-Based Supply and Demand Identification with Flow-Weighted Zone Construction
Overview
Delta Reaction Zones is a volume flow-aware supply and demand detection system that identifies price levels where significant buying or selling pressure accumulated, constructing adaptive zones around cumulative delta extremes with intelligent flow composition analysis.
Instead of relying on traditional price-based support and resistance or fixed pivot structures, zone placement, thickness, and directional characterization are determined through delta accumulation patterns, volatility-adaptive sizing, and the proportional composition of positive versus negative volume flow.
This creates dynamic reaction boundaries that reflect actual order flow imbalances rather than arbitrary price levels - contracting during low volatility environments, expanding during elevated volatility periods, and incorporating flow composition statistics to reveal whether zones formed under buying or selling dominance.
Price is therefore evaluated relative to zones anchored at delta extremes rather than conventional technical levels.
Conceptual Framework
Delta Reaction Zones is founded on the principle that meaningful support and resistance emerge where cumulative volume flow reaches local extremes rather than where price alone forms patterns.
Traditional support and resistance methods identify turning points through price structure, which often ignores the underlying order flow dynamics that drive those reversals. This framework replaces price-centric logic with delta-driven zone construction informed by actual buying and selling pressure.
Three core principles guide the design:
Zone placement should correspond to cumulative delta extremes, not price pivots alone.
Zone thickness must adapt to current market volatility conditions.
Flow composition context reveals whether zones formed under accumulation or distribution.
This shifts supply and demand analysis from static price levels into adaptive, flow-anchored reaction boundaries.
Theoretical Foundation
The indicator combines delta proxy methodology, cumulative volume tracking, adaptive volatility measurement, and flow decomposition analysis.
A signed volume delta proxy estimates directional order flow on each bar, which accumulates into a running cumulative delta series. Pivot detection identifies local extremes in either cumulative delta or its rate of change, marking levels where flow momentum reached inflection points. Average True Range (ATR) provides volatility-responsive zone sizing, while impulse window analysis decomposes recent flow into positive and negative components with percentage weighting.
Four internal systems operate in tandem:
Delta Accumulation Engine : Computes smoothed signed volume and maintains cumulative delta tracking for directional flow measurement.
Pivot Detection System : Identifies significant turning points in cumulative delta or delta rate of change to anchor zone placement.
Adaptive Zone Construction : Scales zone thickness dynamically using ATR-based volatility measurement around pivot anchors.
Flow Composition Analysis : Calculates positive and negative flow percentages over a configurable impulse window to characterize zone formation context.
This design allows zones to reflect actual order flow behavior rather than reacting mechanically to price formations.
How It Works
Delta Reaction Zones evaluates price through a sequence of flow-aware processes:
Signed Volume Delta Calculation : Each bar's volume is directionally signed based on close-open relationship, creating a proxy for buying versus selling pressure.
Cumulative Delta Tracking : Signed volume accumulates into a running total, revealing sustained directional flow over time.
Pivot Identification : Local highs and lows in cumulative delta (or its rate of change) mark significant flow inflection points where zones anchor.
Volatility-Adaptive Sizing : ATR multiplier determines zone half-width, automatically adjusting thickness to current market conditions.
Flow Decomposition : Positive and negative volume components are separated and percentage-weighted over the impulse window to reveal dominant flow direction.
Intelligent Zone Merging : Overlapping zones of the same type automatically merge into broader reaction areas, with flow statistics blended proportionally.
Dynamic Extension and Visualization : Zones extend forward with gradient-filled composition segments showing buy versus sell flow proportions.
Breach Detection and Cleanup : Zones invalidate automatically when price closes beyond their boundaries, maintaining chart clarity.
Together, these elements form a continuously updating supply and demand framework anchored in order flow reality.
Interpretation
Delta Reaction Zones should be interpreted as flow-anchored supply and demand boundaries:
Support Zones (Green) : Form at cumulative delta lows, marking levels where selling exhaustion or buying accumulation occurred.
Resistance Zones (Red) : Establish at cumulative delta highs, identifying areas where buying exhaustion or selling distribution dominated.
Flow Composition Segments : Visual gradient within each zone reveals the buy/sell flow proportion during zone formation. The upper segment (red tint) represents negative (selling) flow percentage while the lower segment (green tint) represents positive (buying) flow percentage.
BUY FLOW / SELL FLOW / MIXED Labels : Indicate dominant flow character when one direction exceeds 60% of total impulse window activity.
Net Delta Statistics : Display cumulative flow totals (Δ) alongside percentage breakdowns for immediate context.
Zone Thickness : Reflects current volatility environment - wider zones in volatile conditions, tighter zones in calm markets.
Zone Merging : Multiple nearby pivots consolidate into broader reaction areas, weighted by their respective flow magnitudes.
Flow composition, volatility context, and delta magnitude outweigh isolated price reactions.
Signal Logic & Visual Cues
Delta Reaction Zones presents two primary interaction signals:
Support Reclaim (RC) : Green label appears when price crosses back above a support zone's midline after trading below it, suggesting renewed buying interest.
Resistance Re-enter (RE) : Red label displays when price crosses back below a resistance zone's midline after trading above it, indicating resumed selling pressure.
Alert generation covers zone creation and midline reclaim/re-entry events for systematic monitoring.
Strategy Integration
Delta Reaction Zones fits within order flow-informed and supply/demand trading approaches:
Flow-Anchored Entry Zones : Use zones as high-probability reaction areas where historical order flow imbalances occurred.
Composition-Based Bias : Favor trades aligning with dominant flow character - long setups near zones formed under buying dominance, short setups near selling-dominated zones.
Volatility-Aware Targeting : Expect wider reaction ranges when ATR expands zones, tighter ranges when ATR contracts them.
Merge-Informed Conviction : Broader merged zones represent multiple flow inflection points, potentially offering stronger support/resistance.
Midline Reclaim Validation : Use RC/RE signals as confirmation of zone respect rather than standalone entry triggers.
Multi-Timeframe Flow Context : Apply higher-timeframe delta zones to inform lower-timeframe entry precision.
Technical Implementation Details
Core Engine : Signed volume delta proxy with EMA smoothing
Accumulation Model : Persistent cumulative delta tracking with optional rate-of-change pivot detection
Zone Construction : ATR-scaled thickness around pivot anchors
Flow Analysis : Positive/negative decomposition over configurable impulse window
Visualization : Gradient-filled zones with embedded flow statistics and percentage segments
Signal Logic : Midline crossover detection with breach-based invalidation
Merge System : Proximity-based consolidation with weighted flow blending
Performance Profile : Optimized for real-time execution with configurable zone limits
Optimal Application Parameters
Timeframe Guidance:
1 - 5 min : Micro-structure flow zones for scalping and short-term reversals
15 - 60 min : Intraday supply/demand identification with flow context
4H - Daily : Swing-level reaction zones with macro flow characterization
Suggested Baseline Configuration:
Delta Smoothing Length : 3
Pivot Length : 12
Pivot Source : Cumulative Delta
Impulse Window : 100
ATR Length : 14
ATR Multiplier : 0.35 (reduce for lower timeframes)
Maximum Zones : 8
Merge Overlapping Zones : Enabled
Merge Gap : 20 ticks
These suggested parameters should be used as a baseline; their effectiveness depends on the asset's volume profile, tick structure, and preferred zone density, so fine-tuning is expected for optimal performance.
Parameter Calibration Notes
Use the following adjustments to refine behavior without altering the core logic:
Zones appearing oversized : Reduce ATR Multiplier to tighten zone thickness, especially on lower timeframes.
Excessive zone clutter : Increase Pivot Length to demand stronger delta extremes before zone creation.
Unstable delta readings : Increase Delta Smoothing Length to reduce bar-to-bar noise in flow calculation.
Missing significant levels : Decrease Pivot Length or switch Pivot Source to "Cumulative Delta RoC" for flow acceleration sensitivity.
Flow percentages feel stale : Reduce Impulse Window Length to emphasize more recent buying/selling composition.
Too many merged zones : Decrease Merge Gap (ticks) or disable merging to preserve individual pivot zones.
Adjustments should be incremental and evaluated across multiple session types rather than isolated market conditions.
Performance Characteristics
High Effectiveness:
Markets with consistent volume and order flow characteristics
Instruments where delta proxy correlates well with actual tape reading
Mean-reversion strategies targeting flow exhaustion zones
Trend continuation entries at zones aligned with dominant flow direction
Reduced Effectiveness:
Extremely low volume environments where delta proxy becomes unreliable
News-driven or gapped markets with discontinuous flow
Highly manipulated or illiquid instruments with erratic volume patterns
Integration Guidelines
Confluence : Combine with BOSWaves structure, market profile, or traditional supply/demand analysis
Flow Respect : Trust zones formed with strong net delta magnitude and clear flow dominance
Context Awareness : Consider whether current market regime matches zone formation conditions
Merge Recognition : Treat merged zones as higher-conviction areas due to multiple flow inflections
Breach Discipline : Exit zone-based setups cleanly when price invalidates boundaries
Disclaimer
Delta Reaction Zones is a professional-grade order flow and supply/demand analysis tool. It uses a volume-based delta proxy that estimates directional pressure but does not access true order book data. Results depend on market conditions, volume reliability, parameter selection, and disciplined execution. BOSWaves recommends deploying this indicator within a broader analytical framework that incorporates price structure, volatility context, and comprehensive risk management. Indicateur

Indicateur
deKoder | Whale Prints [WP]deKoder | Whale Prints | Large Trade Orderflow Detection
This open-source indicator is a clean, precision tool for revealing hidden large-volume activity directly on your chart. By scanning ultra-low timeframes while you view higher ones, it projects statistically significant volume spikes as intuitive markers giving you a clear window into institutional orderflow without visually overwhelming the price action.
Key Features & Strengths
True Intra-Bar Detection | Monitors lower timeframes down to 1-second bars, catching aggressive block trades and absorption that occur within a single higher-TF candle.
Accurate Trade Levels | Markers are placed at the actual hl2 price of the aggressive lower-TF bar, providing a far more accurate estimate of where the large trade executed than typical mid-candle approximations.
Multiple Trades Per Bar | If several significant volume spikes occur inside one higher-TF candle, all qualifying levels are displayed individually – offering greater granularity and context.
Adaptive Thresholding | Uses higher-TF volume standard deviation (stable baseline) intelligently scaled to the lower timeframe, reducing noise in quiet markets while remaining sensitive to genuine outliers.
Clean Visual Hierarchy | Three tiers (Small 🞉 / Medium ⏣ / Large 🞊) with dynamic symbol size, line thickness, transparency, and user-definable bullish/bearish coloring based on LTF candle direction.
How to Use It as an Orderflow Tool
Large volume spikes often mark the footprints of institutional players. This indicator helps you read those footprints in real time.
Small (🞉) | Moderate excess volume: early interest, probing, or building positions.
Medium (⏣) | Strong spike: increasing conviction, potential momentum shift.
Large (🞊) | Extreme outlier: frequently climactic volume signalling exhaustion or major absorption.
Why Price Often Reverses at These Levels
Large players frequently place limit orders in areas rich with liquidity – commonly just beyond recent highs/lows where retail stop-losses cluster. When price sweeps those zones:
Stop hunts trigger a cascade of forced exits, creating liquidity for larger participants to fill their limit orders.
Breakout traders who entered on the move are trapped offside and become forced buyers/sellers when price reverses.
Institutions use this liquidity to execute large orders at favorable prices with minimal immediate market impact.
The result is aggressive volume at the extreme, followed by reversal as smart money finishes filling and price returns toward fair value. Clusters of medium/large markers at swing points are classic signs of this dynamic.
Practical Analysis Tips
Reversals/Absorption | Clusters of large markers at swing highs/lows (especially opposing-color spikes) signal potential turns – buyers or sellers stepping in aggressively.
Level Defense | Trades piling up at key support/resistance suggest institutions protecting or building positions.
Trapped Traders | Large spikes beyond range pivots followed by reversal back into the range often highlight trapped breakout traders who add fuel to a move when they are forced to liquidate their positions.
Use Offset (-3 to +3) to shift markers away from current price for clearer viewing.
Pro tip: Zoom into the lower TF occasionally to see how these projected levels align exactly with aggressive candles.
Recommended Pairings
This is designed as a pure orderflow overlay to be layered with your existing setup:
Support & Resistance (horizontals, pivots, Volume Profile POC/VAH/VAL)
Market Structure tools (swing points, order blocks, fair value gaps)
Trend filters (EMAs, SuperTrend, higher-TF bias)
Momentum oscillators for timing confluence
Best Suited For
Scalping & day trading (1–15 min charts with 5–30S lower TF)
Swing trading entries (1H–4H charts with 1–5 min lower TF)
High-liquidity markets: crypto perpetuals, forex majors, volatile stocks
Add this indicator to start seeing the hidden aggression driving price and expose the hidden edges beyond the noise.
☠ FR33FA11 | deKoder ☠
Released January 2025 | Open Source Indicateur

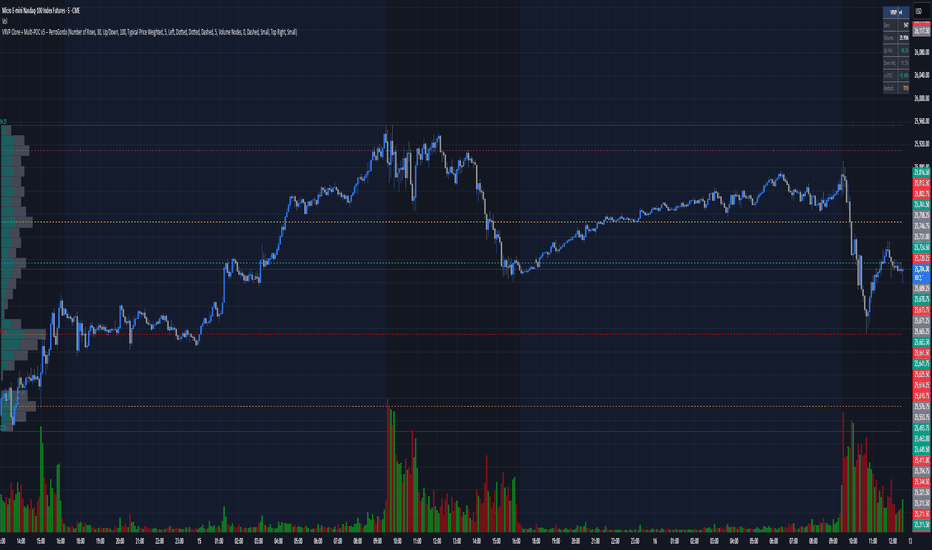
VRVP Clone + Multi-POC -- PerroGordoVRVP Clone + Multi-POC
Overview
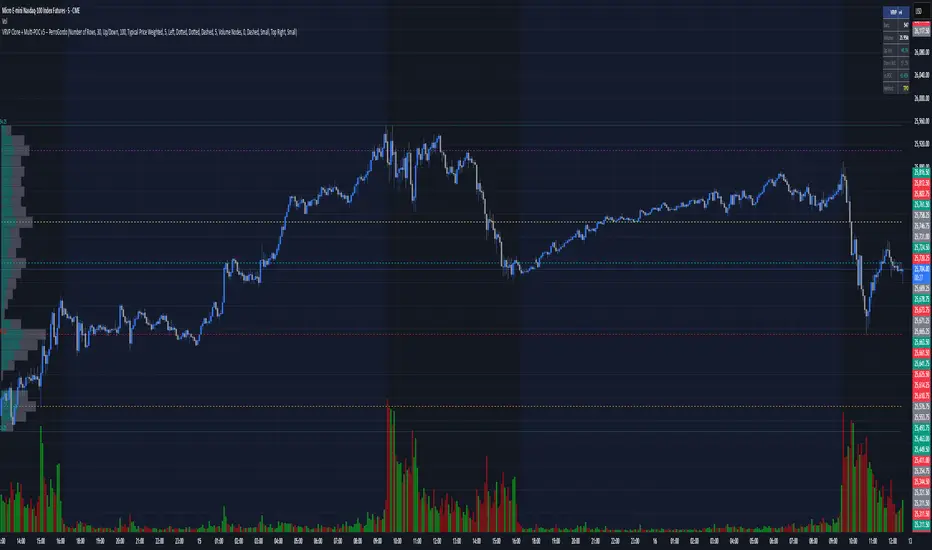
VRVP Clone + Multi-POC replicates TradingView's native Visible Range Volume Profile with several practical enhancements. The indicator displays volume distribution across price levels for the visible chart range, which is useful for identifying high-volume nodes, support/resistance zones, and areas of price acceptance.
The main differentiator from the built-in VRVP is support for multiple Point of Control (POC) lines with an intelligent peak detection algorithm. Instead of just showing the single highest-volume level, you can identify distinct volume clusters across different price zones.
Features
Dynamic Visible Range
Recalculates automatically on scroll or zoom
Analyzes only visible bars
Profile width scales proportionally to view
Multiple POC Detection (1-8 levels)
Volume Nodes Mode: Peak detection algorithm finds local volume maxima across distinct price clusters
Highest Rows Mode: Traditional approach - top N rows by raw volume
Configurable minimum separation between nodes to prevent bunching
Individual colors for each POC level
Volume Display Modes
Up/Down: Split bars showing buy vs. sell volume with black outlines for visual separation
Total: Single bar colored by dominant direction
Delta: Net volume (buy minus sell)
Delta Intensity: Gradient coloring indicating buyer/seller dominance strength per row
Value Area
Configurable percentage (default 70%)
VAH and VAL lines with customizable styles
Separate colors for volume inside vs. outside the Value Area
Positioning Options
Left or Right placement
Adjustable profile width as percentage of visible range
Row configuration via "Number of Rows" or "Ticks Per Row"
Additional Features
Statistics table showing bars analyzed, total volume, up/down percentages, price vs POC
POC price labels on chart
Line style options (Solid, Dashed, Dotted)
+++++
How It Works
Volume from each bar is distributed across price rows based on the bar's high-low range. The allocation is proportional - if a bar spans 3 rows with 60% overlap on one row, that row receives 60% of the bar's volume.
Volume Nodes Mode identifies local peaks in the distribution (rows where volume exceeds both neighbors), then selects the highest peaks while enforcing minimum separation. This surfaces distinct support/resistance clusters rather than stacking all POC lines in a single high-volume area.
+++++
Settings
Inputs
Setting - Description
Rows Layout - "Number of Rows" or "Ticks Per Row"
Row Size - Number of rows (24-200) or ticks per row
Volume - "Up/Down", "Total", "Delta", or source selection
Value Area % - Percentage of volume for Value Area (default 70%)
Profile Width % - Width as percentage of visible bars
Placement - "Right" or "Left" side of chart
Enhancements
Setting - Description
Number of POCs | 1-8 POC lines |
POC Mode - "Volume Nodes" (peak detection) or "Highest Rows" (traditional)
Min Node Separation - Minimum rows between nodes (0 = auto-calculate)
Delta Intensity Mode - Gradient coloring by dominance
Show Stats Table - Display analysis statistics
Style
Setting - Description
Up/Down Volume Colors - Buy/sell volume colors
Value Area Colors - Colors for VA regions
POC/VAH/VAL Colors - Line colors and styles
POC 2-8 Colors - Colors for additional POC levels
+++++
Applications
Support/Resistance Identification
High-volume nodes tend to act as price magnets. Multiple POCs reveal layered S/R zones that aren't visible with a single POC.
Fair Value Reference
The Value Area represents where 70% of volume traded. Price tends to revert to this zone.
Volume Gap Analysis
Low-volume areas between POCs indicate prices that were rejected quickly - potential breakout or breakdown levels.
Market Structure
Multiple POCs across price levels show where the market has found acceptance, useful for distinguishing range-bound conditions from trending moves.
+++++
Practical Notes
Volume Nodes mode with 3-5 POCs works well for identifying distinct S/R clusters
Higher row counts give more granular analysis on lower timeframes
Delta Intensity mode quickly shows buyer/seller dominance at each level without the visual noise of split bars
If POCs are too clustered, increase Min Node Separation; if too spread out, decrease it or set to 0 for auto
The stats table vs POC comparison is useful for quick directional bias assessment
+++++
Requirements
Any instrument with volume data
Works well on futures, forex, and liquid equities
Pine Script v6
+++++
Version History
v1.1
- Added Volume Nodes mode with peak detection
- Expanded to 8 POC levels
- Added Min Node Separation setting
- Fixed POC label positioning for left placement
- Added black outlines to Up/Down volume bars
v1.0
- Initial release replicating VRVP with multi-POC enhancement
- Delta Intensity mode
- Statistics table Indicateur
Indicateur

VPH - Volume Profile Heatmap (Visible Prices) [Da_Prof]The Volume Profile Heatmap (VPH) indicator is a dynamic volume visualization tool. Unlike traditional Volume Profiles that aggregate all historical data within a range, VPH focuses on recent price action. Specifically, it only considers the volume of the most recent time price touched a level. Additionally, it displays the volume as a heatmap where color intensity directly translates to volume density at specific price levels (as a percentage of the volume range).
What makes the VPH different than other volume profile indicators is its exclusion logic. If a high-volume node was created in the past, but the price has since crossed back through that level, the indicator disregards the previous volume. Therefore, it prioritizes the most recent market participants at any given price level. This is particularly useful for identifying:
1) Fresh Support/Resistance: Levels where volume has accumulated recently without being invalidated by a price cross-through.
2) Real-time Liquidity: Seeing exactly where the supply and demand reside in the current market structure in terms of volume transacted for the particular asset.
Main Features:
1) Dynamic Heatmap: Uses a multi-stage blue color gradient to represent volume intensity. Brighter, more vibrant cyan indicates high-volume nodes, while deep blues represent lower-activity zones. These default colors are best viewed on a black background. The colors can be customized through the settings.
2) Visible Range Scaling: The indicator automatically calculates the High and Low of your current screen view and adjusts the heatmap rows to fit perfectly within your visible window. Note: Ensure the indicator is pinned to the appropriate scale (likely the right scale). If the profile appears to not move when moving the chart, right click on the indicator and select the "pin to scale" to pin it to the appropriate scale.
3) Adjustable Resolution: Use the Number of Profile Bars input to increase the "granularity" of the heatmap (up to 400 rows).
4) Volume Thresholding: The Minimum Volume to Plot setting allows you to filter out "noise," showing only the price levels where significant market commitment occurred. The default is set at 50% of the range maximum.
How to use:
1) Identify high volume nodes: Look for the brightest cyan boxes. These represent price levels where the most recent heavy trading occurred. These areas are more likely to create a price reaction.
2) Spot thinly traded areas: Darker or empty areas indicate "low volume Nodes," where price moved quickly through. These often act as "vacuum" zones where price might travel through rapidly in the future.
3) Scroll & zoom to get the exact window of price action: The indicator is fully reactive. As you move your chart, it recalculates the heatmap based on the visible bars to provide a localized view of the current auction. This allows back testing of the indicator without using the "Replay" feature. Just put the historical price action you are interested in on your screen and the indicator will calculate the volume profile. Indicateur

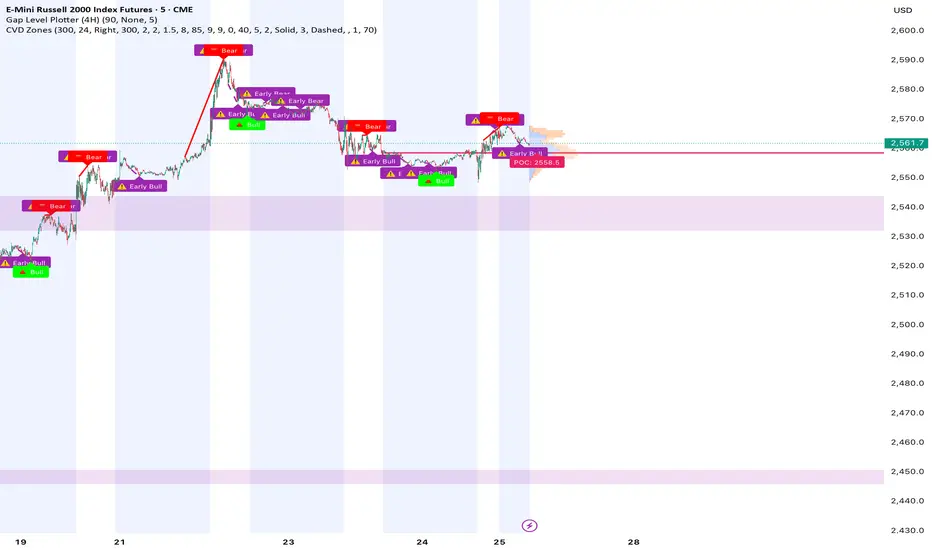
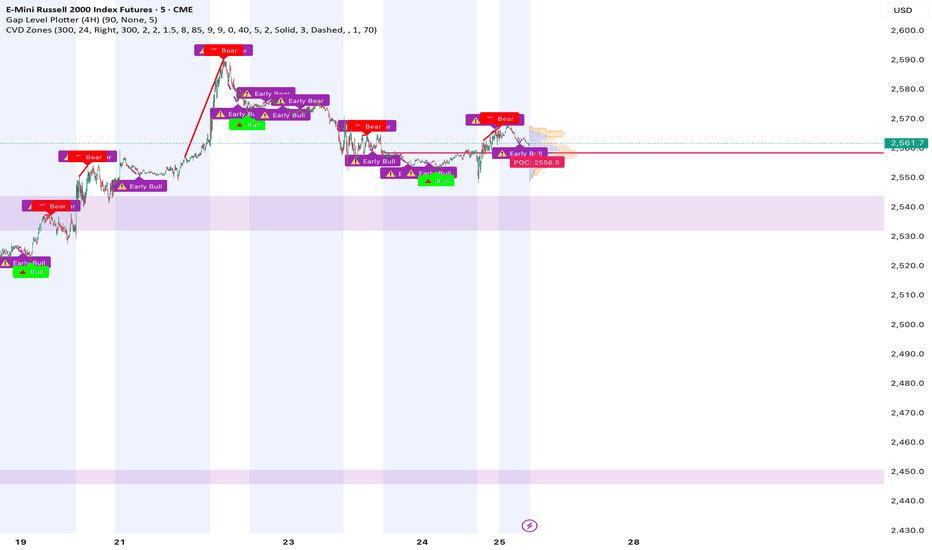
CVD Zones & Divergence [Pro]# CVD Zones & Divergence
**Complete CVD order flow toolkit** - Divergences, POC, Profile, and Supply/Demand zones all in one professional indicator.
## 🎯 What It Does
Combines **four powerful order flow tools** into a single, cohesive indicator:
1. **CVD Divergences** - Early warnings + confirmed signals
2. **Point of Control (POC)** - Fair value equilibrium line
3. **CVD Profile** - Visual distribution histogram
4. **Supply/Demand Zones** - Real absorption-based S/R levels
All based on **Cumulative Volume Delta (CVD)** - actual buying/selling pressure, not approximations.
## ✨ Key Features
### 🔄 CVD Divergences (Dual Mode)
**Confirmed Divergences** (High Accuracy)
- Solid lines (customizable colors)
- 🔻 Bear / 🔺 Bull labels
- Win rate: ~70-80%
- Best for swing traders
**Early Warning Mode** ⚡ (Fast Signals)
- Dashed lines (default purple)
- ⚠️ Early Bear / ⚠️ Early Bull labels
- Fires 6+ bars earlier
- Win rate: ~55-65%
- Best for scalpers/day traders
### 🎯 Point of Control (POC)
- **Independent lookback** (300 bars default)
- Yellow line showing fair value
- Where most CVD activity occurred
- Acts as dynamic support/resistance
- Resets and recalculates continuously
### 📊 CVD Profile Histogram
- **Visual CVD distribution** over lookback period
- **Split buy/sell** (blue/orange bars)
- **Value Area** (70% CVD zone highlighted)
- Position: Right/Left/Current (your choice)
- Shows where actual order flow happened
### 📦 Supply/Demand Zones
- **Absorption-based** detection (not guesses!)
- Green = Demand (buyers absorbed 2:1+)
- Red = Supply (sellers absorbed 2:1+)
- Shows **real** institutional levels
- Auto-sorted by strength
- Displays top 8 zones
## 📊 What You See on Chart
```
Your Chart:
├─ 🔴 Red lines (bearish divergences)
├─ 🟢 Green lines (bullish divergences)
├─ 🟣 Purple dashed (early warnings)
├─ 🟡 Yellow POC line (fair value)
├─ 📊 Blue/Orange profile (right side)
├─ 🟢 Green boxes (demand zones)
└─ 🔴 Red boxes (supply zones)
```
## ⚙️ Recommended Settings
### 15m Day Trading (Most Popular)
```
📊 Profile:
- Lookback: 150 bars
- Profile Rows: 24
- Position: Right
🎯 POC:
- POC Lookback: 300 bars
- Show POC: ON
📦 Zones:
- Min Absorption Ratio: 2.0
- HVN Threshold: 1.5
- Max Zones: 8
🔄 Divergences:
- Pivot L/R: 9
- Early Warning: ON
- Early Right Bars: 3
- Min Bars Between: 40
- Min CVD Diff: 5%
```
### 5m Scalping
```
Profile Lookback: 100
POC Lookback: 200
Pivot L/R: 7
Early Warning Right: 2
Min Bars Between: 60
```
### 1H Swing Trading
```
Profile Lookback: 200
POC Lookback: 400-500
Pivot L/R: 12-14
Early Warning Right: 4-5
Min Bars Between: 30
Min CVD Diff: 8%
```
## 💡 How to Trade
### Setup 1: Divergence at Zone ⭐ (BEST - 75%+ win rate)
**Entry:**
- Price hits demand/supply zone
- Divergence appears (early or confirmed)
- Double confluence = high probability
**Example (Long):**
```
1. Price drops into green demand zone
2. ⚠️ Early bullish divergence fires
3. Enter long with tight stop below zone
4. Target: POC or next supply zone
```
**Risk/Reward:** 1:3 to 1:5
---
### Setup 2: POC Bounce/Rejection
**Entry:**
- Price approaches POC line
- Wait for reaction (bounce or rejection)
- Enter in direction of reaction
**Long Setup:**
```
1. Price pulls back to POC from above
2. POC acts as support
3. Bullish divergence appears (confirmation)
4. Enter long, stop below POC
```
**Short Setup:**
```
1. Price rallies to POC from below
2. POC acts as resistance
3. Bearish divergence appears
4. Enter short, stop above POC
```
**Risk/Reward:** 1:2 to 1:4
---
### Setup 3: Zone + Profile Confluence
**Entry:**
- Supply/demand zone aligns with thick profile bar
- Shows high CVD activity at that level
- Triple confluence = very high probability
**Example:**
```
1. Supply zone at 26,100
2. Profile shows heavy selling at 26,100
3. Price rallies to 26,100
4. Bearish divergence appears
5. Enter short
```
**Risk/Reward:** 1:4 to 1:6
---
### Setup 4: Early Warning Scalp ⚡
**Entry (Aggressive):**
- ⚠️ Early warning fires
- Price at zone or POC
- Enter immediately
- Tight stop (1-2 ATR)
**Management:**
```
- Take 50% profit at 1:1
- Move stop to breakeven
- 🔻 Confirmed signal → Trail stop
- Exit rest at target
```
**Risk/Reward:** 1:1.5 to 1:2
**Trades/day:** 3-8
---
### Setup 5: Multi-Timeframe (Advanced)
**Confirmation Required:**
```
Higher TF (1H):
- Confirmed divergence
- At major POC or zone
Lower TF (15m):
- Early warning triggers
- Entry with better timing
```
**Benefits:**
- HTF gives direction
- LTF gives entry
- Best of both worlds
**Risk/Reward:** 1:3 to 1:5
---
## 📊 Component Details
### CVD Profile
**What the colors mean:**
- **Blue bars** = Buying CVD (demand)
- **Orange bars** = Selling CVD (supply)
- **Lighter shade** = Value Area (70% CVD)
- **Thicker bar** = More volume at that price
**How to use:**
- Thick bars = Support/Resistance
- Profile shape shows market structure
- Balanced profile = range
- Skewed profile = trend
---
### Supply/Demand Zones
**How they're detected:**
1. High Volume Node (1.5x average)
2. CVD buy/sell ratio calculated
3. Ratio ≥ 2.0 → Zone created
4. Sorted by strength (top 8 shown)
**Zone labels show:**
- Type: "Demand" or "Supply"
- Ratio: "2.8:1" = strength
**Not like other indicators:**
- ❌ Other tools use price action alone
- ✅ This uses actual CVD absorption
- Shows WHERE limit orders defended levels
---
### Point of Control (POC)
**What it shows:**
- Price with highest CVD activity
- Market's "fair value"
- Dynamic S/R level
**How to use:**
- Price above POC = bullish bias
- Price below POC = bearish bias
- POC retest = trading opportunity
- POC cross = trend change signal
**Independent lookback:**
- Profile: 150 bars (short-term)
- POC: 300 bars (longer-term context)
- Gives stable, relevant POC
---
## 🔧 Settings Explained
### 📊 Profile Settings
**Lookback Bars** (150 default)
- How many bars for profile calculation
- Lower = more recent, reactive
- Higher = more historical, stable
**Profile Rows** (24 default)
- Granularity of distribution
- Lower = coarser (faster)
- Higher = finer detail (slower)
**Profile Position**
- Right: After current price
- Left: Before lookback period
- Current: At lookback start
**Value Area** (70% default)
- Highlights main CVD concentration
- 70% is standard
- Higher % = wider zone
---
### 🎯 POC Settings
**POC Lookback** (300 default)
- Independent from profile
- Longer = more stable POC
- Shorter = more reactive POC
**Show POC Line/Label**
- Toggle visibility
- Customize color/width
---
### 📦 Zone Settings
**Min Absorption Ratio** (2.0 default)
- Buy/Sell threshold for zones
- 2.0 = 2:1 ratio minimum
- Higher = fewer, stronger zones
**HVN Threshold** (1.5 default)
- Volume must be 1.5x average
- Higher = stricter filtering
- Lower = more zones
**Max Zones** (8 default)
- Limits display clutter
- Shows strongest N zones only
---
### 🔄 Divergence Settings
**Pivot Left/Right** (9/9 default)
- Bars to confirm pivot
- Higher = slower, more confirmed
- Lower = faster, less confirmed
**Early Warning**
- ON = Show early signals
- Early Right Bars (3 default)
- 3 = 6 bars faster than confirmed
**Filters:**
- Min Bars Between (40): Prevents spam
- Min CVD Diff % (5): Filters weak signals
**Visual:**
- Line styles: Solid/Dashed/Dotted
- Colors: Customize all 4 types
- Labels: Toggle ON/OFF
---
## 🎨 Color Customization
**Divergences:**
- Bullish Confirmed: Green (default)
- Bearish Confirmed: Red (default)
- Early Bullish: Purple (default)
- Early Bearish: Purple (default)
**Zones & Profile:**
- Bull/Demand: Green
- Bear/Supply: Red
- Buy CVD Profile: Blue
- Sell CVD Profile: Orange
- Value Area Up/Down: Lighter blue/orange
**POC:**
- POC Color: Yellow (default)
All customizable to your preference!
---
## 🔔 Alerts Available
**6 Alert Types:**
1. 🔻 Bearish Divergence (confirmed)
2. 🔺 Bullish Divergence (confirmed)
3. ⚠️ Early Bearish Warning
4. ⚠️ Early Bullish Warning
5. (Manual: POC cross)
6. (Manual: Zone touch)
**Setup:**
1. Click Alert (⏰)
2. Choose "CVD Zones & Divergence"
3. Select alert type
4. Configure notification
5. Create!
---
## 💎 Pro Tips
### From Experienced Traders:
**"Use zones with divergences for best setups"**
- Zone alone: 60% win rate
- Divergence alone: 65% win rate
- Both together: 75%+ win rate
**"POC is your friend"**
- Price tends to revert to POC
- Great target for counter-trend trades
- POC cross = potential trend change
**"Profile tells the story"**
- Thick bars = institutional levels
- Balanced profile = range-bound
- Skewed high = distribution (top)
- Skewed low = accumulation (bottom)
**"Early warnings for entries, confirmed for confidence"**
- Early = better entry price
- Confirmed = validation
- Use both in scale-in strategy
**"Filter by timeframe"**
- 1m-5m: Very fast, many signals
- 15m: Sweet spot for most traders
- 1H-4H: High quality, fewer signals
---
## 🔧 Tuning Guide
### Too Cluttered?
**Simplify:**
```
✅ Show Divergences: ON
✅ Show POC: ON
❌ Show Zones: OFF (or reduce to 4-5)
❌ Show Value Area: OFF
❌ Divergence Labels: OFF
→ Clean chart with just lines + POC
```
### Missing Opportunities?
**More Signals:**
```
↓ Pivot Right: 6-7
↓ Early Warning Right: 2
↓ Min Bars Between: 25-30
↓ Min CVD Diff: 2-3%
↓ Min Absorption Ratio: 1.8
```
### Too Many False Signals?
**Stricter Filters:**
```
↑ Pivot Right: 12-15
↑ Min Bars Between: 60
↑ Min CVD Diff: 8-10%
↑ Min Absorption Ratio: 2.5
↓ Max Zones: 4-5
```
### POC Not Making Sense?
**Adjust POC Lookback:**
```
If too high: Increase to 400-500
If too low: Increase to 400-500
If jumping around: Increase to 500+
→ Longer lookback = more stable POC
```
---
## ❓ FAQ
**Q: Difference from CVD Divergence (standalone)?**
A: This is the **complete package**:
- Divergence tool = divergences only
- This = divergences + POC + profile + zones
- Use divergence tool for clean charts
- Use this for full analysis
**Q: Too slow/laggy?**
A: Reduce computational load:
```
Profile Rows: 18 (from 24)
Lookback: 100 (from 150)
Max Zones: 5 (from 8)
```
**Q: No volume data error?**
A: Symbol has no volume
- Works: Futures, stocks, crypto
- Maybe: Forex (broker-dependent)
- Doesn't work: Some forex pairs
**Q: Can I use just some features?**
A: Absolutely! Toggle what you want:
```
Zones only: Turn off divergences + POC
POC only: Turn off zones + divergences
Divergences only: Turn off zones + POC + profile
Mix and match as needed!
```
**Q: Best timeframe?**
A:
- **1m-5m**: Scalping (busy, many signals)
- **15m**: Day trading ⭐ (recommended)
- **1H-4H**: Swing trading (quality signals)
- **Daily**: Position trading (very selective)
**Q: Works on crypto/forex/stocks?**
A:
- ✅ Futures: Excellent
- ✅ Stocks: Excellent
- ✅ Crypto: Very good (major pairs)
- ⚠️ Forex: Depends on broker volume
---
## 📈 Performance Expectations
### Realistic Win Rates
| Strategy | Win Rate | Avg R/R | Trades/Week |
|----------|----------|---------|-------------|
| Early warnings only | 55-65% | 1:1.5 | 15-30 |
| Confirmed only | 70-80% | 1:2 | 8-15 |
| Divergence + Zone | 75-85% | 1:3 | 5-12 |
| Full confluence (all 4) | 80-90% | 1:4+ | 3-8 |
**Keys to success:**
- Don't trade every signal
- Wait for confluence
- Proper risk management
- Trade what you see, not what you think
---
## 🚀 Quick Start
**New User (5 minutes):**
1. ✅ Add to 15m chart
2. ✅ Default settings work well
3. ✅ Watch for 1 week (don't trade yet!)
4. ✅ Note which setups work best
5. ✅ Backtest on 50+ signals
6. ✅ Start with small size
7. ✅ Scale up slowly
**First Trade Checklist:**
- Divergence + Zone/POC = confluence
- Clear S/R level nearby
- Risk/reward minimum 1:2
- Position size = 1% risk max
- Stop loss placed
- Target identified
- Journal entry ready
---
## 📊 What Makes This Special?
**Most indicators:**
- Use RSI/MACD divergences (lagging)
- Guess at S/R zones (subjective)
- Don't show actual order flow
**This indicator:**
- Uses real CVD (actual volume delta)
- Absorption-based zones (real orders)
- Profile shows distribution (real activity)
- POC shows equilibrium (real fair value)
- All from one data source (coherent)
**Result:**
- Everything aligns
- No conflicting signals
- True order flow analysis
- Professional-grade toolkit
---
## 🎯 Trading Philosophy
**Remember:**
- Indicator shows you WHERE to look
- YOU decide whether to trade
- Quality over quantity always
- Risk management is #1
- Patience beats aggression
**Best trades have:**
- ✅ Multiple confluences
- ✅ Clear risk/reward
- ✅ Obvious invalidation point
- ✅ Aligned with trend/context
**Worst trades have:**
- ❌ Single signal only
- ❌ Poor location (middle of nowhere)
- ❌ Unclear stop placement
- ❌ Counter to all context
---
## ⚠️ Risk Disclaimer
**Important:**
- Past performance ≠ future results
- All trading involves risk
- Only risk what you can afford to lose
- This is a tool, not financial advice
- Use proper position sizing
- Keep a trading journal
- Consider professional advice
**Your responsibility:**
- Which setups to trade
- Position size
- Entry/exit timing
- Risk management
- Emotional control
**Success = Tool + Strategy + Discipline + Risk Management**
---
## 📝 Version History
**v1.0** - Current Release
- CVD divergences (confirmed + early warning)
- Point of Control (independent lookback)
- CVD profile histogram
- Supply/demand absorption zones
- Value area visualization
- 6 alert types
- Full customization
---
## 💬 Community
**Questions?** Drop a comment below
**Success story?** Share with the community
**Feature request?** Let me know
**Bug report?** Provide details in comments
---
**Happy Trading! 🚀📊**
*Professional order flow analysis in one indicator.*
**Like this?** ⭐ Follow for more quality tools! Indicateur
SVP + candle + Max volume [midst]
SVP + DALY CANDLE + MAX VOLUME
A comprehensive trading indicator that combines Session Volume Profile (SVP), Higher Timeframe (HTF) Candles, and Intrabar Max Volume Price Detection into one powerful tool. Perfect for traders who want to understand price action, volume distribution, and key levels all in one place.
KEY FEATURES
Session Volume Profile
• Real-time volume distribution across price levels for the current session
• Point of Control (POC) - identifies the price with the highest traded volume
• Value Area High (VAH) & Low (VAL) - shows where 70% of the volume occurred (customizable percentage)
• Color-coded volume bars - distinguish between up volume (bullish) and down volume (bearish)
• Value area highlighting - clearly see the most important price zones
Higher Timeframe Candle Display
• Visual daily (or custom timeframe) candle overlaid on your current chart
• OHLC labels - see Open, High, Low, and Close prices clearly marked
• Fully customizable colors - separate colors for bullish/bearish bodies, borders, and wicks
• Adjustable positioning - move the candle and labels to your preferred location
Max Volume Price Detection
• Identifies the exact price level with maximum volume within each bar
• Uses Lower Timeframe (LTF) data for precise volume analysis (Premium+ required)
• Simple mode fallback - works on all TradingView plans
• Previous max volume marker - displays previous bar's max volume as a reference dot
• Real-time calculation - updates as each bar forms
ATR Table
• Dynamic ATR-based stop levels - automatically calculates potential stop-loss levels
• Multiple smoothing methods - RMA, SMA, EMA, WMA
• Customizable multiplier - adjust for your risk tolerance
• Clean table display - shows ATR value, high stop, and low stop
PERFECT FOR
Day traders analyzing intrabar volume distribution
Swing traders wanting HTF context on lower timeframes
Volume profile traders looking for key support/resistance levels
Price action traders seeking high-probability entry zones
HOW TO USE
Volume Profile Analysis
POC often acts as a magnet for price. VAH/VAL are key support/resistance levels. High volume nodes indicate strong price acceptance, while low volume nodes suggest potential breakout zones.
HTF Candle Context
See daily range while trading on 5m-1h charts. Daily open often acts as pivot point. Daily high/low are key levels to watch.
Max Volume Price
Black line shows where most volume traded in each bar. Previous max volume (dot) helps identify institutional activity. Clusters of max volume create strong support/resistance. Can possibly indicate a Wick bounce
ATR Stops
Use ATR-based levels for logical stop placement. Adjust multiplier based on market volatility.
SETTINGS & CUSTOMIZATION
Positioning
Control the global offset to move both candle and profile together. Fine-tune with individual offsets for candle and profile spacing.
Volume Profile
Adjustable number of rows (50-500) for granular or simplified view. Customizable width and placement (left/right). Value Area percentage control. Full color customization for all volume components.
HTF Candle
Any timeframe selection (default: Daily). Full color customization for bull/bear candles. Adjustable candle width. Toggle OHLC labels on/off. Control label distance and line widths.
Max Volume Price
Choose between Simple (all plans) or LTF mode (Premium+). Auto or manual LTF resolution. Custom color and line width. Toggle current and previous markers independently.
TECHNICAL NOTES
Maximum 5000 bars lookback for volume calculations
Works on all timeframes
LTF max volume requires TradingView Premium or higher
Optimized for performance with efficient array operations
For best results, use on liquid instruments with reliable volume data
Most effective on intraday charts (5min-1hour) for day trading and scalping strategies
For Entertainment and information only
Created by midst Indicateur

Indicateur

Multi-Distribution Volume Profile (Zeiierman)█ Overview
Multi-Distribution Volume Profile (Zeiierman) is a flexible, structure-first volume profile tool that lets you reshape how volume is distributed across price, from classic uniform profiles to advanced statistical curves like Gaussian, Lognormal, Student-t, and more.
Instead of forcing every market into a single "one-size-fits-all" profile, this tool lets you model how volume is likely concentrated inside each bar (body vs wicks, midpoint, tails, center bias, right-skew, heavy tails, etc.) and then stacks that behavior across a whole lookback window to build a rich, multi-distribution map of traded activity.
On top of that, it overlays a dynamic Center Band (value area) and a fade/gradient model that can color each price row by volume, hits, recency, volatility, reversals, or even liquidity voids, turning a plain profile into a multi-dimensional context map.
Highlights
Choose from multiple Profile Build Modes , including uniform, body-only, wick-only, midpoint/close/open, center-weighted, and a suite of probability-style distributions (Gaussian, Lognormal, Weibull, Student-t, etc.)
Flexible anchor layout: draw the profile on Right/Left (horizontal) or Bottom/Top (vertical) to fit any chart layout
Value Area / Center Band computed from volume quantiles around the POC.
Gradient-based Fade Metrics: volume, price hits, freshness (time decay), volatility impact, dwell time, reversal density, compression, and liquidity voids
Separate bullish vs bearish volume at each price row for directional structure insights
█ How It Works
⚪ Profile Construction
The script scans a user-defined Bars Included window and finds the full high–low span of that zone. It then divides this range into a user-controlled number of Price Levels (rows).
For each historical bar within the window:
It measures the candle’s price range, body, and wicks.
It assigns volume to rows according to the selected Profile Build Mode, for example:
* Range Uniform – volume spread evenly across the full high–low range.
* Range Body Only / Range Wick Only – concentrate volume inside the body or wicks only.
* Midpoint / Close / Open Only – allocate volume entirely into one price row (pinpoint modeling).
HL2 / Body Center Weighted – center weights around the middle of the range/body.
Recent-Weighted Volume – amplify newer bars using exponential time decay.
Volume Squared (Hard) – aggressively boost bars with large volume.
Up Bars Only / Down Bars Only – filter volume to only bullish or bearish bars.
For more advanced shapes, the script uses continuous distributions across the bar’s span:
Linear, Triangular, Exponential to High
Cosine Centered, PERT
Gaussian, Lognormal, Cauchy, Laplace
Pareto, Weibull, Logistic, Gumbel
Gamma, Beta, Chi-Square, Student-t, F-Shape
Each distribution produces a weight for each row within the bar’s range, normalized so the total volume remains consistent, but the shape of where that volume lands changes.
⚪ POC & Center Band (Value Area)
Once all rows are accumulated:
The row with the highest total volume becomes the Point of Control (POC)
The script computes cumulative volume and finds the band that wraps a user-defined Center of Profile % (e.g., 68%) around the center of distribution.
This range is displayed as a central band, often treated like a value area where price has spent the most “effort” trading.
⚪ Gradient Fade Engine
Each row also gets a fade metric, chosen in Fade Metric:
Volume – opacity based on relative volume.
Price Hits – how frequently that row was touched.
Blended (Vol+Hits) – average of volume & hits.
Freshness – emphasizes recent activity, controlled by Decay.
Volatility Impact – rows that saw larger ranges contribute more.
Dwell Time – where price “camped” the longest.
Reversal Density – where direction changes cluster.
Compression – tight-range compression zones.
Liquidity Void – inverse of volume (thin liquidity zones).
When Apply Gradient is enabled, the row’s bullish/bearish colors are tinted from faint to strong based on this chosen metric, effectively turning the profile into a heatmap of your chosen structural property.
█ How to Use
⚪ Explore Different Distribution Assumptions
Switch between multiple Profile Build Modes to see how your assumptions about intrabar volume affect structure:
Use Range Uniform for classical profile reading.
Deploy Gaussian, Logistic, or Cosine shapes to emphasize central clustering.
Try Pareto, Lognormal, or F-Shape to focus on tail / extremal activity.
Use Recent-Weighted Volume to prioritize the most recent structural behavior.
This is especially useful for traders who want to test how different modeling assumptions change perceived value areas and levels of interest.
⚪ Identify Value, Acceptance & Rejection Zones
Use the POC and Center of Profile (%) band to distinguish:
High-acceptance zones – wide central band, thick rows, strong gradient → fair value areas
Rejection zones & tails – thin extremes, low dwell time, high volatility or reversal density
These regions can be used as:
Targets and origin zones for mean reversion
Context for breakout validation (leaving value)
Bias reference for intraday rotations or swing rotations
⚪ Read Directional Structure Within the Profile
Because each row is split into bullish vs bearish contributions, you can visually read:
Where buyers dominated a price region (large bullish slice)
Where sellers absorbed or defended (large bearish slice)
Combining this with Fade Metrics like Reversal Density, Dwell Time, or Freshness turns the profile into a structural order-flow map, without needing raw tick-by-tick volume data.
⚪ Use Fade Metrics for Contextual Heatmaps
Each Fade Metric can be used for a different analytical lens:
Volume / Blended – emphasize where volume and activity are concentrated.
Freshness – highlight the most recently active zones that still matter.
Volatility Impact & Compression – spot areas of explosive moves vs coiled ranges.
Reversal Density – locate micro turning points and battle zones.
Liquidity Void – visually pop out thin regions that may act as speedways or magnets.
█ Settings
Profile Build Mode – Selects how each bar’s volume is distributed across its price range (uniform, body/wick, midpoint/close/open, center-weighted, or statistical distribution families).
Bars Included – Number of bars used to build the profile from the current bar backward.
Price Levels – Vertical resolution of the profile: more levels = smoother but heavier.
Anchor Side – Where the profile is drawn on the chart: Right, Left, Bottom, or Top.
Offset (bars) – Horizontal offset from the last bar to the profile when using Right/Left modes.
Apply Gradient – Toggles the fade/heatmap coloring based on the selected metric.
Fade Metric – Chooses the property driving row opacity (Volume, Hits, Freshness, Volatility Impact, Dwell Time, Reversal Density, Compression, Liquidity Void).
Decay – Time-decay factor for Freshness (values close to 1 keep older activity relevant for longer).
Profile Thickness – Relative thickness of the profile along the time axis, as a % of the lookback window.
Center of Profile (%) – Volume percentage used to define the central band (value area) around the POC.
-----------------
Disclaimer
The content provided in my scripts, indicators, ideas, algorithms, and systems is for educational and informational purposes only. It does not constitute financial advice, investment recommendations, or a solicitation to buy or sell any financial instruments. I will not accept liability for any loss or damage, including without limitation any loss of profit, which may arise directly or indirectly from the use of or reliance on such information.
All investments involve risk, and the past performance of a security, industry, sector, market, financial product, trading strategy, backtest, or individual's trading does not guarantee future results or returns. Investors are fully responsible for any investment decisions they make. Such decisions should be based solely on an evaluation of their financial circumstances, investment objectives, risk tolerance, and liquidity needs.
Indicateur

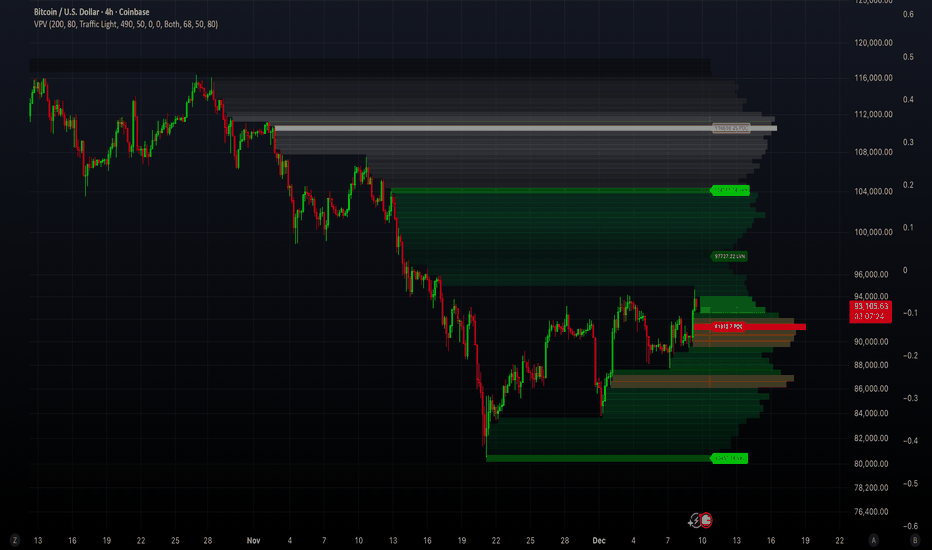
Volume Profile VisionVolume Profile Vision - Complete Description
Overview
Volume Profile Vision (VPV) is an advanced volume profile indicator that visualizes where trading activity has occurred at different price levels over a specified time period. Unlike traditional volume indicators that show volume over time, this indicator displays volume distribution across price levels, helping traders identify key support/resistance zones, fair value areas, and potential reversal points.
What Makes This Indicator Original
Volume Profile Vision introduces several unique features not found in standard volume profile tools:
Dual-Direction Histogram Display:
Unlike conventional volume profiles that only show bars extending in one direction, VPV displays volume bars extending both left (into historical candles) and right (as a traditional histogram). This bi-directional approach allows traders to see exactly where historical price action intersected with high-volume nodes.
Real-Time Candle Highlighting: The indicator dynamically highlights volume bars that intersect with the current candle's price range, making it immediately obvious which volume levels are currently in play.
Four Professional Color Schemes: Each color scheme uses distinct gradient algorithms and visual encoding systems:
Traffic Light: Uses red (POC), green (VA boundaries), yellow (HVN), with grayscale gradients outside the value area
Aurora Glass: Modern cyan-to-magenta gradient with hot magenta POC highlighting
Obsidian Precision: Professional dark theme with white POC and electric cyan accents
Black Ice: Monochromatic cyan family with graduated intensity
Adaptive Transparency System: Automatically adjusts bar transparency based on position relative to value area, with special handling for each color scheme to maintain visual clarity.
Core Concepts & Calculations
Volume Distribution Analysis
The indicator divides the visible price range into user-defined price levels (default: 80 levels) and calculates the total volume traded at each level by:
Scanning back through the specified lookback period (customizable or visible range)
For each historical bar, determining which price levels the bar's high/low range intersects
Accumulating volume for each intersected price level
Optionally filtering by bullish/bearish volume only
Point of Control (POC)
The POC is the price level with the highest traded volume during the analyzed period. This represents the "fairest" price where most traders agreed on value. The indicator marks this with distinct coloring (red in Traffic Light, magenta in Aurora Glass, white in Obsidian Precision, cyan in Black Ice).
Trading Significance: POC acts as a strong magnet for price - markets tend to return to fair value. When price is away from POC, traders watch for:
Mean reversion opportunities when price is far from POC
Rejection signals when price tests POC from above/below
Breakout confirmation when price breaks through and holds beyond POC
Value Area (VA)
The Value Area encompasses the price range where a specified percentage (default: 68%) of all volume traded. This represents the range of "accepted value" by market participants.
Calculation Method:
Start at the POC (highest volume level)
Expand upward and downward, adding adjacent price levels
Always add the level with higher volume next
Continue until accumulated volume reaches the VA percentage threshold
Value Area High (VAH): Upper boundary of accepted value - acts as resistance
Value Area Low (VAL): Lower boundary of accepted value - acts as support
Trading Significance:
Price spending time inside VA indicates market equilibrium
Breakouts above VAH suggest bullish momentum shift
Breakdowns below VAL suggest bearish momentum shift
Returns to VA boundaries often provide high-probability entry zones
High Volume Nodes (HVN)
Price levels with volume exceeding a threshold percentage (default: 80%) of POC volume. These represent areas of strong agreement and consolidation.
Trading Significance:
HVNs act as strong support/resistance zones
Price tends to consolidate at HVNs before making directional moves
Breaking through an HVN often signals strong momentum
Low Volume Nodes (LVN)
Price levels within the Value Area with volume ≤30% of POC volume. These are zones price moved through quickly with minimal consolidation.
Trading Significance:
LVNs represent areas of rejection - price finds little acceptance
Price tends to move rapidly through LVN zones
Useful for setting stop-losses (below LVN for longs, above for shorts)
Can identify potential gaps or "air pockets" in the market structure
Grayscale POC Detection
A secondary POC detection system identifies the highest volume level outside the Value Area (with a 2-level buffer to avoid confusion). This helps identify significant volume accumulation zones that exist beyond the main value area.
How to Use This Indicator
Setup
Choose Lookback Period:
Enable "Use Visible Range" to analyze only what's on your chart
Or set "Fixed Range Lookback Depth" (default: 200 bars) for consistent analysis
Adjust Profile Resolution:
"Number of Price Levels" (default: 80) - higher = more granular analysis, lower = broader zones
Select Color Scheme:
Traffic Light: Best for clear POC/VA/HVN identification
Aurora Glass: Modern aesthetic for dark charts
Obsidian Precision: Professional trader preference
Black Ice: Minimalist single-color family
Visual Customization
Left Extension: How far back the left-side histogram extends into historical candles (default: 490 bars)
Right Extension: Width of the traditional histogram bars on the right (default: 50 bars)
Right Margin: Space between current price bar and histogram (default: 0 for flush alignment)
Left Profile Gap: Space between left-side histogram and candles (default: 0)
Trading Strategies
Strategy 1: Value Area Mean Reversion
Wait for price to move outside the Value Area (above VAH or below VAL)
Look for rejection signals (wicks, bearish/bullish candles)
Enter trades toward the POC
Take profits as price returns to POC or opposite VA boundary
Strategy 2: Breakout Confirmation
Identify when price is consolidating within the Value Area
Wait for a strong close above VAH (bullish) or below VAL (bearish)
Enter on the breakout or on first pullback to the VA boundary
Target previous HVNs or swing highs/lows outside the VA
Strategy 3: POC Support/Resistance
Watch for price approaching the POC level
If approaching from below, look for bullish reversal patterns at POC (support)
If approaching from above, look for bearish reversal patterns at POC (resistance)
Trade in the direction of the bounce with stops beyond the POC
Strategy 4: LVN Fast Movement Zones
Identify LVN zones within the Value Area (marked with "LVN" label)
When price enters an LVN, expect rapid movement through the zone
Avoid entering trades within LVNs
Use LVNs as confirmation of directional momentum
Alert System
The indicator includes 7 customizable alert conditions:
POC Touch: Alerts when price comes within 0.5 ATR of POC
VAH/VAL Touch: Alerts at Value Area boundaries
VA Breakout: Alerts on breakouts above VAH or below VAL
HVN Touch: Alerts when price contacts High Volume Nodes
LVN Entry: Alerts when entering Low Volume zones
POC Shift: Alerts when POC moves to a new price level
Reading the Profile
Price Labels (shown on the right side):
POC: Point of Control - highest volume price level
VAH: Value Area High - upper boundary of accepted value
VAL: Value Area Low - lower boundary of accepted value
LVN: Low Volume Node - expect fast movement through this zone
Color Intensity Interpretation:
Brighter colors = higher volume concentration
Dimmer colors = lower volume
Abrupt color changes = transition between volume zones
Gaps in the histogram = price levels with no trading activity
Technical Details
Volume Accumulation Logic:
For each bar in lookback period:
For each price level:
If bar's high/low range intersects price level:
Add bar's volume to that price level's total
Gradient Algorithm:
Traffic Light: Dual-range piecewise gradient (0-50% and 50-100% volume intensity)
Aurora Glass: Linear cyan-to-magenta interpolation
Obsidian Precision: Dark blue gradient with cyan highlights
Black Ice: Three-stage cyan intensity progression
Real-Time Updates:
The profile recalculates on every bar, including real-time tick data, ensuring the volume distribution always reflects current market structure.
Best Practices
Timeframe Selection: Use higher timeframes (4H, Daily) for swing trading, lower timeframes (5min, 15min) for day trading
Combine with Price Action: Volume profile shows WHERE, price action shows WHEN
Multiple Timeframe Analysis: Check daily VP for major levels, then drill down to intraday for entries
Volume Type Selection: Use "Bullish" volume in uptrends, "Bearish" in downtrends, or "Both" for complete picture
Adjust VA Percentage: 68% (default) captures one standard deviation; try 70% for tighter or 60% for broader value areas
Performance Notes
Maximum bars back: 5000 (handles deep historical analysis)
Maximum boxes: 500 (handles complex profiles)
Optimized calculation: Only recalculates on last bar for efficiency
Real-time capable: Updates as new ticks arrive Indicateur
Indicateur

Price Volume Heatmap [MHA Finverse]Price Volume Heatmap - Advanced Volume Profile Analysis
Unlock the power of institutional-level volume analysis with the Price Volume Heatmap indicator. This sophisticated tool visualizes market structure through volume distribution across price levels, helping you identify key support/resistance zones, high-probability reversal areas, and optimal entry/exit points.
🎯 What Makes This Indicator Unique?
Unlike traditional volume indicators that only show volume over time, this heatmap displays volume distribution across price levels , revealing where the most significant trading activity occurred. The gradient coloring system instantly highlights high-volume nodes (areas of strong interest) and low-volume nodes (potential breakout zones).
📊 Core Features
1. Dynamic Volume Heatmap
- Visualizes volume concentration across 250 customizable price levels
- Gradient color scheme from high volume (white) to low volume (teal/green)
- Adjustable brightness multiplier for enhanced contrast and clarity
- Real-time updates as market conditions evolve
2. Point of Control (POC)
- Automatically identifies the price level with the highest traded volume
- Acts as a magnetic price level where markets often return
- Critical for identifying fair value areas and potential reversal zones
- Customizable line style, width, and color
3. Flexible Lookback Settings
- Lookback Bars: Set any value from 1-5000 bars to control analysis depth
- Visible Range Mode: Analyze only what's currently visible on your chart
- Timeframe-Specific Settings: Different lookback periods for 1m, 5m, 15m, 30m, 1h, Daily, and Weekly charts
- Adapts to your trading style - scalping to position trading
4. Session Separation Analysis
- Tokyo Session: 00:00-09:00 UTC
- London Session: 07:00-16:00 UTC
- New York Session: 13:00-22:00 UTC
- Sydney Session: 21:00-06:00 UTC
- Daily Reset: Analyze each trading day independently
Session separation allows you to understand volume distribution specific to each major trading session, revealing institutional order flow patterns and session-specific support/resistance levels.
5. Profile Width Options
- Dynamic: Profile width adjusts based on lookback period
- Fixed Bars: Set a specific bar count for consistent profile width
- Extend Forward: Project the profile into future bars for planning trades
6. Smart Alerts
- POC crossover/crossunder alerts
- New session start notifications
- Never miss critical price action at high-volume nodes
📈 How to Use This Indicator Professionally
Understanding Market Structure:
High Volume Nodes (HVN):
- Appear as bright/white areas in the heatmap
- Represent price levels where significant trading occurred
- Act as strong support/resistance zones
- Markets often consolidate or bounce from these levels
- Trading Strategy: Look for entries when price tests HVN areas with confluence from other indicators
Low Volume Nodes (LVN):
- Appear as darker/teal areas in the heatmap
- Represent price levels with minimal trading activity
- Price tends to move quickly through these areas
- Often form "gaps" in the volume profile
- Trading Strategy: Expect rapid price movement through LVN zones; avoid placing stop losses here
Point of Control (POC):
- The single most important price level in your analysis window
- Represents the fairest price where maximum volume traded
- Price gravitates toward POC like a magnet
- Trading Strategy:
* When price is above POC: bullish bias, POC acts as support
* When price is below POC: bearish bias, POC acts as resistance
* POC breaks often lead to significant trend changes
Session-Based Analysis:
Use session separation to understand how different market participants trade:
Asian Session (Tokyo/Sydney):
- Typically lower volatility and range-bound
- Volume profiles often show tight, balanced distribution
- Use for identifying overnight ranges and gap fill zones
London Session:
- Highest volume session for forex pairs
- Often shows strong directional bias
- Look for breakouts from Asian ranges during London open
New York Session:
- Maximum participation when overlapping with London
- Institutional order flow most visible
- POC during NY session often becomes key level for following sessions
🎯 Practical Trading Applications
1. Identifying Support & Resistance:
High volume nodes from the heatmap are far more reliable than traditional swing highs/lows. When price approaches an HVN, expect reaction - either a bounce or a significant breakout if breached.
2. Trend Confirmation:
- Healthy uptrend: POC rising over time, HVN forming at higher levels
- Healthy downtrend: POC falling over time, HVN forming at lower levels
- Consolidation: POC relatively flat, volume balanced across range
3. Breakout Trading:
When price breaks through a Low Volume Node with momentum, it often continues to the next High Volume Node. Use LVN areas as measured move targets.
4. Reversal Zones:
Multiple HVN stacking on top of each other creates a "volume shelf" - an extremely strong support/resistance zone where reversals are highly probable.
5. Risk Management:
- Place stops beyond HVN areas (not within LVN zones)
- Size positions based on distance to nearest HVN
- Use POC as trailing stop level in trending markets
⚙️ Recommended Settings
For Day Trading (Scalping/Intraday):
- Lookback: 200-500 bars
- Rows: 200-250
- Enable session separation for your primary trading session
- Profile Width: Dynamic or Fixed Bars (30-50)
For Swing Trading:
- Lookback: 500-1000 bars
- Rows: 250
- Session separation: Daily Reset
- Profile Width: Dynamic
For Position Trading:
- Lookback: 1000-3000 bars
- Rows: 250
- Use timeframe-specific settings
- Profile Width: Extend Forward (20-50 bars)
💡 Pro Tips
1. Combine this indicator with price action analysis - volume confirms what price is telling you
2. Watch for POC convergence with other technical levels (fibonacci, pivot points, moving averages)
3. Volume at extremes (tops/bottoms of heatmap) often indicates exhaustion
4. Session POC from previous sessions often acts as magnet for current session
5. Increase brightness multiplier (1.5-2.5) for clearer visualization on busy charts
6. Use "Number of Sessions to Display" to analyze consistency of volume levels across multiple sessions
🎨 Customization
Fully customizable visual appearance:
- Gradient colors for volume visualization
- POC line thickness, color, and style
- Session line colors and visibility
- All settings organized in intuitive groups
⚠️ Disclaimer
This indicator is a technical analysis tool and should not be used as the sole basis for trading decisions. Always combine volume analysis with proper risk management, fundamental analysis, and other technical indicators. Past performance does not guarantee future results.
---
Support & Updates
Regular updates and improvements are made to enhance functionality. For questions, suggestions, or bug reports, please use the comments section below.
Happy Trading! 📊💹 Indicateur

MACD Momentum Structure & Volume Profile Sniper [MTF]**Description and Methodology**
This script offers a unique approach to Market Structure by moving away from traditional fractal-based highs and lows (which can be noisy). Instead, it utilizes **MACD Momentum Swings** to identify significant structural points, combined with an automated Fixed Range Volume Profile to pinpoint high-probability entry zones.
**1. Why MACD Structure? (The Core Concept)**
Traditional "ZigZag" or Fractal indicators rely solely on price action, often leading to fake-outs during low-volume consolidation.
* This script defines a "Swing High" only when the MACD Histogram crosses below zero (Momentum shifts Bearish).
* This script defines a "Swing Low" only when MACD crosses above zero (Momentum shifts Bullish).
By linking structure to momentum, we filter out weak price movements and focus on the true "heartbeat" of the trend.
**2. The "Mashup" Synergy: Structure + Volume + Logic**
This is not a random combination of indicators. Each component serves a specific step in the trading execution sequence:
* **Step 1 (Structure):** The script identifies a Change of Character (CHoCH) based on the MACD peaks described above.
* **Step 2 (Liquidity/Value):** When a CHoCH occurs, the script *automatically* draws a **Fixed Range Volume Profile (FRVP)** specifically covering the impulse leg that caused the break. This reveals the "Point of Control" (POC)—the hidden price level where the most volume occurred during the move.
* **Step 3 (The Sniper Entry):** The script creates a "Zone" around that POC. It then waits for Price to retrace into this zone.
* **Step 4 (Confirmation):** Once the zone is touched, the script monitors a lower timeframe (User selectable, default M1) for a fresh MACD crossover to trigger the final entry signal.
**Features**
* **Multi-Timeframe Dashboard:** Monitor the MACD Trend direction across 4 different timeframes simultaneously.
* **Dynamic Trendlines:** Automatically connects confirmed MACD peaks to visualize trend integrity.
* **Fibo Time Zones:** Projects potential future pivot points based on the duration of the previous swing.
* **Alert System:** Integrated alerts for Zone Touches and "Sniper" entries (Zone Touch + LTF Momentum Confirmation).
**How to Use**
1. **Identify Trend:** Look for the CHoCH labels. Green indicates a shift to Bullish, Red to Bearish.
2. **Wait for Pullback:** Do not chase the break. Wait for price to return to the Yellow POC Zone generated by the Volume Profile.
3. **Entry Trigger:** Watch for the "BUY" or "SELL" marks. These appear only when price hits the zone AND the lower-timeframe momentum aligns with the trade direction.
**Settings & Inputs**
* **Global MACD:** Adjust the sensitivity of the swing detection (Default 12, 26, 9).
* **Sniper Entry:** Select the timeframe used for the final confirmation (e.g., use M1 confirmation for an H1 chart structure).
* **VP Settings:** Customize how the Volume Profile looks on the chart.
*Disclaimer: This script is intended for educational purposes and market analysis. It does not provide financial advice.*
Indicateur