Indicateur
Prix Moyen Pondéré par le Volume (PMPV)

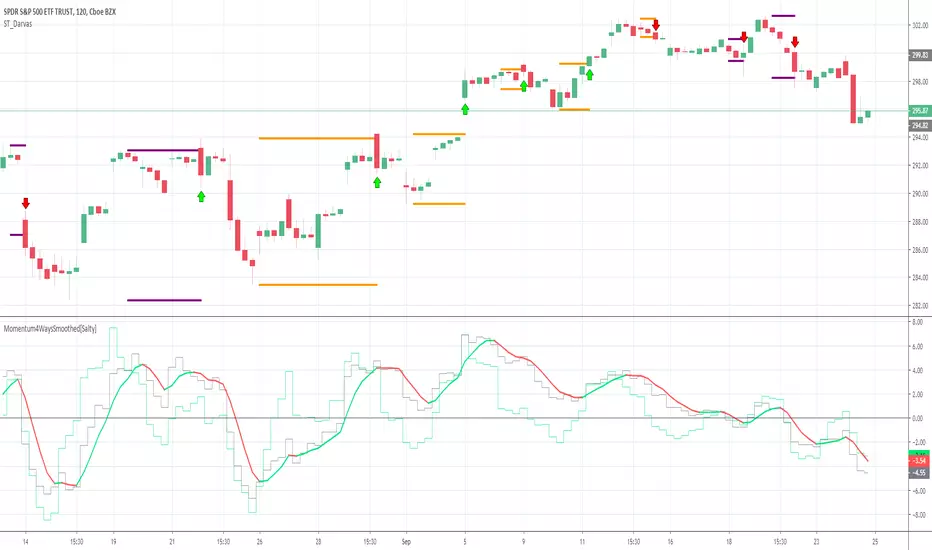
Momentum 4 Ways Smoothed [Salty]This is an enhance version of Momentum 4 Ways that shows 4 ways to calculate momentum and display each one along with their combined average value.
This study was created to compare 4 different momentum values against their combined average using different display styles to allow the user to experiment with different views of momentum.
- Added the ability to smooth the Average Momentum value. Default Smoothing value is 5.
- Added the ability to use different average calculations. Default is
Indicateur
VWAP/MVWAP/EMA CROSSOVEROnly difference in this one is that a EMA is used which should give quicker signals but theres a chance for more false signals as per usual use TA and other indicators to confirm positions. So far I've been liking the Vortex Indicator
When the VWAP (Thick Yellow) AND the two EMA (Orange and thin Yellow) cross above the MVWAP (Purple) then you will be in a uptrend that could possibly continue upwards. The opposite is true if you are looking a short opportunity, wait for the three other lines to
Indicateur

VWAP/MVWAP/SMA CROSSOVERTo use this indicator is simple.
When the VWAP (Thick Yellow) AND the two SMA (Orange and thin Yellow) cross above the MVWAP (Purple) then you will be in a uptrend that could possibly continue upwards. The opposite is true if you are looking a short opportunity, wait for the three other lines to cross under the MVWAP and you should be in a downtrend that could possibly continue downwards
Of course as with all indicators not every signal will be 100% accurate there is no way to predict human em
Indicateur

Anchored VWAP & Standard DeviationsCalculates VWAP from a fixed point in time as well as standard deviations.
--------------------------------------
If you find it useful please consider a tip/donation :
BTC - 3BMEXEDyWJ58eXUEALYPadbn1wwWKmf6sA
--------------------------------------
Indicateur

All Time VWAP & Standard DeviationsAll time VWAP and standard deviations.
Either enable "scale price chart only" or disable deviations that go negative in the style options.
--------------------------------------
If you find it useful please consider a tip/donation :
BTC - 3BMEXEDyWJ58eXUEALYPadbn1wwWKmf6sA
--------------------------------------
Indicateur

Tabajara com Nutella [xdecow]Tabajara setup from André Machado
-ma 8
-ma 20
-ma 50
-ma 200 (blue)
-vwap (aqua)
-bollinger bands
-barcolor based on tabajara rules
Indicateur

Indicateur

VWAPStrategyCross ema3 with VWAP. Just to give imression of how a day migth be divided in a long- and short bias zone. Not suited as trading signal.
Stratégie

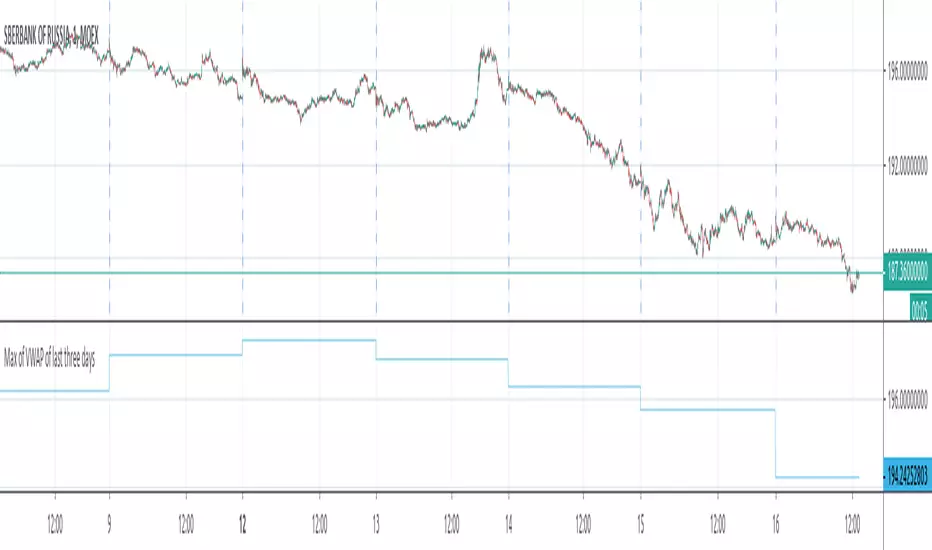
Max of VWAP of last three daysThe script searches for max values of last three days and then calculates average of those values
Indicateur
VWAP/ MVWAPPlots VWAP and MVWAP for intraday trading. Useful to avoid whipsaws
Market structure is important to take any trades
Avoid taking trades close to support and resistance
Indicateur

6 EMAs + VWAP by Felipe FacchinIndicador personalizado com 6 EMAs + VWAP. Recomendo utilização do tema escuro e EMAs 50, 100 e 200.
Indicateur

Weekly VWAP - Starts Monday 12AMThere are a number of VWAP indicators out there, but it's difficult to find VWAP calculations that take the entire week into account. This helps with analyzing longer-term trends on daily and intraday charts. As with all VWAP indicators, this one is also more sensitive to price starting at the open of trading at the beginning of the week.
Indicateur

VWAP + SMA + EMA3-in-one indicator, for swing and intra-day trading, which includes
Simple Moving Average (SMA)
Exponential Moving Average (EMA)
Volume-Weighted Average Price (VWAP)
Indicateur

Volume Profile Free Ultra SLI (100 Levels Value Area VWAP) - RRBVolume Profile Free Ultra SLI by RagingRocketBull 2019
Version 1.0
This indicator calculates Volume Profile for a given range and shows it as a histogram consisting of 100 horizontal bars.
This is basically the MAX SLI version with +50 more Pinescript v4 line objects added as levels.
It can also show Point of Control (POC), Developing POC, Value Area/VWAP StdDev High/Low as dynamically moving levels.
Free accounts can't access Standard TradingView Volume Profile, hence this indicator.
There a
Indicateur

Indicateur

VWAP Bands - MultiTF and anchoredThe script has traditional VWAP for two different timeframes along with an option to anchor them to a particular bar. VWAP bands are also included in the script. The bands and VWAP act as hidden support/resistance for the scrip and are useful for intraday trading.
Indicateur

Indicateur

Indicateur

Rumpy's Donchian Anchored VWAPUses donchian points to anchor VWAPs (start a new VWAP interval). The defaults are set up for a 1H chart, with lookback periods of 1 day, 2 days, 1 week, 2 weeks and 4 weeks for the anchor points.
Green : upper donchian AVWAPs, Red : lower donchian AVWAPS, thin/1day to thickest/4 week.
Option to test whether a new point should be formed from a high or low exceeding the historical high/low over a lookback length or using a closes that exceed the historical high/low.
---------------------------
Indicateur

Indicateur

Multi-Timeframe VWAP V2 MODQuick and dirty mod of this script in order to fit my needs.
Added one custom session
More user friendly (Enable/disable through inputs menu)
Indicateur

SMEF Scalper 2.0SMEF Scalper 2.0 by shaslund.
Trying to mix some humour into technical trading.
Kudos to Douglas Adams for his great books. Please take some time to read them.
I believe all traders have been SMEF'd now and then...
For the uninitiated: SMEF = 'Spontaneous Massive Existence Failure'.
Methology:
I am combining a TEMA and a volume-weighted average to predict the trend changes (buy/sell).
Features:
Some funny, some useful.
Changes in v2.0:
Removed some garbage and unprotected the code.
Indicateur

Volume Profile Free MAX SLI (50 Levels Value Area VWAP) by RRBVolume Profile Free MAX SLI by RagingRocketBull 2019
Version 1.0
All available Volume Profile Free MAX SLI versions are listed below (They are very similar and I don't want to publish them as separate indicators):
ver 1.0: style columns implementation
ver 2.0: style histogram implementation
ver 3.0: style line implementation
This indicator calculates Volume Profile for a given range and shows it as a histogram consisting of 50 horizontal bars.
It can also show Point of Control (POC), Develop
Indicateur
