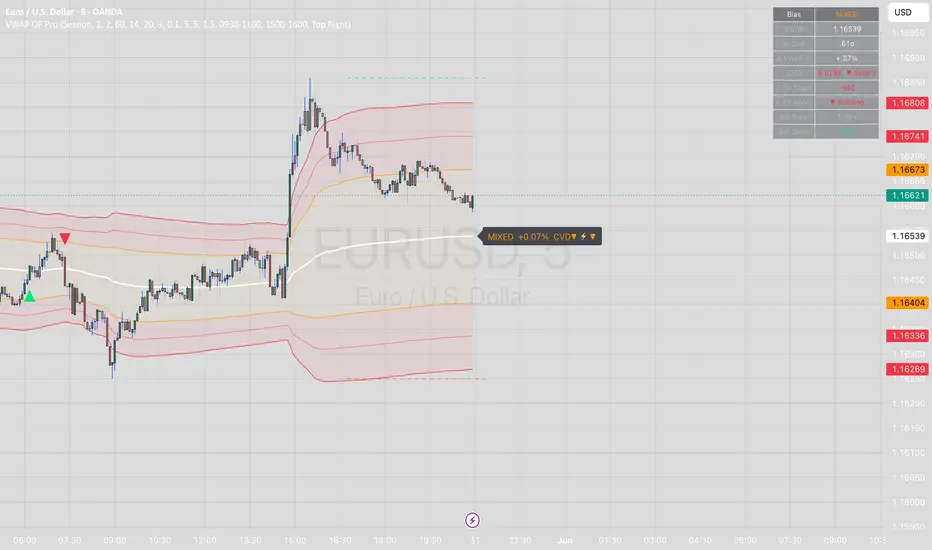
VWAP + Order Flow VWAP + Order Flow Pro — Institutional Bias, Volume Delta & High-Conviction Signals
Most VWAP indicators just draw a line. This one reads the market behind the line.
VWAP + Order Flow Pro combines volume-weighted average price with approximated order flow (bar delta + cumulative volume delta) to identify three specific setups where institutional activity is most likely to drive the next move.
THREE SIGNALS — ALL REQUIRE CONFLUENCE
▲▼ Signal A — Institutional Reclaim
Price spends 3+ bars on the wrong side of VWAP, then reclaims it with a decisive body (≥50% of range), strong delta (>0.6× average volume), and CVD that is both positive and accelerating. Not every VWAP cross — only ones with real buying or selling behind them.
▲▼ Signal B — Band Absorption
Price wicks beyond the ±2σ band by a configurable minimum extension, then closes back inside ±1.5σ. The bar must be wick-dominant (wick/body ratio >1.5), with opposing delta >0.5× average volume and expanding participation. Designed to catch institutional absorption of retail breakout attempts.
◆ Signal C — CVD Pivot Divergence
Price prints a new high or low at a pivot, but cumulative volume delta does not confirm. Hidden buying or distribution. Only fires within ±1.5σ of VWAP with CVD accelerating in the divergence direction.
WHAT MAKES THIS DIFFERENT
No repaint. All signals are gated by barstate.isconfirmed. Divergence signals use pivot lag by design — the delay is the protection.
Adaptive lengths. CVD slope, volume average, and cooldown periods auto-tune to your chart timeframe (1m through 1H+). No manual adjustment needed when switching TFs.
Signal cooldown. Prevents signal spam during chop. Configurable.
Volume filter. Signals require volume above a user-defined multiple of average. Default 1.5×.
Session filter. Optional restriction to high-probability windows: open 90 minutes + close 60 minutes. Built for equities and futures. Leave off for crypto and FX.
WHAT'S ON THE CHART
VWAP with ±1σ, ±1.5σ, ±2σ bands (all toggleable)
Optional HTF VWAP overlay (user-defined timeframe, no repaint)
Bar coloring by delta intensity — teal = buy-dominant, red = sell-dominant
Session high/low dashed lines
Floating bias label: BULL / BEAR / MIXED + CVD direction + acceleration indicator
Stats table: Bias, VWAP price, σ-distance, % from VWAP, CVD, CVD slope, CVD acceleration, volume ratio, bar delta
ALERTS
Five alert conditions built in: Long Signal, Short Signal, Bullish CVD Divergence, Bearish CVD Divergence, VWAP Cross (any direction).
HONEST DISCLOSURE
The order flow in this indicator is approximated, not real. TradingView does not provide bid/ask tape or Level 2 data. Bar delta is calculated from where the close sits within the bar's range — a widely used proxy, but not a substitute for a true footprint chart. Signals are designed to be high-probability, not high-frequency. Fewer signals, better quality.
This indicator is for educational and analytical purposes. Past signals do not guarantee future results. Always use proper risk management.
Works on: Equities · Futures · Crypto · FX
Best timeframes: 1m · 3m · 5m · 15m · 30m · 1H Indicateur

Indicateur

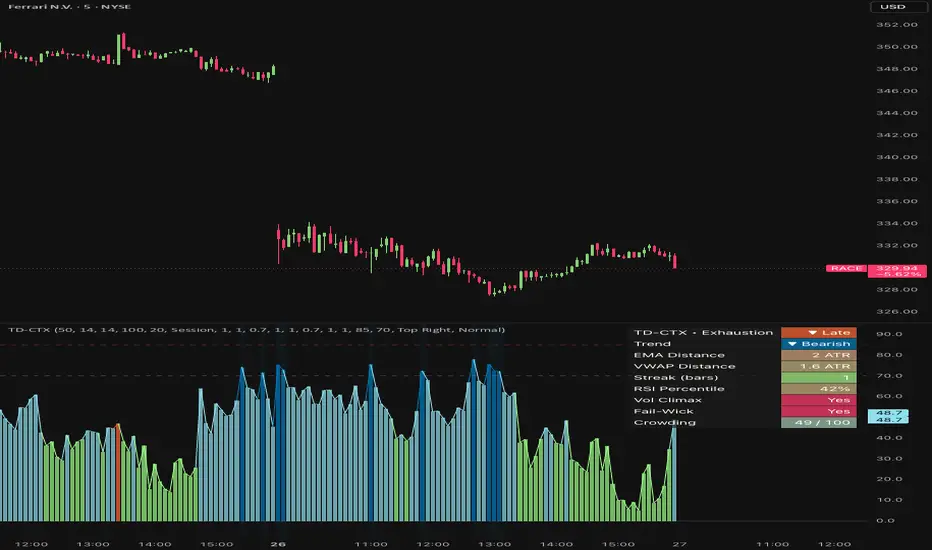
Crowded Trend Exhaustion Index [TradeDots]Crowded Trend Exhaustion Index
Summary
This indicator measures how statistically crowded the current trade has become and reports the reading on a 0 to 100 scale with four named tiers: Healthy, Late, Crowded, and Climax Risk. It is not a top or bottom caller. The goal is to give traders an explicit picture of how stretched price has become relative to historical context, so they can avoid late entries, tighten stops, or take profit when the reading enters extreme territory.
Eight independent factors are combined into the composite score. The pane shows a histogram of the score plus reference lines at the tier thresholds; the background of the pane is tinted when the reading enters the Crowded or Climax Risk tier; a dashboard summarizes the contributing factors.
What is original here
Many public indicators measure one dimension of exhaustion (most commonly distance from a moving average, or RSI level). The contribution of this script is the combination of eight diverse factors that together describe trade crowding from different angles: spatial extension (EMA distance, VWAP distance), persistence (consecutive same-direction candles), momentum exhaustion (RSI percentile), participation extreme (volume climax), volatility expansion (ATR percentile), behavioural rejection (failed continuation wicks with hysteresis), and price/momentum divergence. Each factor weight is exposed as an input so users can audit and tune the composite. The script also deliberately treats divergence and failed-wick signals with a multi-bar hysteresis so single-bar prints do not produce one-bar spikes in the score.
How it works
The trend direction used by the script is the immediate-bar EMA slope. The trend EMA length is configurable (default 50).
The eight factors are computed each bar.
1. EMA distance. Absolute distance from the trend EMA in ATR units, scaled to 0-100.
2. VWAP distance. Absolute distance from an anchored VWAP (Session, Week, or Month — user-selectable) in ATR units, scaled.
3. Candle streak. Number of consecutive same-direction candles aligned with the trend. The counter resets to zero on the first counter-direction bar and the score scales with the streak length.
4. RSI percentile. RSI is computed and percentile-ranked over the configurable lookback. The percentile is taken on the trend side (uptrend uses RSI percentile directly; downtrend uses 100 minus the percentile) so that extreme readings always indicate crowding in the direction of the trend .
5. Volume climax. A discrete score: 100 when volume is in the top decile, 60 in the top quartile, 30 above the median, 0 otherwise.
6. ATR percentile. Current ATR percentile over the lookback.
7. Failed continuation wick. When the current bar prints a wick against the trend direction that exceeds the body by a factor of two, a five-bar hysteresis counter is set. The score decays linearly to zero over five bars. This prevents one-bar wick noise from spiking the score and then disappearing.
8. Price-momentum divergence. Price prints a new N-bar extreme but RSI does not. Bearish divergence in an uptrend, or bullish divergence in a downtrend, sets a five-bar hysteresis just like factor 7.
All factors are weighted (user-configurable), averaged, and clamped to 0-100. Tier mapping:
Healthy : 0 to 40
Late : 40 to crowded_threshold (default 70)
Crowded : crowded_threshold to extreme_threshold (default 85)
Climax Risk : extreme_threshold to 100
Repainting and data integrity
All factors are computed on confirmed-bar values; alerts are gated by barstate.isconfirmed. No request.security() calls are made — the script operates entirely on the chart timeframe. The hysteresis counters for divergence and failed-wick reset deterministically and do not look forward.
How to read the chart
The composite is plotted as a colored histogram in the indicator pane. The color reflects the current tier (green for Healthy, orange for Late, pink for Crowded, red for Climax Risk).
Reference lines mark the tier thresholds.
The pane background is tinted when the reading enters the Crowded or Climax Risk tier.
The dashboard panel shows the current tier, each contributing factor's reading, and the composite score.
Inputs
Inputs are grouped into four sections.
Core Settings : trend EMA length, ATR length, RSI length, percentile lookback, divergence lookback, VWAP anchor.
Score Tuning : a 0 to N weight for each of the eight factors, the Climax Risk threshold, the Crowded threshold.
Visual Settings : histogram toggle, dashboard toggle, background-tint toggle, panel position and size, panel background color.
Any Alert() function call conditions : per-alert toggles.
Alerts
Four alert conditions are provided:
Entered Crowded Zone (score crossed the Crowded threshold from below)
Entered Climax Risk Zone (score crossed the Climax Risk threshold from below)
Divergence Detected (a price-momentum divergence triggered this bar)
Exhaustion Cooling (score fell back below the Crowded threshold from above)
Each is declared via alertcondition() and is fired programmatically through alert() when the corresponding input toggle is enabled, using alert.freq_once_per_bar_close. Alert messages include {{ticker}} and {{interval}} placeholders.
How to use this script
This is a profit-taking and late-entry-avoidance tool, not an entry trigger.
Apply on the timeframe where you make trading decisions.
While the score is Healthy or Late, the trend can continue to extend; this is not a fade signal.
When the score enters Crowded or Climax Risk on the trend side, tighten stops on existing trend trades, scale out, or avoid late entries.
The Divergence alert is a secondary signal — it indicates internal momentum disagreement but is not a reversal call on its own.
The Exhaustion Cooling alert can be used to identify the end of a stretched move, which sometimes precedes a fresh trend or a multi-bar consolidation.
Limitations and honest caveats
"Crowded" does not mean "imminent reversal". Strong trends can stay crowded for extended periods.
The composite is a heuristic, not a probability.
The divergence factor requires that price prints a new N-bar extreme. Divergences that occur without a fresh extreme will not be detected.
The VWAP factor uses a single anchor at a time (Session, Week, or Month). Multiple simultaneous VWAP comparisons are not supported.
The streak counter resets on a single counter-direction candle, which can cause sharp drops in the streak factor that do not necessarily indicate the trend is over.
The script makes no prediction about when or how a stretched trend will end.
Disclaimer
This script is published for informational and educational purposes. It is not investment advice and is not a recommendation to buy or sell any instrument. A high crowding reading is not a signal to reverse; it is a description of statistical extension. Users are solely responsible for their own trading decisions and risk management.
Indicateur

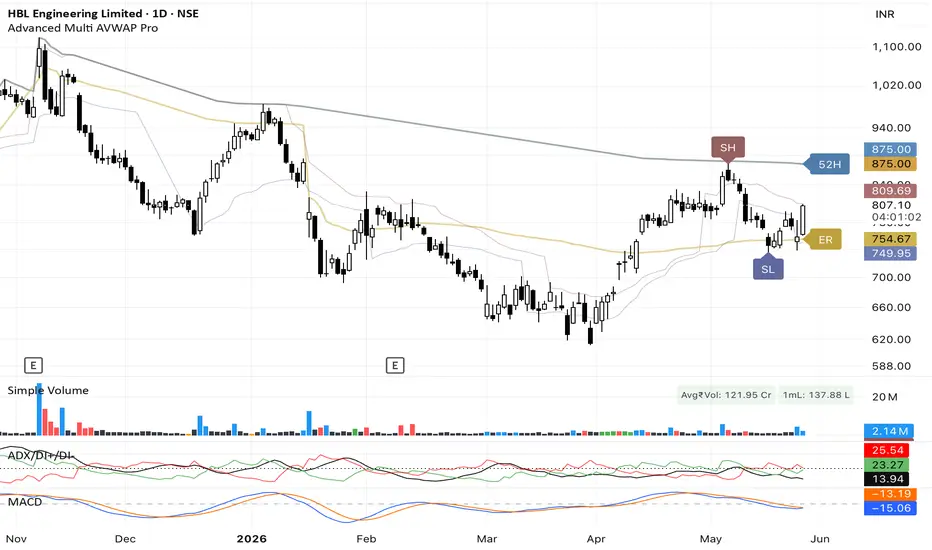
Anchored VWAP Bands Strategy [Gabremoku]Anchored VWAP Bands Strategy is a context-driven fair value indicator that combines Anchored VWAP, deviation bands, directional bias, and retest/stretch-based entry logic into a single overlay.
The script uses Anchored VWAP as its core reference line, allowing the user to define a custom starting point by time or bars back. Unlike standard VWAP, which resets on a regular session basis, Anchored VWAP starts from a specific event or pivot selected by the trader, making it especially useful for tracking price behavior relative to an important market reference point.
On top of that, the indicator adds sigma-style bands, dynamic fair value coloring, directional state reading, and optional entry signals built around AVWAP retests and band reversals.
What it shows
⚓ Anchored VWAP — the volume-weighted average price from a user-defined anchor point. Anchored VWAP is commonly used to estimate fair value from a specific event and to monitor whether price is trading above or below that reference.
📐 Deviation Bands — up to three upper and lower bands built from either:
anchored standard deviation
or rolling standard deviation
These bands help show how far price has deviated from anchored fair value and can be used to identify balance, expansion, or stretch conditions.
🌈 Dynamic Gradient Bias — AVWAP and its fills change color based on price location and directional pressure relative to the center.
🧭 Directional State — the script classifies price into states such as:
Fair Value
Bullish Balance
Bullish Expansion
Bullish Stretch
Bearish Balance
Bearish Expansion
Bearish Stretch
🎯 Entry and Target Logic — optional long/short signals and dynamic target markers based on AVWAP retests or outer-band reversals.
🪧 Dashboard — displays state, bias, AVWAP slope, distance from fair value, anchor age, and Long-S status.
Core logic
The main idea behind this script is simple:
AVWAP defines fair value from a chosen event
bands define statistical distance from that fair value
slope helps determine directional bias
signals look for retests or stretched reversals
Anchored VWAP is often used to analyze where the market’s volume-weighted average price sits from a meaningful point in time, and many traders use it as a dynamic support/resistance or bias line. Price above AVWAP is often interpreted as relatively stronger positioning, while price below it can imply weaker positioning.
By adding deviation bands, this script gives a clearer structure for distinguishing between:
normal pullbacks,
balanced price action,
and statistically extended moves.
Signal logic
The script supports Both, Long, or Short directional modes, with three signal styles:
Retest AVWAP
Band Reversal
Hybrid
Long ideas
Long signals can trigger when:
price retests AVWAP and closes back above it
or price reacts from the lower band and reclaims it
Short ideas
Short signals can trigger when:
price retests AVWAP from below and closes back under it
or price reacts from the upper band and falls back below it
There is also a Long-S logic tied to reactions around Lower Band 1, with AVWAP used as a potential target when enabled.
This makes the tool useful both for:
trend continuation via AVWAP retests
and mean-reversion or snapback setups from band extremes
Why it matters
One of the biggest strengths of Anchored VWAP is that it adds context.
Instead of asking “is price high or low?” in a generic way, AVWAP asks:
“Is price rich or discounted relative to a meaningful market event and its volume?”
That is why Anchored VWAP is commonly anchored to:
breakout bars
swing highs or lows
earnings events
gaps
major session turning points
In that framework:
AVWAP becomes fair value
slope becomes directional bias
bands become expansion/stretch zones
retests become opportunity areas
Features
✅ Anchored VWAP with time-based or bars-back anchoring
✅ Optional anchor reset logic
✅ Anchored or rolling standard deviation bands
✅ Up to three sigma-style upper/lower bands
✅ Dynamic center-line and fill coloring
✅ Fair value / expansion / stretch state classification
✅ Long / Short / Both strategy modes
✅ Retest AVWAP, Band Reversal, or Hybrid signal modes
✅ Optional slope filter
✅ Optional close-confirmation filter
✅ Dynamic target plotting
✅ Long-S lower-band reaction logic
✅ Bias background shading
✅ AVWAP label and dashboard
✅ Built-in alert conditions
How to use
A practical workflow is:
Choose a meaningful anchor point.
Use AVWAP as the fair value reference.
Read slope for directional bias.
Use the bands to identify balance vs expansion vs stretch.
Trigger entries on:
AVWAP retests in trend
band reversals after extension
In general:
above a rising AVWAP often supports bullish continuation logic
below a falling AVWAP often supports bearish continuation logic
far from AVWAP near outer bands can signal stretch or reaction zones rather than efficient price
Notes
This indicator is designed as a fair value and execution-context tool, not as a full standalone strategy with complete trade management. Anchored VWAP is highly dependent on anchor quality, so the usefulness of the line improves when the anchor is tied to a genuinely meaningful price event.
Author: Gabremoku
Pine Script v6 Indicateur

AlgoStorm Institutional VWAP Suite (IVS)AlgoStorm Institutional VWAP Suite (IVS)
A multi-anchor, institutional-grade VWAP framework covering five distinct time horizons simultaneously — Daily, Rolling Time-Window, NY, European/London, and Asian/Pacific — with volume-weighted standard deviation bands, a configurable color suite, a live info table, and full alert coverage.
The AlgoStorm Institutional VWAP Suite (IVS) is built on a single conviction: VWAP is not a single line, it is a layered structural map. Professional traders and institutions do not reference one VWAP — they read the relationship between multiple anchored VWAPs across sessions and time windows to understand where the auction is relative to where it has been. IVS makes this entire multi-anchor framework available in one cohesive, configurable overlay, designed for futures, equities, forex, and any instrument with reliable volume data.
Why Multiple VWAPs?
Each anchor tells a different story. The Daily VWAP defines where the current session is balanced. The Rolling VWAP reflects dynamic equilibrium over a configurable time window, acting as a responsive benchmark for swing and position traders. The session VWAPs — NY, London, and Asia — reveal the price acceptance or rejection developing within each regional trading block. When price holds above the NY VWAP but stalls beneath the Daily VWAP, that tension itself is actionable information. IVS maps all five references simultaneously so those relationships are always visible.
Technical Architecture
Each VWAP anchor is computed through a dedicated VwapInstance User-Defined Type (UDT). This object maintains the running sums required for both the VWAP price and the volume-weighted population standard deviation, using the mathematically correct formula σ² = E − E ² . Deviation bands derived from this are true volume-weighted standard deviations — not ATR estimates or fixed percentage offsets.
The Rolling VWAP runs on a High-Fidelity Sliding Time-Window Engine . Rather than anchoring to a calendar boundary, it maintains four parallel arrays (price-volume, volume, squared price-volume, and timestamps) to continuously evict data older than the user-defined window. This produces a genuinely time-accurate rolling VWAP at any timeframe, not a bar-count approximation.
Session resets (NY, London, Asia) use a one-minute anchor window via time("1", range, timezone) , which fires accurately across all chart timeframes — not just 1-minute charts.
Features & Functionality
Daily VWAP: Anchors at each calendar day open using hlc3 as the price source. Resets correctly on the first bar of every session including overnight gaps. Paired with optional volume-weighted standard deviation bands (two configurable multipliers for ±1σ and ±2σ levels).
Daily VWAP Wave (H/L): Plots two companion VWAPs anchored to the daily high and low respectively, with a filled channel between them. This "wave" shows the intraday auction range as a structural envelope rather than a single midline — price inside the wave indicates balance, price outside indicates initiative direction.
Rolling Time-Window VWAP: Fully configurable window in days, hours, and minutes. Defaults to 1 day. Paired with optional volume-weighted standard deviation bands. Unlike a fixed daily anchor, the rolling VWAP adapts continuously, making it a natural trend reference for intraday and swing traders.
NY Session VWAP: Anchors at 09:30 ET (New York open). The primary reference for equities and US futures RTH participants. Resets each session regardless of the chart's display timezone.
European / London Session VWAP: Configurable anchor at either 03:00 ET (London) or 02:00 ET (Frankfurt). Essential for tracking European institutional participation, particularly on DAX and EUR/USD.
Asian / Pacific Session VWAP: Configurable anchor at either 20:00 ET (Tokyo) or 18:00 ET (Sydney). Useful for establishing overnight reference levels and identifying the range that NY will either accept or reject at the open.
Color Suite: Every line has an independently configurable color input. The defaults (Silver, White, Blue, Lime, Red, Yellow) are chosen for visual hierarchy on dark themes, but each can be adjusted for light themes, personal preference, or multi-indicator setups.
Live VWAP Info Table: An optional on-chart table (top-right, togglable) displaying the current numeric value of all six active VWAP levels, color-coded to match their respective lines. Values display as — for any anchor that has not yet reset in the current session. Populated only on the last bar to avoid unnecessary per-bar overhead.
10 Alert Conditions: Cross-above and cross-below alerts for every VWAP line. Alerts fire on bar close (confirmed bar only) to prevent repainting. Each message includes {{ticker}} and {{close}} placeholders for use in webhook automations or notification routing.
Usage Guide
For intraday futures traders (ES, NQ, DAX): Enable the Daily VWAP Wave and NY VWAP as your primary references. Price reclaiming the NY VWAP after a morning flush is a high-probability mean-reversion setup. Price pushing beyond the Daily Wave High with sustained delta confirms initiative buying.
For swing and multi-day traders : The Rolling VWAP is your core tool. Set the window to 3-5 days and treat it as a dynamic fair value anchor. When price returns to the Rolling VWAP after extended deviation, evaluate whether volume supports continuation or reversal.
For session transition analysis : Enable all three session VWAPs. At the NY open, observe where price is relative to the Asian and London anchors. Acceptance above the London VWAP at NY open is structurally bullish. Rejection and failure below it signals continuation of overnight selling.
For deviation band usage : The ±1σ bands define the statistically normal range for the session. Extended moves to ±2σ with declining volume are classic mean-reversion setups. Moves to ±2σ with expanding volume signal initiative behavior and potential trend continuation. Indicateur

Indicateur

Indicateur

Indicateur

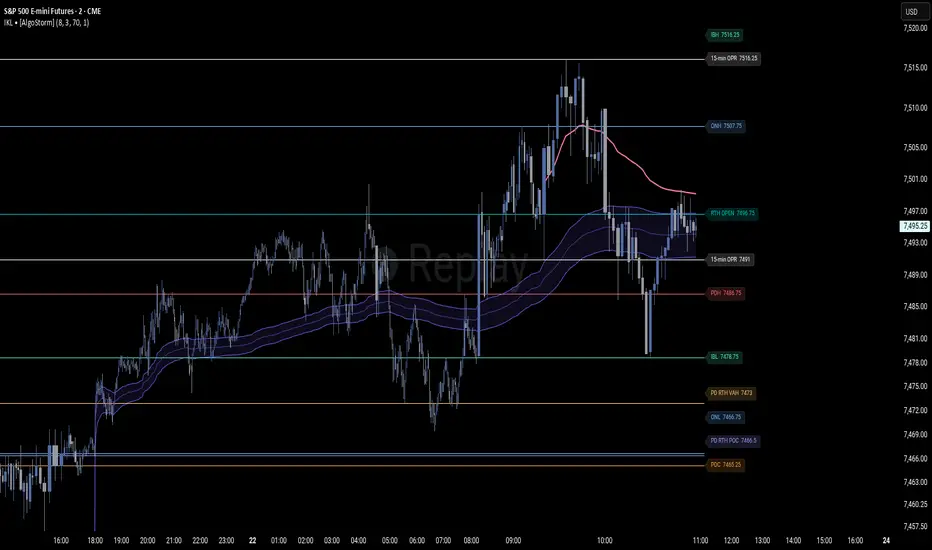
AlgoStorm Institutional Key Levels (IKL)AlgoStorm Institutional Key Levels (IKL)
For US Index Futures and DAX.
An institutional-grade structural mapping tool built on actual Auction Market Theory (AMT) to track the true liquidity and volume nodes across centralized futures markets.
The retail trading industry has heavily distorted the word "institutional," convincing traders that algorithms are hunting their stop-losses at random pivot highs. The reality is far more objective. Real institutions, hedge funds, and market makers rely on definitive, centralized exchange volume, liquidity depth, and execution algorithms (VWAP/TWAP) to scale into positions without causing market impact.
The AlgoStorm Institutional Key Levels (IKL) indicator maps the precise mathematical benchmarks that dictate this capital flow. Designed for markets with centralized volume (CME, Eurex), it plots highly accurate session opens, Opening Ranges, Initial Balances, and Value Areas, stripping away retail noise to provide a professional framework for your intraday bias.
Technical Specifications & Architecture
Supported Markets: Universal application for centralized futures markets including US Indices (ES, NQ, YM, RTY) and European Indices (DAX/FDAX, FDXM).
Supported Timeframes: Designed specifically for 2-minute through 30-minute charts . (Note: Due to the historical buffers required for multi-session mapping, Pine Script will reject timeframes below 2-minutes).
Timezone Mastery: Flawlessly handles Daylight Saving Time (DST) transitions natively. US Futures are bound strictly to America/New_York , while DAX/Eurex Futures are strictly bound to Europe/Berlin .
Fixed-Pool Drawing Engine: Most level indicators suffer from memory bloat and chart lag due to constant object creation and garbage collection limits. The IKL utilizes a highly optimized "fixed-pool" architecture. Lines and labels are generated only once on the first bar and recycled dynamically.
Smart Label Stagger: Features a forward-pass algorithm that detects and pushes overlapping labels apart (user-adjustable separation), ensuring your chart remains pristine regardless of price compression.
US Futures Mapping (ES / NQ / YM / RTY)
All inputs trigger based on standard America/New_York session times.
Globex Structure: Previous Day High/Low (Full 18:00–17:00 session) and Overnight High/Low (18:00 to 09:30 ET).
RTH Anchors: Previous Day Close (PDC) locked exactly at the 16:00 ET cash close, and the RTH Open (09:30 ET) held all day.
Gap Fill Zone: Automatically draws an asynchronous highlight box between the PDC and current RTH open if an unfilled gap of more than 2 ticks exists.
Auction Metrics: 15-minute Opening Range (09:30–09:45 ET) and the standard Initial Balance (09:30–10:30 ET) with optional 100%, 150%, and 200% IB extension bands.
Eurex / DAX Futures Mapping (FDAX / FDXM)
A complete, standalone module built for the complex, multi-open nature of European futures. Based on Europe/Berlin time.
Asian / Pre-London Phase: Tracks Eurex overnight high/low from 01:00 CET until Frankfurt liquidity arrives at 08:00 CET.
Euro / Frankfurt Session: Plots the 08:00 CET Open and the 30-minute Euro Opening Range (08:00–08:30 CET).
Xetra Cash Session: Plots the definitive Xetra Open (09:00 CET), Xetra OPR (09:00–09:30 CET), and the Previous Xetra Close (17:30 CET) which acts as the DAX equivalent to the US PDC.
US Open Impact: Captures the 15:30 CET open and 30-minute OPR, marking the massive liquidity injection when US equity markets open.
Execution & Volume Mechanics
Algorithmic VWAPs: Plots the exact Daily and Session VWAP bands used by institutional execution desks to grade their fills. Features a full Globex Daily VWAP (resets 18:00 ET), a localized NY VWAP (resets 09:30 ET), and a dedicated Xetra VWAP (resets 09:00 CET).
Custom Value Area Engine: Features a built-in, manual array-based Volume Profile engine. It calculates the Point of Control (POC) and Value Area High/Low (VAH/VAL) for both RTH and Xetra sessions independently, bypassing standard Pine Script volume limitations. Users can customize the Value Area % and price-row tick size.
Indicateur

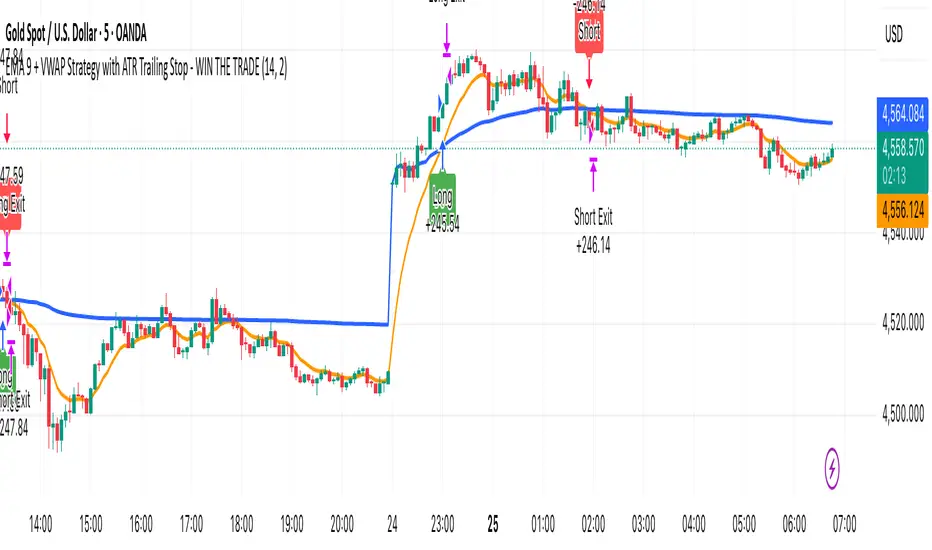
EMA 9 + VWAP Strategy with ATR Trailing Stop - WIN THE TRADEEMA 9 + VWAP Strategy with ATR Trailing Stop
A simple trend-following strategy that combines the power of the 9 EMA , VWAP , and an ATR-based trailing stop for cleaner entries and dynamic trade management.
This strategy is designed for traders who want a straightforward system with minimal discretion and clear buy/sell conditions.
Strategy Logic
Buy Conditions
A long position is opened when the 9 EMA crosses above VWAP.
Sell Conditions
A short position is opened when the 9 EMA crosses below VWAP.
Trade Management
Uses an ATR trailing stop to automatically lock in profits and manage risk. The trailing stop dynamically adjusts based on market volatility.
Features
EMA + VWAP crossover entries
ATR-based trailing stop exits
Visual BUY/SELL labels
Dynamic trailing stop lines plotted on chart
Built-in alerts
Works well for scalping, intraday trading, and trend continuation setups
Best Markets
This strategy can be used on Forex, Gold (XAUUSD), Indices, Crypto, and Stocks.
Recommended Timeframes
Popular timeframes include 1 Minute, 5 Minute, 15 Minute, and 1 Hour.
Lower timeframes generally produce more signals, while higher timeframes can provide cleaner trends.
Inputs
ATR Length controls the ATR calculation period.
ATR Multiplier adjusts the trailing stop distance.
Increasing the ATR multiplier gives trades more room to breathe, while lowering it creates tighter exits.
Alerts
The script includes ready-to-use JSON webhook alerts for automation and bot integrations.
You can connect it to trading bots, Discord alerts, Telegram alerts, trade execution systems, and prop firm automation tools.
Disclaimer
This strategy is for educational purposes only and should not be considered financial advice. Always test and optimize settings before using on a live account.
Stratégie

Indicateur
Confluence FlowConfluence Flow — A multi-layer confluence system combining EVWAP, Adaptive Pivots, Impulse Council & Smart Candles
Confluence Flow unifies five analytical layers — Regime, Momentum, Structure, Pattern, and Confidence — into one powerful overlay. Instead of scattered signals, you get a coherent market narrative through intelligent candle coloring, adaptive levels, and a clean dashboard.
─────────────────────────────────────────────
EVWAP (Exponential Volume Weighted Average Price)
─────────────────────────────────────────────
The heart of the regime filter. This EVWAP dynamically anchors to the most recent significant swing high or low and uses an adaptive half-life that responds to market volatility. Fast markets = faster reaction. Quiet markets = smoother response.
Includes ±1σ and ±2σ bands that clearly show fair value, premium/discount zones, and statistical extremes.
─────────────────────────────────────────────
Adaptive Pivots (S9)
─────────────────────────────────────────────
A next-level dynamic support/resistance system. Band width adapts intelligently using a Trend Quality Index (TQI) based on efficiency, volume, structure, and momentum alignment. High-quality trends get tighter bands. Chop gets wider bands to reduce whipsaws.
─────────────────────────────────────────────
Impulse Council (4-School Voting)
─────────────────────────────────────────────
Four independent schools vote on momentum:
• OBV Flow & Divergence
• Volume Delta (VWMA)
• Wyckoff Springs & Upthrusts
• EMA Confluence (9/21 + 55 filter)
Minimum 2 agreeing schools required for a valid signal.
─────────────────────────────────────────────
Smart Candles
─────────────────────────────────────────────
Candles are colored on a gradient from deep maroon (strong bear) to bright cyan (strong bull) based on the composite bias. Both body and wicks adapt, giving instant visual conviction.
─────────────────────────────────────────────
Pattern Recognition & High-Confidence RR Boxes
─────────────────────────────────────────────
Detects 20 classical patterns with strength scoring and regime alignment filtering. Patterns that conflict with the prevailing regime are automatically dimmed on the chart — keeping your focus on high-probability setups and filtering out counter-trend noise. When a strong pattern aligns with high TQI, strong displacement, and volume — a ★ High Confidence signal triggers automatic 1:2 RR boxes with smart stop placement.
─────────────────────────────────────────────
Dashboard
─────────────────────────────────────────────
Real-time overview of Bias, Council votes, S9 trend, EVWAP direction, and SMA trend.
─────────────────────────────────────────────
Best Used As
─────────────────────────────────────────────
A powerful confluence tool for day traders and swing traders on 5min to 4H timeframes. The strongest setups occur when EVWAP, S9, Council, and Smart Candle bias all align.
Settings default to "Patterns Only" so you can add it without changing your chart's original candle look — toggle to "Candles + Patterns" to enable the full Smart Candle gradient coloring. Indicateur

Indicateur

Tessera Execution Vault [JOAT]Tessera Execution Vault
Introduction
Tessera Execution Vault is an open-source confluence and execution-context indicator. It combines trend, volatility, pressure, VWAP location, structure sweeps, rejection behavior, and a compact transition model into a single score-based framework.
The script is intended to organize market context and display educational trade projections when confluence is high. It should not be treated as a certain signal system.
Core Concepts
1. Confluence Scoring
Long and short scores are built from independent evidence such as trend, VWAP, momentum, volume, pressure, CVD proxy, sweep events, and transition persistence.
2. Auction Pressure
The script estimates bid/offer pressure from candle structure and volume. It then plots a pressure trace near VWAP.
3. Sweep Memory Zones
When liquidity sweeps, expansion breaks, or auction reclaim conditions occur, the script stores short-lived memory zones.
4. VWAP Deviation Field
VWAP bands show where price is trading relative to the current auction center.
5. Educational Projection
When a setup qualifies, the script can draw entry, stop, and target levels based on ATR.
Features
Score-based long and short context: Multiple independent factors contribute to each side
VWAP auction bands: Upper and lower deviation fields
Pressure and score traces: Visualizes pressure and confluence around VWAP
Sweep memory zones: Labels discount, premium, liquidity reclaim, and liquidity reject areas
Confirmed-bar signals: Optional closed-bar signal gating
Dashboard: Displays bias, scores, ATR, volume, pressure, CVD proxy, and auction state
Input Parameters
Operating Preset changes sensitivity for scalping, intraday, swing, low-noise, or showcase modes
Core lengths control EMA, RSI, volume baseline, and sweep window
Risk settings control ATR stop and target projections
Auction settings control pressure and VWAP deviation calculations
How to Use This Indicator
Step 1: Read the dashboard bias
The bias and score rows show which side currently has stronger confluence.
Step 2: Watch memory zones
Memory zones highlight recent sweep or auction-location events that may remain relevant.
Step 3: Treat projections as educational
ATR projections show a possible risk framework. They are not recommendations.
Indicator Limitations
Pressure and CVD are candle-derived approximations
Confluence does not ensure continuation
ATR projections can be too wide or narrow during sudden volatility changes
Originality Statement
Tessera Execution Vault combines confluence scoring, VWAP auction context, pressure traces, transition persistence, and labelled memory zones in one open-source script. Its purpose is to explain why one side has more contextual evidence than the other.
Disclaimer
This indicator is provided for educational and informational purposes only. It is not financial advice or a recommendation to trade. Always use independent analysis and proper risk management.
-Made with passion by jackofalltrades
Indicateur

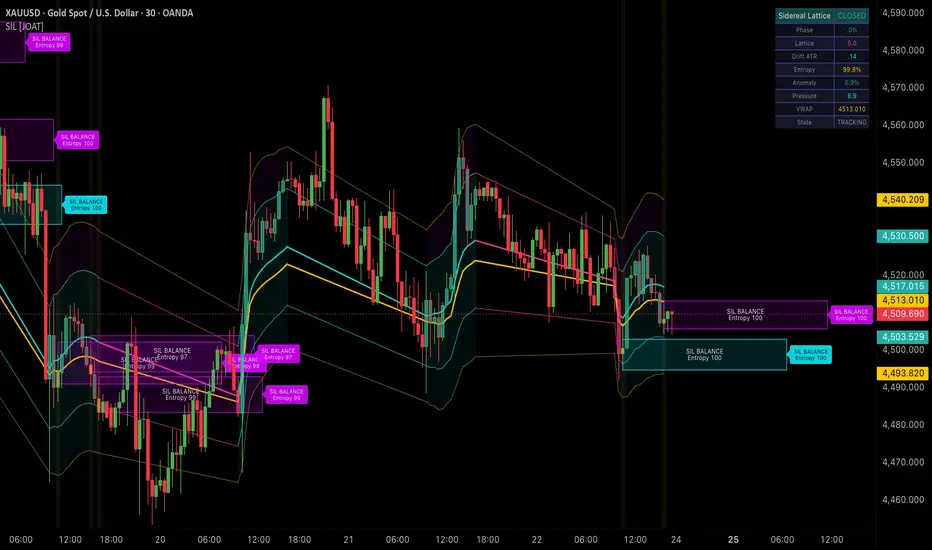
Sidereal Session Lattice [JOAT]Sidereal Session Lattice
Introduction
Sidereal Session Lattice is an open-source intraday session-orbit indicator. It maps session phase, VWAP drift, volatility harmonics, entropy, and anomaly pressure into adaptive orbit bands and compact phase cells.
The indicator is designed to answer a session-context question: is price moving with the current session phase, stretching beyond its orbit, or compressing into balance?
Core Concepts
1. Session Phase
Each active session is counted bar by bar. The bar count is converted into a normalized phase value from 0 to 1.
2. Harmonic Orbit
The phase value is transformed with sine waves to create an intraday harmonic component. This does not predict price; it creates a reference curve for studying session rhythm.
3. VWAP Drift
The script tracks the distance between price and session VWAP, then normalizes the drift by ATR.
4. Entropy and Anomaly Rank
The script compares recent up/down candle energy and return magnitude to estimate balance and anomaly pressure.
5. Phase Cells
Compact cells mark upper-orbit events, lower-orbit events, and balance compression.
Features
Session phase model: Tracks where the market is inside the active session cycle
VWAP drift: Measures price displacement from session VWAP
Harmonic orbit bands: Adaptive bands based on phase, volatility, and drift
Entropy score: Measures up/down energy balance
Anomaly rank: Highlights unusual movement relative to recent behavior
Phase cells: Compact boxes show session-orbit events
Dashboard: Shows phase, lattice score, drift, entropy, anomaly, and current state
Input Parameters
Primary session defines the active session window
Cycle bars controls the phase cycle length
Drift smoothing controls VWAP drift smoothing
Entropy memory controls bid/ask balance memory
Anomaly memory controls return-rank comparison
How to Use This Indicator
Step 1: Read the phase state
The dashboard names the current session phase, such as open drive, balance, or close risk.
Step 2: Watch orbit events
Upper and lower orbit cells mark when price stretches beyond the adaptive session orbit.
Step 3: Use entropy for balance context
High entropy with low anomaly often indicates balanced conditions.
Indicator Limitations
The harmonic orbit is a reference model, not a forecast
Session behavior varies by symbol and exchange hours
Entropy and anomaly values are derived from chart bars and may change with timeframe
Originality Statement
Sidereal Session Lattice combines session phase, VWAP drift, harmonic references, entropy, and anomaly ranking. It is not a standard session high/low tool; it provides a structured way to study intraday rhythm and displacement.
Disclaimer
This indicator is provided for educational and informational purposes only. It is not financial advice. Session models can fail in news, gaps, and unusual liquidity conditions.
-Made with passion by jackofalltrades
Indicateur

Macro Anchored VWAP EngineThe Anchored VWAP Engine is a mathematical model that tracks the true institutional average price paid for an asset, starting from a specific, user-defined historical event. Unlike standard indicators that rely purely on time, this engine merges price, volume, and volatility into a single structural anchor.1. How the Engine Works Under the HoodThe engine operates on a cumulative looping mechanism that activates the exact moment a chosen historical date occurs on the chart.The Accumulation Trigger: The code ignores all data before your chosen date (e.g., March 23, 2020). When that bar arrives, it starts an open-ended running calculation.The Volume-Weighting Core: For every subsequent candle, it multiplies the typical price \((\frac{\text{High} + \text{Low} + \text{Close}}{3})\) by that candle's trading volume.The Running Totals: It adds this result to a rolling sum of cumulative price-volume and divides it by the total rolling sum of volume.2. The Statistical Dislocation MathThe unique power of the engine lies in its ability to compute true volume-weighted variance. It runs a parallel calculation tracking the square of the price multiplied by volume to extract a clean Standard Deviation (SD) channel.text <─── High-Sigma Exhaustion Zone (+3 SD)
▲
│ (Parabolic Distance)
▼
<─── Institutional Liquidity Wall
▲
│ (Typical Market Range: 95% of all distributions)
▼
──> <─── True Institutional Equilibrium (The Mean)
Use code with caution.The Baseline Line: This is the absolute center of gravity. It represents the collective average break-even price of all institutional market participants who entered since the anchor point.The 2-Sigma Channel (\(\pm \)2 SD): This defines the outer boundary of normal market distribution. Statistically, price will trade inside this channel 95% of the time.The 3-Sigma Boundary (\(\pm \)3 SD): This represents a severe mathematical anomaly. When price stretches up to touch this band during a parabolic run, it means the asset is unsustainably overextended relative to its volume foundation.3. Core Advantages Over Traditional IndicatorsCompletely Non-Repainting: The levels lock into historical certainty as the chart moves forward.Immune to Time Dilution: Moving averages fade in relevance as time passes. Anchored VWAP grows structurally stronger as more volume accumulates over years.Identifies True Value: It shows you exactly where institutions will defend their positions during a major correction, rather than guessing based on visual line-drawing. Indicateur

Initial Balance Breakout [samjNQ] v3---samjNQ Initial Balance Breakout strategy---
**Initial Balance Breakout — Strategy Description**
Trades breakouts of the first-hour Initial Balance on the Micro E-mini S&P 500 (MES1!) using a clean set of filters to avoid noise and low-quality setups.
**How it works:**
The Initial Balance (IB) is defined as the high and low of the 9:30–10:30 AM ET window — the first hour of Regular Trading Hours. Once that window closes and the IB locks, the strategy waits for price to break above the IB High (long) or below the IB Low (short) during the trade window (10:30 AM–2:30 PM ET).
**Filters applied:**
- **VWAP trend filter** — only takes long breakouts when price is above VWAP, and short breakouts when price is below. Avoids trading against intraday momentum.
- **IB range filter** — skips days where the IB is too narrow (choppy, commissions eat returns) or too wide (extensions become unreachable). Configurable min/max in points.
- **2:30 PM cutoff** — no new entries in the last 90 minutes of the session. Late breakouts rarely have time to reach targets.
- **One trade per direction per day** — no re-entries after a stop-out.
**Exits:**
- Stop: opposite IB level (IB Low for longs, IB High for shorts)
- Target: 1.5× the IB range beyond the breakout level
- EOD flat: any open position is closed at 3:55 PM ET
**Chart visuals:**
- Yellow background = IB building window
- Blue lines = IB High / IB Low / Midpoint
- Green lines = long extension targets (T1 / T2)
- Red lines = short extension targets (T1 / T2)
- Orange line = VWAP
- Gray background = day filtered out by range rules
**Settings:** All parameters are adjustable — IB window, trade window, target multiples, stop mode, range filter thresholds, and VWAP filter toggle.
Built and backtested on MES1! 5-minute chart. Commission set to $2.25/contract, 1-tick slippage included.
--- Stratégie

Confluence Zone Engine [CZE]# Confluence Zone Engine
A structural analysis indicator that identifies support and resistance zones by clustering Anchored VWAPs and Anchored Volume Profile levels across the chart timeframe and up to three higher timeframes. Each zone is rated 1 to 5 stars based on how many independent sources cluster at the level and how diverse those sources are.
This is a structural analysis tool. It marks where multiple independent technical references agree at a price. It does not place trades or suggest entries, exits, targets, stops, or position sizes.
---
## What this script does
The engine runs a six-stage pipeline on every confirmed bar:
**Stage 1 — Pivot detection.** Detects pivot highs and pivot lows at Fibonacci-spaced lengths (3, 5, 8, 13, 21, 34, 55, 89). Each pivot becomes an "anchor" point. Default enabled tiers are 8, 21, and 34 — selected to give fast / medium / slow coverage without redundancy. The full Fibonacci set is configurable.
**Stage 2 — Per-anchor calculations.** For every anchor, the engine maintains:
- An Anchored VWAP (volume-weighted average price since the anchor bar)
- An Anchored Volume Profile, which produces a Point of Control (POC = most-traded price since anchor) and a Value Area (VAH and VAL = upper and lower edges of the 70% volume zone)
So a single pivot generates up to 4 contributor levels: AVWAP, POC, VAH, VAL.
**Stage 3 — Higher-timeframe replication.** The same pipeline (stages 1 and 2) re-runs on up to three configurable higher timeframes via non-repainting `request.security` calls. This produces a multi-timeframe view of structural anchors — pivots and AVWAPs from a 1H chart inform what the 5m engine treats as a higher-timeframe reference.
**Stage 4 — Cluster building.** All contributor levels from all enabled timeframes are collected. The cluster builder walks them in price order, merging any that fall within a configurable tolerance (default 0.08% of current price; preset-adjusted per asset class). A cluster with at least the minimum-count threshold becomes a candidate zone.
**Stage 5 — Star rating.** Each zone is rated 1 to 5 stars based on:
- Total contributor count
- Source-type diversity (how many of the 4 source categories — PH-AVWAPs, PL-AVWAPs, POCs, VAH/VAL — are present)
- HTF agreement (whether contributors from multiple timeframes align)
A "Premium" tier flag fires when top stars combine with HTF agreement.
**Stage 6 — State machine.** Each zone is tracked through a lifecycle:
- **Active** (forming, amber): the zone is currently accumulating contributors
- **Pending** (blue): contributor activity has paused; waiting for price to resolve the level
- **Resolved Support** (green), **Resistance** (red), or **Chop** (gray): determined by whether price moved decisively up, decisively down, or stayed range-bound after the zone activated
- **Tested** (dashed border): price entered the resolved zone but has not closed past the defending edge
- **Broken** (dashed orange + "Broken" label): price has closed past the defending edge
- **Flipped**: if a Broken state confirms over multiple closes past a threshold, the zone repaints to the opposite role (broken Resistance becomes Support, broken Support becomes Resistance)
---
## Why this indicator is original (not a simple mashup)
This is not "AVWAP indicator + Volume Profile indicator + multi-timeframe wrapper." Three design choices distinguish it from existing public indicators:
**1. Anchored at every Fibonacci pivot, not at a single user-selected point.** Standard AVWAP indicators require the user to manually click an anchor point. Standard Volume Profile indicators use either a fixed session or a single anchor. This engine automatically detects pivots at multiple Fibonacci lengths and runs an AVWAP + Volume Profile from each one. The number of active anchors at any time is typically 6 to 20, generating 24 to 80 contributor levels — far more than a manually-anchored tool can produce.
**2. Cross-timeframe clustering, not separate per-timeframe overlays.** The engine does not draw 5 separate AVWAPs from a 1H chart, plus 5 from a 4H, plus 5 from a daily. Instead, levels from all timeframes are collected into one pool and clustered in price space. A 1H AVWAP at 23,720 and a daily POC at 23,718 merge into a single zone marked as "two contributors from two timeframes." This produces structural information neither timeframe shows alone.
**3. Compositional bias from the contributor mix.** The cluster builder records *which type* of contributor formed each zone — pivot-high AVWAPs (trapped sellers' breakevens), pivot-low AVWAPs (trapped buyers' breakevens), POCs (acceptance), VAH or VAL (fair-value edges). The directional implication of each type is summed into a "compositional bias" score. A zone built mostly from PL-AVWAPs and VAL contributions leans support; one built from PH-AVWAPs and VAH contributions leans resistance. This is an analytical lens not present in standard S/R indicators, which generally treat all levels as direction-agnostic.
---
## Mashup justification — how the components work together
The four classes of technical analysis used (pivots, AVWAP, Volume Profile, multi-timeframe analysis) are not chosen arbitrarily. Each contributes a dimension the others do not, and the value comes from how they interact:
**Pivots provide the anchors.** Without pivots, AVWAP needs a manual anchor and Volume Profile needs an arbitrary session. Pivots at multiple Fibonacci lengths give the engine *automatic structural anchors* spanning timescales — short-term swings, intraday swings, session-level swings. The Fibonacci spacing (3, 5, 8, 13, 21, 34, 55, 89) ensures the anchors are non-redundant: each tier has a different bar requirement and catches different swings.
**AVWAP measures participant breakeven from each anchor.** This is the "where might trapped participants defend" dimension. An AVWAP from a pivot high is the volume-weighted breakeven for everyone who entered after that high (mostly net-short positions). An AVWAP from a pivot low is the breakeven for everyone who entered after that low (mostly net-long). When price returns to one of these AVWAPs, structurally those participants are at breakeven and have incentive to act.
**Volume Profile measures acceptance from each anchor.** This is the "what price has been most-accepted by volume" dimension. POC is the most-traded price; VAH/VAL are the edges of the 70%-volume range. AVWAP and POC measure different things — average price vs most-accepted price — and frequently disagree. When they *do* agree at a level, that's two independent signals saying "this price matters."
**Multi-timeframe replication tests for structural agreement.** A zone that exists only on the chart timeframe is one-timeframe noise. A zone where chart-TF contributors *agree with* higher-TF contributors at the same price is structural — the same level shows up no matter which timescale you measure from. The engine treats HTF agreement as a primary input to the star rating: HTF-aligned zones can earn an extra star (capped to prevent inflation).
**The clustering is where the value emerges.** Individually, none of these components produce reliable levels. AVWAP gets broken constantly. POC migrates. Pivot levels get violated. But when the engine sees that the 21-pivot AVWAP, the 34-pivot POC, the 8-pivot VAL, and a 1H AVWAP all land within 0.08% of each other at the same price, that's a confluence of independent references measuring different things — and that *coincidence* is what produces structural significance. The star rating quantifies how much agreement is present.
This is the mashup's purpose: not to combine indicators for their own sake, but to use convergence as a filter that turns individually noisy components into a rated structural signal.
---
## How to use the indicator
**Step 1: Apply to any chart timeframe.** All settings have sensible defaults. The asset-class preset (NSE Index Futures, NSE Stock, US Future, US ETF, US Stock, Commodity, Crypto, or Custom) auto-adjusts cluster tolerance and pivot defaults. Auto-selected higher timeframes scale with the chart — a 5m chart defaults to 15m/60m/240m HTFs, while a daily chart defaults to weekly/monthly HTFs.
**Step 2: Read the status panel (bottom-right).** This is the actionable summary:
- "Sup" row: nearest resolved Support below current price, with point distance
- "Res" row: nearest resolved Resistance above current price, with point distance
- "Top zone": the highest-rated zone overall
- "Data": indicator health (OK / Degraded / Critical) — if the underlying volume data is sparse, ratings are capped
**Step 3: Scan the chart for "Broken" labels.** Any zone in dashed orange with a "Broken" label is currently being violated. Watch for either recovery (border returns solid) or polarity flip confirmation (zone repaints to opposite role).
**Step 4: Find the active amber zone.** This is the current forming confluence. Look at the triangle shape: ▲ means the composition leans support, ▼ means it leans resistance, ◆ means neutral. The number next to the triangle is the star rating. A premium "★" prefix means HTF agreement is present.
**Step 5: Use the Major S/R lines as forward references.** Bold horizontal lines mark the top 2 strongest support levels below current price and top 2 strongest resistance levels above. Labels show price, stars, and distance.
**Step 6: Use the Range band as context.** The translucent aqua band marks the recent trading envelope (default last 50 bars). A narrow band means consolidation; a wide band means trending.
**Step 7: Hover any element for the full breakdown.** Every box, triangle, and line has a tooltip showing total contributors, type counts, HTF alignment, state, and history.
---
## How NOT to use the indicator
- **Do not treat the bias arrow as a trade signal.** It is a compositional description of contributors, not a directional forecast. A zone with a ▲ bias can still resolve as resistance.
- **Do not treat a "Broken" label as a trade trigger.** It tells you a known level is failing — not that you should enter a position in either direction.
- **Do not assume higher stars mean higher profit probability.** Stars measure the diversity and density of contributors, not historical performance or expected return.
- **Do not rely on it for low-volume instruments.** If the data-health badge shows "Degraded" or "Critical," the engine has capped ratings and may suppress zones entirely. This is a feature; the indicator is most accurate on liquid, volume-rich instruments (index futures, large-cap stocks, major crypto).
---
## How to read the star rating
Stars are a descriptive summary of confluence quality. They are not a probability of profit.
- 1 to 2 stars: minimum cluster; one or two source types. Background context.
- 3 stars: at least 5 contributors with 2 or more source types. Recurring intraday levels.
- 4 stars: at least 7 contributors with 3 or more source types, OR 3-star with HTF agreement.
- 5 stars: at least 10 contributors with all 4 source types present. Often boosted by HTF alignment.
By default, only 4-star and 5-star zones get triangle markers and qualify for Top-N or Major S/R lines. This is adjustable.
---
## Visual primitives
- **Confluence zones** — colored boxes marking each cluster. Boxes recolor as zones resolve. Border style indicates compromised state.
- **Triangle markers** — ▲ ▼ ◆ at each formation bar. Shape encodes direction. Color encodes lifecycle state.
- **Top-N S/R lines** — top 4 resolved zones by strength and recency project forward.
- **HTF confluence bands** — semi-transparent bands per higher timeframe (cyan, purple, orange).
- **Major S/R lines** — bold lines for top 2 supports below and top 2 resistances above current price.
- **Range band** — translucent band marking recent trading range with HI / LO labels.
- **Current price line** — thin dotted line at current price.
- **Status panel** — bottom-right summary.
---
## Technical notes
- Pine Script v6
- Non-repainting: all `request.security` calls use `barmerge.lookahead_off`
- Asset-class presets adjust cluster tolerance and pivot defaults
- Built-in data-integrity layer caps ratings when volume data is sparse or stale
- Seven alert conditions: new zone formed, high-quality (4 to 5 star) zone, HTF aligned, price entered support, price entered resistance, data health degraded, polarity flip
---
## Important risk disclosure
This indicator is provided for educational and informational purposes only and is not financial advice. Trading and investing involve substantial risk of loss, including the possible loss of all invested capital. The zones, ratings, bias shapes, and lines are descriptive summaries of structural confluence — they are not predictions of future price movement, indications of profitability, win rate, or expected return.
No backtested or hypothetical performance is claimed or implied. Past zones identified by the indicator are not indicative of future results.
You are solely responsible for any decisions you make. Consult a qualified, licensed financial advisor before trading. Past performance does not guarantee future results.
Indicateur

Indicateur

Indicateur

80-20 Levels (NQ)80-20 Levels (NQ) plots psychological round-number price levels for Nasdaq futures (NQ) and color-codes them relative to VWAP. The idea: prices ending in .80 and .20 (e.g. 28,780.00, 29,520.00) act as recurring magnet/reaction zones intraday. Pairing them with VWAP gives you instant context on whether each level sits in "premium" (above VWAP) or "discount" (below VWAP) territory.
What it does
80/20 levels — draws horizontal lines at every price ending in .80 and .20, automatically re-centered around live VWAP as price moves.
VWAP-relative coloring — levels above VWAP are red, levels below VWAP are green, so bias is readable at a glance.
VWAP line — standard intraday session VWAP (resets each session), plotted in orange.
Price-axis labels — each level's price prints as a color-matched tag directly on the right-hand price scale.
New York session range box — a table showing the total NY session range (high − low) plus the session high/low, in the corner of your choice.
Settings
Setting Description
Levels past VWAP (each side) How many 80/20 levels to show on each side of VWAP. e.g. 4 = 4 green levels below VWAP and 4 red levels above (1–10).
Show VWAP Show/hide the VWAP line.
Show price-axis labels Show/hide the per-level price tags on the right axis.
Above VWAP color Color for levels above VWAP (default red).
Below VWAP color Color for levels below VWAP (default green).
Level line width Thickness of the level lines (1–4).
Show NY session range Show/hide the session-range box.
Range box position Corner/edge for the box (Top Right, Top Center, Top Left, Middle Right/Left, Bottom Right/Center/Left).
Range box size Text size: Tiny / Small / Normal / Large / Huge.
New York session Session window (default 0930-1600).
Session timezone Default America/New_York.
⚠️ Required setup: enable price-axis labels
The level price tags use Pine's display.price_scale, which only renders if the chart's price scale has value labels enabled. This is a one-time chart setting, not part of the script — so include this in your published description:
Right-click the price scale (the price axis on the right edge of the chart).
Hover Labels in the menu that appears.
Click "Indicators and financials value labels" so it shows a checkmark.
The red/green level tags will appear on the axis immediately. If this option is off, the levels still draw on the chart but the axis price tags won't show.
Notes: this is a per-chart/layout setting and applies to all indicators' value labels, so you'll need to enable it on any new chart where you add the indicator. The indicator's own "Show price-axis labels" toggle controls whether this indicator contributes tags.
Suggested use
Designed for NQ (also works on MNQ / NQ1!). The .80/.20 logic assumes NQ's price magnitude; on very different instruments the spacing won't be meaningful.
Best on intraday timeframes where VWAP and the NY session are relevant.
Watch for reactions as price approaches a level; use the red/green VWAP context to frame whether you're fading into premium or buying discount. Indicateur

Indicateur

Indicateur