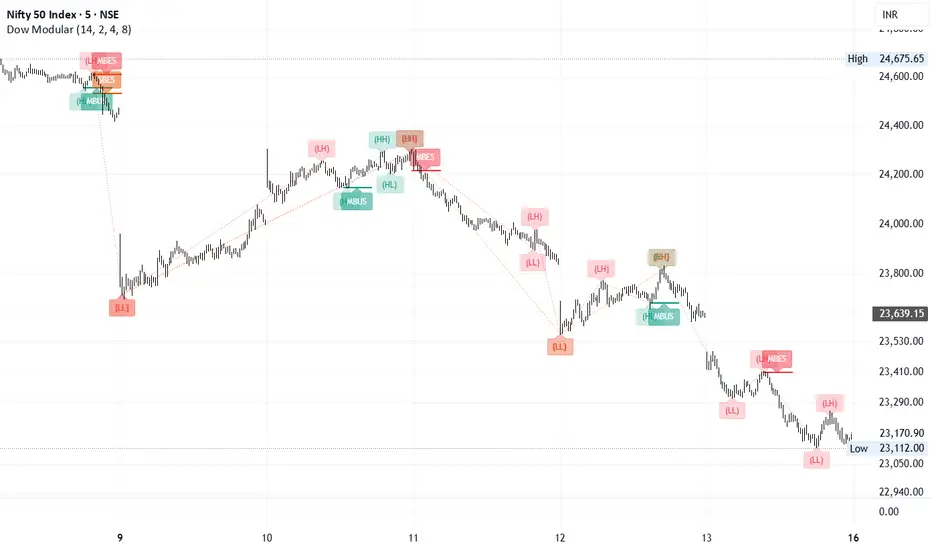
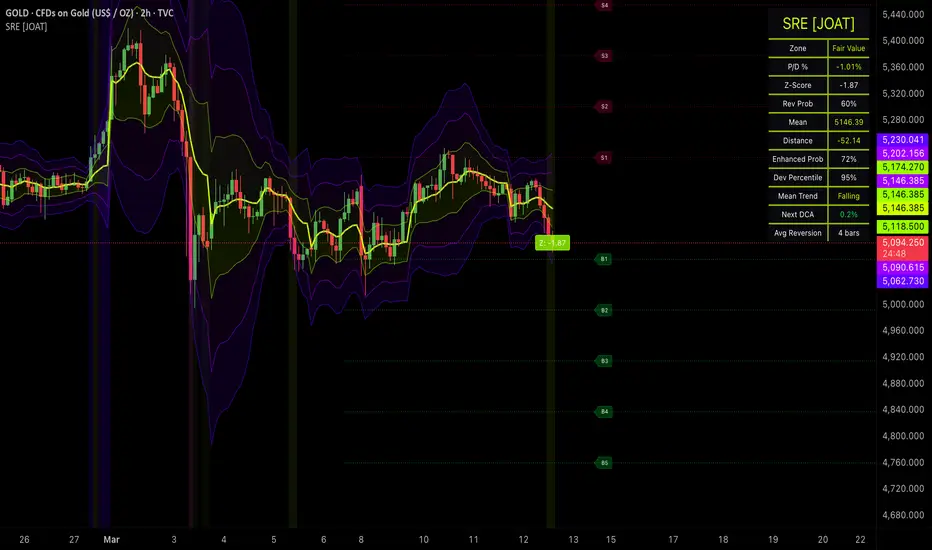
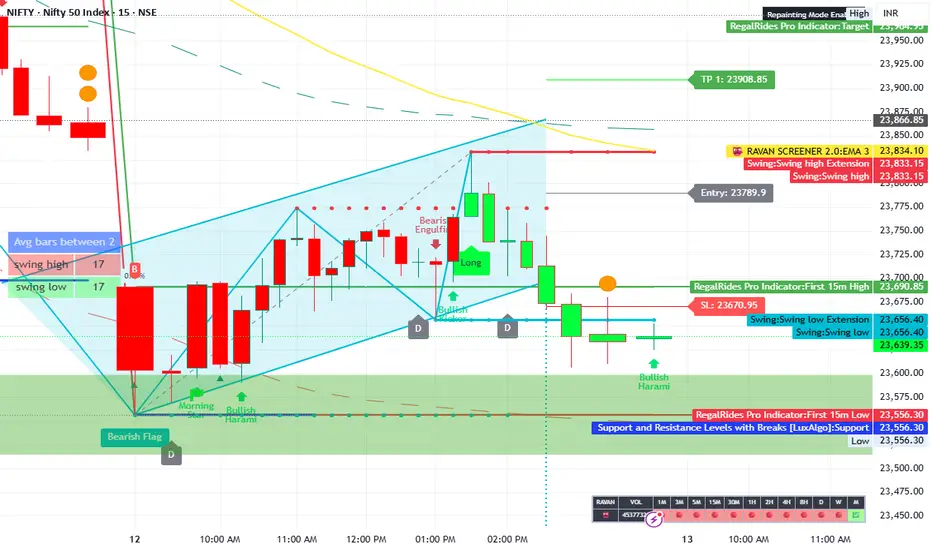
Adaptive Pivot Circles▶Overview
The Adaptive Pivot Circles is a unique geometric indicator that visualizes dynamic market volatility and potential support/resistance zones. Instead of relying on traditional horizontal lines or linear trends, this script projects historical price and time movements into two-dimensional geometric circles.
By applying a Kalman Filter to the distances between historical pivots, the indicator calculates an adaptive, noise-resistant average radius, providing a highly responsive and visually stunning representation of market cycles.
▶Core Concepts & Mechanics
1. Advanced Pivot Detection with ATR Filtering
The script identifies significant Pivot Highs (PH) and Pivot Lows (PL) across the chart. To eliminate market noise and prevent minor pullbacks from distorting the geometry, a built-in ATR Filter is applied. A pivot is only considered valid if its height/depth exceeds a specified multiple of the Average True Range (ATR).
2. Adaptive Radius via Kalman Filter
Most indicators use Simple Moving Averages (SMA) to calculate historical data, which inherently introduces lag. This indicator utilizes a 1D Kalman Filter to estimate the "true" historical radius—measuring both time (X-axis, bars) and price (Y-axis)—between similar pivots (i.e., PH to PH, and PL to PL).
Process Noise (Q): Controls how quickly the filter adapts to new data.
Measurement Noise (R): Controls how much the filter smooths out sudden spikes.
3. Geometric Projection (The Rolling Circles)
When a new pivot is confirmed, the script projects the anticipated market boundaries. The geometric concept is based on a circle connecting the current pivot to the previous one. If you roll that connecting circle around the current pivot, it creates an outer boundary.
To visualize this, the indicator draws two concentric zones around the newly formed pivot:
Inner Ring: Radius is 2x the Kalman-averaged historical radius.
Outer Ring: Radius is 4x the Kalman-averaged historical radius.
▶Key Features & Settings
Kalman Filter Tuning: Fully adjustable Process Noise (Q) and Measurement Noise (R) allow you to fine-tune the algorithm for different timeframes and assets.
Visual Aesthetics (Polyline Drawing): Built using Pine Script v5's advanced polyline drawing objects, the indicator features smooth curves, customizable fill transparencies, and a beautiful Glow Effect (layering transparent thick lines under crisp main lines).
Performance Optimization: You can adjust the Circle Resolution (number of points) to balance between perfect roundness and script rendering performance.
Historical Cleanup: Automatically cleans up old projections to keep your chart uncluttered. Adjust Max History Circles to determine how many recent cycles remain visible.
▶How to Use
Dynamic Support & Resistance: The circumferences of the projected circles often act as non-linear support and resistance levels. Watch for price action reactions as the market approaches the Inner or Outer Rings.
Volatility Gauge: The size of the circles visually represents the current market volatility and the length of recent price swings.
Confluence: Use these geometric projections in conjunction with your existing strategies (e.g., Fibonacci, Volume Profile) to find high-probability reversal zones where price intersects with the circle boundaries.
Disclaimer: This script is for educational and visual purposes only. Geometric projections are not guarantees of future price action. Always use proper risk management. Indicateur

Lattice Trend Helix [JOAT]Lattice Trend Helix
Introduction
The Lattice Trend Helix is an open-source trend analysis indicator built in Pine Script v6. It combines a GMMA-inspired multi-EMA fan system (19 exponential moving averages across fast and slow groups) with a pivot-center SuperTrend, RSI momentum confirmation, and a comprehensive trend strength scoring system. The indicator detects EMA fan alignment, measures trend strength on a 0-100 scale, identifies fan expansion/contraction dynamics, and generates priority-ranked signals including full confluence locks, fan crosses, SuperTrend flips, EMA 200 reclaims, fan burst breakouts, SuperTrend bounces, and displacement impulses.
The Guppy Multiple Moving Average (GMMA) concept, originally developed by Daryl Guppy, uses two groups of EMAs to visualize the behavior of short-term traders (fast group) and long-term investors (slow group). When both groups are aligned and separated, a strong trend is in place. When they converge and cross, a trend change is developing. This indicator extends the GMMA concept by adding a pivot-based SuperTrend for dynamic support/resistance, RSI filtering for momentum confirmation, and a quantified scoring system that turns visual alignment into a measurable number.
Why This Indicator Exists
Single moving average crossover systems are prone to whipsaws. Even dual-MA systems produce frequent false signals in choppy markets. The GMMA approach solves this by requiring alignment across many EMAs simultaneously — a much higher bar than a simple crossover. This indicator takes that concept further:
19-EMA Fan System: 11 fast EMAs (periods 3 through 23) capture short-term trader sentiment. 8 slow EMAs (periods 25 through 60) capture longer-term investor positioning. Full alignment of all 11 fast EMAs in order is a strong signal that short-term traders agree on direction. Full alignment of all 8 slow EMAs confirms institutional agreement.
Pivot-Center SuperTrend: Unlike standard SuperTrend which uses HL2 as the center, this implementation uses a weighted average of detected pivot points. Each new pivot high or low updates the center using the formula: center = (center * 2 + pivot) / 3. This creates a more responsive center line that adapts to actual market structure rather than simple bar midpoints. ATR-based bands around this center define the trend direction.
Trend Strength Score (0-100): Quantifies trend strength from three components — fast EMA alignment (50 points), slow EMA alignment (30 points), and price position relative to EMA 200 (20 points). A score of 100 means all 19 EMAs are perfectly aligned and price is on the correct side of the 200 EMA.
Fan Spread Dynamics: The distance between the fastest EMA (3) and slowest fast EMA (23), normalized by ATR, measures how "open" the fan is. An expanding fan indicates strengthening trend momentum. A contracting fan warns of potential trend exhaustion or reversal.
RSI Momentum Filter: RSI must agree with the fan direction for the highest-confidence signals. This prevents false confluence signals during momentum divergences.
EMA 200 Macro Filter: Price must be above the 200 EMA for confirmed bullish signals and below for confirmed bearish signals, ensuring alignment with the macro trend.
How the EMA Fan Alignment Works
The fast fan consists of 11 EMAs at periods 3, 5, 7, 9, 11, 13, 15, 17, 19, 21, and 23. For bullish alignment, every EMA must be above the next longer one:
// Full fast fan bull alignment requires ALL 10 pairs in order
bool fastBull = ef3 > ef5 and ef5 > ef7 and ef7 > ef9 and ef9 > ef11
and ef11 > ef13 and ef13 > ef15 and ef15 > ef17
and ef17 > ef19 and ef19 > ef21 and ef21 > ef23
This is an extremely high bar. In choppy markets, the fast EMAs will be tangled and neither fastBull nor fastBear will be true. Only in genuine trending conditions do all 11 EMAs sort into perfect order. The same logic applies to the 8 slow EMAs.
The indicator counts how many adjacent pairs are aligned (0-10 for fast, 0-7 for slow) to produce a granular alignment score even when full alignment is not achieved. This allows the trend strength score to reflect partial alignment — a market with 8/10 fast pairs aligned is stronger than one with 4/10, even though neither achieves full alignment.
Pivot-Center SuperTrend
The SuperTrend component uses a unique center calculation based on detected pivot points:
Pivot highs and lows are detected using ta.pivothigh() and ta.pivotlow() with a configurable period
Each new pivot updates the center line using an exponentially weighted formula that gives 2/3 weight to the existing center and 1/3 to the new pivot
Upper and lower bands are calculated as center +/- (ATR Factor * ATR)
Trend direction flips when price crosses the opposite band
The trailing stop ratchets in the trend direction — it can only move favorably, never against the trend
This pivot-based center produces a SuperTrend that is more responsive to actual market structure than the standard HL2-based version. It adapts to the rhythm of the market's swing points rather than just the midpoint of each bar.
Signal Priority System
The indicator generates 8 types of signals, ranked by priority with cooldown-based anti-overlap:
P1 — HELIX LOCK (highest): Full fan alignment (fast + slow) + RSI confirmation + price above/below EMA 200. This is the maximum confluence signal — every factor agrees. A highlight box is drawn around the signal candle.
P2 — LATTICE SYNC: Full fan alignment (fast + slow) without RSI/EMA200 confirmation. Strong but not maximum confluence.
P3 — TREND FLIP: SuperTrend direction change. The pivot-center SuperTrend has flipped from bearish to bullish or vice versa.
P4 — FAN CROSS: The fast fan median (EMA 13) crosses the slow fan median (EMA 40). This is the GMMA equivalent of a moving average crossover, but using the center of each fan group.
P5 — MACRO CROSS: Price crosses the EMA 200 — a major structural event that changes the macro trend context.
P6 — FAN BURST: The fan spread transitions from contracting to expanding while the trend score is above 50. This indicates a breakout from compression — similar to a Bollinger squeeze release but measured through EMA dynamics.
P7 — ST BOUNCE: Price touches the SuperTrend line and bounces in the trend direction. This is a pullback-to-support/resistance signal unique to this indicator. A separate 5-bar cooldown prevents repeated bounce signals during extended touches.
P8 — IMPULSE (lowest): Displacement candle detection — large body (>70% of range, >2x average body). These indicate aggressive institutional order flow.
Trend Strength Score Breakdown
The 0-100 score is computed from three weighted components:
Fast EMA Alignment (50 points): The number of aligned adjacent pairs (max 10) divided by 10, multiplied by 50. Full fast alignment = 50 points. Half alignment = 25 points.
Slow EMA Alignment (30 points): The number of aligned adjacent pairs (max 7) divided by 7, multiplied by 30. Full slow alignment = 30 points.
EMA 200 Filter (20 points): If price is above EMA 200 and the fast fan leans bullish, or below EMA 200 and the fast fan leans bearish, 20 points are added. This rewards macro-aligned trends.
The score is displayed in the HUD with both a number and a visual bar (||||......). Scores above 70 indicate strong, tradeable trends. Scores between 40-70 indicate developing or weakening trends. Below 40 indicates choppy or transitional conditions.
Visual Design
The indicator uses a "Cyberpunk" color theme — electric cyan, hot magenta, neon yellow, deep violet, and chrome accents:
Fast EMA Fan: All 11 lines in a single color that adapts to alignment — cyan for bullish, magenta for bearish, steel grey for neutral. Configurable opacity.
Slow EMA Fan: All 8 lines in deeper tones — teal for bullish, violet for bearish, steel grey for neutral.
EMA 200: Three-layer neon glow effect (outer glow, mid glow, core line) that shifts between cyan (above) and violet (below).
Holographic Ribbon: Fill between the fastest (EMA 3) and slowest (EMA 23) fast EMAs, creating a ribbon that expands with trend strength and contracts during consolidation.
SuperTrend: Four-layer neon glow step-line (88%, 72%, 50%, 10% transparency) in cyan (bullish) or magenta (bearish).
Regime Background: Subtle background tinting for confirmed bull (cyan) or confirmed bear (magenta) conditions.
Candle Coloring: Multi-tier coloring based on confirmation level — confirmed bull/bear, strong bull/bear, weak bull/bear, or neutral.
HUD Dashboard
The HUD displays 14 metrics:
Trend direction (Bullish/Bearish/Neutral)
Strength score with visual bar (||||......)
Fan state (Strong Bull/Bear, Weak Bull/Bear, Converging)
SuperTrend direction
EMA 200 position (Above/Below)
Alignment counts (Fast: X/10, Slow: X/7)
Fan Spread value with state (Expanding/Contracting/Stable)
RSI value with bull/bear/neutral classification
Confluence count (0-5): fast alignment + slow alignment + SuperTrend agreement + RSI agreement + EMA 200 agreement
SuperTrend distance from price
Volume ratio (current vs 20-bar average)
Confirmed signal status (CONFIRMED BULL/BEAR or ---)
Input Parameters
EMA Fan:
Show Fast/Slow EMAs: Toggle each fan group
Show EMA 200: Toggle macro filter line
Fast/Slow EMA Opacity: Control transparency of each fan group
SuperTrend:
Show SuperTrend: Toggle the pivot-center SuperTrend
Pivot Period: Lookback for pivot detection (default: 3)
ATR Factor: Band width multiplier (default: 2.5)
ATR Length: Period for ATR calculation (default: 14)
Visual:
Show Trend Ribbon: Toggle holographic ribbon fill
Show Fan Crosses: Toggle fan cross signals
Show Regime Background: Toggle background tinting
SuperTrend Neon Glow: Toggle 4-layer glow effect
Color Candles: Toggle multi-tier candle coloring
HUD Panel: Toggle dashboard
Momentum Filter:
Show RSI Confirmation: Toggle RSI requirement for confirmed signals
RSI Length: Period (default: 14)
RSI Bull/Bear Threshold: Directional thresholds (default: 55/45)
How to Use This Indicator
Step 1: Check Fan Alignment
Look at the fan state in the HUD. "Strong Bull" or "Strong Bear" means both fast and slow fans are fully aligned — the strongest trend condition. "Weak" means only the fast fan is aligned — a developing or weakening trend.
Step 2: Verify with SuperTrend
The SuperTrend should agree with the fan direction. Fan bullish + SuperTrend bullish = high conviction. Disagreement suggests a transitional market.
Step 3: Check the Strength Score
Scores above 70 are strong trends. Use the visual bar for quick assessment. The confluence count (0-5) tells you how many independent factors agree.
Step 4: Trade the Signals
HELIX LOCK is the highest-conviction entry — all factors agree. LATTICE SYNC and TREND FLIP are strong. FAN CROSS and MACRO CROSS are structural. ST BOUNCE provides pullback entries within established trends.
Step 5: Monitor Fan Spread
Expanding fan = strengthening trend. Contracting fan = weakening trend or approaching reversal. FAN BURST signals mark the transition from contraction to expansion.
Best Practices
The 19-EMA fan is most effective on timeframes of 5 minutes and above. Very low timeframes produce too much noise for meaningful alignment.
Full fan alignment is rare and powerful. Do not expect it on every trade — it represents the highest-conviction conditions.
The SuperTrend bounce signal works best in established trends. In choppy markets, bounces may fail.
Fan crosses (fast median vs slow median) are the GMMA equivalent of MA crossovers — they confirm trend changes but lag the actual turn.
The EMA 200 filter is a macro-level gate. Ignoring it means trading against the larger trend, which reduces probability.
Use the fan spread dynamics to time entries — entering when the fan is expanding gives you momentum. Entering when it is contracting means you are fighting exhaustion.
The confluence count (0-5) is a quick decision filter. 4-5 = high conviction. 2-3 = moderate. 0-1 = low conviction.
Limitations
EMAs are lagging indicators. Full fan alignment is confirmed after the trend has already started, not at the exact turn.
The 19-EMA system uses significant computational resources. On very long charts with many bars, loading may be slower.
Pivot-center SuperTrend depends on pivot detection, which has an inherent delay equal to the pivot period.
Fan alignment can persist in overextended trends. Full alignment does not mean the trend will continue indefinitely.
The RSI filter can occasionally prevent valid signals during strong momentum divergences.
The indicator is optimized for trending markets. In range-bound conditions, the fan will be tangled and few signals will fire — which is by design.
EMA periods are fixed (3-23 fast, 25-60 slow). Different instruments or timeframes might benefit from different period sets, but the GMMA standard periods are well-tested across markets.
Technical Implementation
Built with Pine Script v6 using:
19 EMA calculations at global scope (11 fast + 8 slow) for Pine v6 compliance
Pivot-based SuperTrend center with exponentially weighted pivot averaging
Granular alignment counting (0-10 fast, 0-7 slow) for trend strength scoring
Fan spread normalization by ATR for cross-instrument comparability
8-tier priority signal system with cooldown-based anti-overlap
Separate cooldown tracking for SuperTrend bounce signals
4-layer neon glow rendering for SuperTrend and EMA 200
Holographic ribbon fill between fan extremes
Multi-tier candle coloring based on confirmation level
barstate.isconfirmed gating on all signal generation
9 alert conditions covering alignment changes, fan crosses, SuperTrend flips, confirmed signals, and fan expansion
Originality Statement
This indicator is original in its synthesis of the GMMA fan concept with pivot-center SuperTrend and quantified trend scoring. While GMMA and SuperTrend are established concepts, this indicator is justified because:
The pivot-center SuperTrend uses a weighted average of actual market pivots rather than simple HL2, creating a more structurally responsive trend line
The trend strength score (0-100) quantifies fan alignment into a single actionable metric with three weighted components
Fan spread dynamics (expansion/contraction tracking normalized by ATR) provide momentum acceleration/deceleration information not available in standard GMMA implementations
The 8-tier priority signal system with separate cooldown tracking for SuperTrend bounces prevents visual clutter while capturing all significant events
RSI momentum filtering and EMA 200 macro gating create a multi-layer confirmation framework that reduces false signals
The confluence count (0-5) provides an instant assessment of how many independent factors agree
The Cyberpunk theme with 4-layer neon glow and holographic ribbon creates a distinctive visual identity where trend strength is immediately apparent from the fan's visual character
Disclaimer
This indicator is provided for educational and informational purposes only. It is not financial advice or a recommendation to buy or sell any financial instrument. Moving average systems identify trends after they have started — they do not predict trend changes in advance. Full fan alignment can occur in overextended trends that are about to reverse. SuperTrend bounces can fail. Past alignment patterns do not guarantee future trend behavior. Always use proper risk management and never risk more than you can afford to lose. The author is not responsible for any losses incurred from using this indicator.
-Made with passion by officialjackofalltrades
Indicateur

Institutional Volume Profile [Quantum Algo]Institutional Volume Profile
Developed by QuantumAlgo
█ OVERVIEW
The Institutional Volume Profile by Quantum Algo is a next-generation volume profile indicator that goes far beyond what standard volume profile tools offer on TradingView. While most volume profile scripts render a static histogram with flat coloring, Quantum Algo's Institutional Volume Profile introduces gradient heat mapping, buy/sell delta visualization, automatic node classification, a migration trace for tracking institutional repositioning, and a live analytics dashboard — all in one overlay.
This is the volume profile that institutional desks use, rebuilt for TradingView by QuantumAlgo.
Institutional Volume Profile by Quantum Algo — gradient heat map mode on BTCUSDT Perpetual showing Control Level, Equilibrium Zone edges, and analytics dashboard.
The gradient heat map mode above shows how volume density is distributed across price. Warmer tones (vivid cyan) indicate heavy institutional participation. Cooler tones (muted gray) indicate thin levels where price passed through quickly. The Control Level (amber line) marks peak density. Dashed cyan lines mark the Equilibrium Zone boundaries. The analytics dashboard in the corner provides real-time readouts of all key levels.
█ WHAT MAKES THIS DIFFERENT FROM OTHER VOLUME PROFILES
Most volume profile indicators on TradingView — including the top-ranked ones — share the same limitations: flat single-color bars that make every level look equally important, no way to see buy vs sell dominance within the profile, no automatic identification of high-volume and low-volume nodes, and no live dashboard showing where current price sits relative to the value area.
The Quantum Algo Institutional Volume Profile solves every one of these problems:
Flat bars → Gradient heat mapping that instantly shows which levels carry real institutional weight
No directional insight → Buy/sell delta coloring that reveals hidden directional bias at every price level
No node detection → Automatic Dense Node and Void Node classification with configurable thresholds
No context → Live analytics panel showing Control Level, Equilibrium Zone edges, total density, zone width, and whether price is in Premium, Discount, or Equilibrium
Static POC → Optional Migration Trace showing how the control level drifts over time as institutions reposition
This combination of features does not exist in any other volume profile indicator on TradingView. Built entirely from scratch by Quantum Algo using a proprietary direct-mapped accumulation engine.
█ SEVEN CORE FEATURES
▸ 1 — Gradient Heat Mapping
Every row in the profile transitions smoothly from cool (sparse volume, muted gray) to warm (dense volume, vivid cyan) based on its density relative to the peak. Inside the Equilibrium Zone, the gradient shifts to a brighter cyan spectrum. The result is an instant visual heat map — your eye is drawn to the institutional clusters without reading a single number.
Institutional Volume Profile by Quantum Algo — heat map with Equilibrium Zone shading on BTCUSDT Perpetual]
Above: The heat map creates a clear visual hierarchy. The densest levels glow bright while thin levels fade into the background. The Equilibrium Zone (between the dashed lines) stands out as the fair value range.
▸ 2 — Buy/Sell Delta Background
When enabled, the profile bars are colored by directional dominance at each price level. Levels where buy-side volume exceeds sell-side show green. Levels where sell-side dominates show red. Neutral levels fall back to the standard color scheme. The intensity of the green or red scales with how extreme the dominance is.
Institutional Volume Profile by Quantum Algo — delta mode showing buy-side (green) and sell-side (red) dominance on BTCUSDT Perpetual]
Above: Delta mode reveals the directional story hidden inside the aggregate profile. You can immediately see where buyers were dominant (green zones) versus where sellers controlled the action (red zones). This is information that a standard flat-colored volume profile completely hides from you.
▸ 3 — Control Level with Style Options
The Control Level is the single price with peak accumulated density — the center of institutional gravity. Drawn as a prominent horizontal line extending across the full analysis window with configurable color, weight, and line style (Solid, Dashed, or Dotted). In the analytics panel, the exact price is displayed for precision.
▸ 4 — Equilibrium Zone (Value Area)
The zone containing the configured share of total density (default 68%, matching one standard deviation). All rows within the zone receive boosted coloring — brighter gradient in heat map mode, stronger delta colors in delta mode. Upper and lower edge lines are drawn as dashed horizontals for use as dynamic support and resistance.
Price above the upper edge is in Premium territory. Price below the lower edge is in Discount. Price inside is at Equilibrium. The analytics panel shows which context applies in real time.
▸ 5 — Dense Node and Void Node Classification
The indicator automatically scans the completed profile and labels levels as Dense Nodes (HVN — abnormally high density, strong S/R magnets) or Void Nodes (LVN — negligible density, fast-travel zones). Thresholds are configurable as multiples of the profile mean. Labels appear on the right edge of the profile for instant identification.
▸ 6 — Migration Trace (Developing POC)
An optional feature that tracks how the Control Level migrates over the scan window. A dotted trail is drawn showing where peak density sat at each sampling interval as the session developed. A flat trace means institutions were committed to one level. A migrating trace reveals active repositioning. This is a feature available on institutional platforms like Sierra Chart and Bookmap, brought to TradingView by QuantumAlgo.
▸ 7 — Live Analytics Dashboard
A compact on-chart panel displays key profile metrics in real time: Control Level price, Equilibrium Zone upper and lower edges, total accumulated density (formatted as K/M/B), zone width in price terms, and whether current price is in Premium, Discount, or Equilibrium. The panel follows the Quantum Algo dark design language and updates automatically.
Institutional Volume Profile by Quantum Algo — full feature view with analytics dashboard, Equilibrium Zone, and Control Level on BTCUSDT Perpetual]
Above: The complete Quantum Algo Institutional Volume Profile with all features active — gradient heat mapping, Control Level, Equilibrium Zone edges, and the analytics dashboard providing full context at a glance.
█ HOW TO USE
Control Level as gravity — In ranges, price oscillates around it. A sustained break with volume confirms a directional move.
Equilibrium edges as dynamic S/R — Longs near the lower edge with stops below. Shorts near the upper edge with stops above. These levels are grounded in actual institutional participation.
Delta mode for directional bias — Switch on delta coloring to see if institutions were net buyers or net sellers at each level. If the profile shows heavy green below current price and heavy red above, the structure is bullish.
Dense Nodes as reversal zones — When price approaches a Dense Node, expect consolidation or reversal. Position for mean reversion.
Void Nodes as acceleration zones — When price enters a Void Node, expect fast movement to the next Dense Node.
Dashboard context — If the panel shows "Discount," you are below the zone — look for longs. "Premium" means above — look for shorts or exit longs. "Equilibrium" means inside fair value — range conditions.
█ SETTINGS
📐 Scan Window — Auto-fit to visible or fixed bar count up to 3000.
📊 Resolution & Layout — Vertical resolution up to 490 levels, row weight, horizontal spread, chart margin.
⚡ Participation Filter — All Participants, Buy-Side Only, or Sell-Side Only.
📊 Delta Background — Toggle buy/sell dominance coloring with customizable buy and sell tones.
🌈 Heat Mapping — Toggle gradient visualization with customizable warm and cool tones.
🎯 Control Level — Toggle, weight, tone, and line form (Solid/Dashed/Dotted).
📈 Migration Trace — Toggle and customize the developing POC trail color.
🏦 Equilibrium Zone — Set the share percentage, toggle edge lines, customize tone and weight.
🔥 Node Classification — Independent toggles for Dense and Void nodes with configurable detection thresholds.
📋 Analytics Panel — Toggle, choose corner position.
█ RECOMMENDED SETTINGS
Crypto perpetual futures on 1H to Daily: default 200-bar scan, 490 vertical resolution. Lower timeframes (5m, 15m): reduce scan to 100-150 bars. Weekly/Monthly: increase to 500-1000 bars.
For delta mode, compare the profile with delta on and off — sometimes the aggregate profile shows a symmetrical shape, but delta reveals that one side is overwhelmingly dominant. This hidden bias is invisible on standard volume profile indicators.
The Institutional Volume Profile pairs naturally with other Quantum Algo tools. Use it alongside the Zeno oscillator by Quantum Algo for timing entries within the structural framework the volume profile provides.
█ ARCHITECTURE
Unlike standard volume profile scripts that scan all price levels for every bar (O(bars × levels)), the Quantum Algo engine uses direct range-mapped accumulation: each bar's high/low range is mapped to level indices first, then volume is distributed only across the touched levels. This produces the same accurate result with significantly fewer operations, enabling 490-level resolution without performance issues.
The rendering pipeline is split into seven independent phases — accumulate, analyze, render rows, render control and edges, trace migration, classify nodes, and build the analytics panel — each handling a distinct responsibility. This modular architecture is unique to QuantumAlgo on TradingView.
█ NOTES
Pine Script v6. Overlay indicator. Direct-mapped accumulation engine. Supports up to 490 vertical levels and 3000-bar scan windows. All drawing objects managed within TradingView limits. Scale-anchored for correct overlay behavior.
Built by Quantum Algo. Part of the Quantum Algo institutional analysis suite developed by QuantumAlgo. Indicateur

AA Smart Structure EngineAA Smart Structure Engine — Market Structure & Impulse Signals
📄 DESCRIPTION
AA Smart Structure Engine is a market structure indicator designed to identify potential trend continuations and reversals using a combination of:
Higher High / Lower High (HH / LH)
Lower Low / Higher Low (LL / HL)
Impulse candle confirmation (ATR + candle strength)
The indicator provides clear BUY and SELL signals based on confirmed price structure and momentum.
⚙️ How It Works
The indicator uses pivot-based structure detection to define key market movements:
HH (Higher High) — potential exhaustion in uptrend
LH (Lower High) — continuation of bearish structure
LL (Lower Low) — potential exhaustion in downtrend
HL (Higher Low) — continuation of bullish structure
A signal is only generated when structure aligns with a valid impulse candle, defined as:
Candle body > 50% of total range
Candle body > ATR × impulse factor
📈 Signal Logic
BUY Signal:
LL or HL structure formed
Bullish impulse candle
Confirmed closed candle
SELL Signal:
HH or LH structure formed
Bearish impulse candle
Confirmed closed candle
The indicator includes a built-in filter to avoid duplicate signals in the same direction.
🎯 Key Features
Market structure detection (HH, HL, LH, LL)
Impulse-based confirmation (ATR + candle strength)
No repaint (signals appear only after candle close)
Clean visual signals (BUY / SELL labels)
Customizable signal colors
⚙️ Inputs
Pivot Length — controls structure sensitivity
ATR Length — volatility calculation period
Impulse Strength — defines candle strength threshold
BUY / SELL Colors — visual customization
📌 How to Use
This indicator can be used as:
An entry confirmation tool
A trend-following filter
A market structure shift detector
Best used in combination with:
Higher timeframe analysis
Support and resistance levels
Trend filters (EMA, Kijun, etc.)
⚠️ Disclaimer
This indicator does not guarantee profits and should not be considered financial advice.
Always use proper risk management and combine it with a broader trading strategy.
🏷️ TAGS
market structure, smart money, price action, trend, forex, crypto, trading Indicateur

MvH Horizontal LevelsHorizontal Levels — Custom Price Level Overlay
A lightweight overlay indicator that lets you define and display labeled horizontal price levels directly on your chart. Designed for futures traders working with key support, resistance, breakout, and target levels on instruments like NQ, ES, DAX, FTSE, and others.
█ HOW IT WORKS
Instead of manually drawing lines on every chart, you define all your levels in a single text input field using a simple comma-separated format. The indicator parses your input and draws color-coded horizontal lines with bold, right-aligned labels that stay pinned to the right edge of the chart — visible across all timeframes.
█ INPUT FORMAT
Each line in the input field represents one level:
Time,Price,Color,Alignment,Text
• Time — UNIX timestamp in seconds (marks where the line begins)
• Price — the price level (integer)
• Color — one of six predefined colors: Orange, Turquoise, Green, Bright Red, Dark Red, Pink
• Alignment — "Top" (label above line) or "Bottom" (label below line)
• Text — descriptive label ending with a colon
Example input:
1774013400,25465,Turquoise,Top,Full Long Breakout:
1774013400,25385,Orange,Top,Target 1:
1774013400,25035,Bright Red,Bottom,Resistance:
1774013400,24965,Turquoise,Bottom,Support/bounce:
1774013400,24800,Dark Red,Bottom,Bearish Breakout:
The indicator automatically formats the price with a thousands separator and appends it to the label text (e.g., "Resistance: 25,035").
█ SETTINGS
• Level Data — multi-line text area where you paste your level definitions (no header row needed)
• Label Right Offset (Bars) — controls how far to the right of the last bar the labels are positioned (default: 20)
• Label Y-Offset (Points) — fine-tunes the vertical distance between the line and its label text to compensate for built-in label padding (default: 5, set to 0 to disable)
█ COLOR PALETTE
Six colors are supported, matched by keyword (case-insensitive):
• Turquoise — key breakout and bounce levels
• Orange — price targets
• Green — secondary resistance/support zones
• Bright Red — primary resistance
• Dark Red — bearish breakouts and short triggers
• Pink — support levels and short targets
█ USE CASES
• Pre-session preparation: define your levels before the market opens and have them ready across all timeframes
• Multi-instrument workflows: quickly paste different level sets when switching between NQ, ES, DAX, etc.
• Sharing levels with a team: copy-paste the same text block so everyone sees identical levels
• Clean chart management: all levels are controlled from a single input field — no manual drawing required
█ NOTES
• Lines begin at the specified UNIX timestamp and extend infinitely to the right
• Labels automatically reposition to the right edge of the visible chart on every new bar
• The indicator supports up to 50 lines and 50 labels simultaneously
• Works on any instrument and any timeframe — levels are anchored by price, not by bars
• UNIX timestamps must be in seconds (not milliseconds) — the indicator handles the conversion internally Indicateur

Q WaveQ Wave
What is Q Wave?
Q Wave is a pressure-adaptive trend wave designed to reveal the current state of market structure with clarity.
It does not predict.
It does not generate signals.
It shows structure.
Two waves define the model:
Fast Wave — reacts quickly to structural shifts in price
Slow Wave — confirms the broader trend regime only after sustained directional pressure
The zone between them tells the regime state:
Blue zone — confirmed bullish regime
Red zone — confirmed bearish regime
Neutral zone — transition phase, where structure has shifted but regime is not yet confirmed
How it works
At the core of Q Wave is a custom Directional Pressure model: candle body size relative to ATR, scaled by volume activity.
When price expands with strong participation, both waves respond faster.
When activity contracts, the model slows down and becomes more selective.
The slow wave uses intentional Regime Inertia. It does not flip on every structural shift. It requires sustained pressure before confirming or reversing a regime, which helps suppress false transitions during noisy intraday conditions.
Best use cases
Q Wave is designed primarily for futures and other liquid instruments, especially on intraday timeframes such as 15–60 minutes. It can also be used on higher timeframes, including 4H and Daily.
For forex and synthetic instruments, disabling volume weighting may produce cleaner behavior.
Settings
Structure Period — lookback window for dominant structure detection
Fast Wave Sensitivity — reaction speed of the fast wave
Slow Wave Sensitivity — reaction speed of the slow wave
Regime Inertia — persistence required before a regime confirms or reverses
ATR / Volume Length — lookback for volatility and average volume
Use Volume Weighting — optional volume influence for instruments with reliable volume data
No signals. No arrows. Only structure.
Disclaimer
This script is for informational and educational purposes only. It is not financial or investment advice. Always use your own analysis, risk management, and independent judgment.
Trade with clarity — stay for quality.
Indicateur

Quantum Master Control Panel [HUD]Quantum Master Control Panel
Overview:
Professional execution requires two things: perfect multi-timeframe alignment and mathematically flawless risk management. If you are constantly clicking between the 1m, 5m, 15m, and 1h charts to check your momentum, or fumbling with a web calculator to figure out your lot size, you are losing precious seconds and bleeding execution edge.
The Quantum Master Control Panel solves this by fusing a dynamic, volatility-adjusted risk calculator and a Multi-Timeframe (MTF) confluence heatmap into a single, sleek Heads-Up Display (HUD) that pins directly to your main chart.
Core Features:
Dynamic Volatility Risk Calculator: Never use a static stop loss again. The HUD reads the current Average True Range (ATR) to calculate a dynamic stop loss distance. It then takes your exact account balance and risk percentage to output the exact lot size you need to execute.
Built-in MTF RCI Heatmap: The dashboard silently runs the Rank Correlation Index (RCI) across the 1m, 5m, 15m, and 1h timeframes, providing a real-time matrix of institutional momentum.
Macro Trend Alignment: The HUD instantly tells you if the current price is above or below the 200 EMA across all four major timeframes, ensuring you never take a scalp against the macro tide.
How to Trade It:
Wait for a micro-trigger on your execution timeframe (like a volume spike or pressure signal). Before you execute, glance at the MTF Matrix. If the RCI and Macro states are aligned (glowing entirely Cyan for long, or Fuchsia for short), your trade has macro backing. Look at the bottom row of the HUD, punch that exact Lot Size into your broker, and set your Stop Loss to the exact Dynamic SL points provided. Indicateur
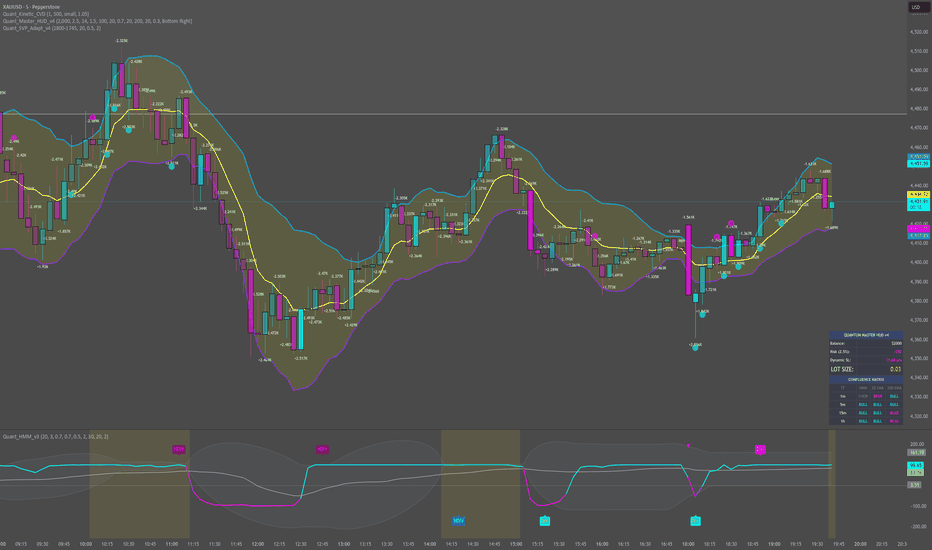
ZigZag Elliott Wave Strategy (Demo)1. Strategy Objective
Objective:
Capture the Wave 1 → Wave 2 correction
Enter Wave 3 (strongest wave) after Wave 2 ends
Take profit at the Wave 3 target
Add more in Wave 4
Manage the position towards Wave 5
2. Visuals on the Chart
Green dots → Wave 1 peak
Red dots → Wave 1 trough
Orange line → Wave 3 target
Blue/purple → Fibonacci levels
Background:
Green → Wave 2 area
Orange → Wave 4 area
3.Strengths and Weaknesses of the Strategy
✅ Strong:
Trend-catching focused
Logical entry with Fibonacci
High potential due to focus on Wave 3
❌ Weak:
May cause zig-zag repainting (late signal)
Elliott waves don't always form clearly
May result in losses on fake retracements
All investments involve risk, and the past performance of a security, industry, sector, market, financial product, trading strategy, backtest, or individual's trading does not guarantee future results or returns. Investors are fully responsible for any investment decisions they make. Such decisions should be based solely on an evaluation of their financial circumstances, investment objectives, risk tolerance.
Stratégie

Quantum RCI [Adaptive + Jurik Signal]Quantum RCI
Overview:
The Rank Correlation Index (RCI) is a phenomenal momentum oscillator, but it suffers from a fatal flaw: lag. Because it measures the correlation between price and time (rather than absolute price changes), applying standard Simple Moving Averages (SMAs) to generate crossover signals results in entering trades long after the institutional move has already started.
The Quantum RCI solves this by fusing the smooth, structural ranking math of the RCI with institutional-grade digital signal processing and dynamic volatility filters.
Core Engine Upgrades:
Zero-Lag Jurik Signal Line: We stripped out the lagging SMA and replaced it with a Jurik Moving Average (JMA). Using spatial phase-shifting, the JMA tracks the RCI with virtually zero lag, providing razor-sharp, exact-moment crossover signals.
Adaptive Bollinger Bands: Instead of static bands, the oscillator is wrapped in Bollinger Bands driven by Kaufman’s Efficiency Ratio (ER). During tight chop, the bands expand to prevent false breakouts. During strong directional trends, the bands tighten to catch the momentum instantly.
Kinetic ADX Gradient: No more staring at a secondary ADX pane. The built-in ADX engine runs silently in the background and dynamically drives the color of the RCI line. Gray indicates weak, choppy chop. Neon Cyan/Magenta visually confirms that institutional momentum has stepped on the gas.
How to Trade It:
Wait for the RCI line to drop outside the Adaptive Bollinger Bands while gray (weak trend). When institutional volume enters, the ADX will trigger the neon gradient, and the RCI will cross the zero-lag Jurik Signal line to snap back inside the bands. That is your macro green light.
⚠️ DISCLAIMER: STRICTLY FOR EDUCATIONAL PURPOSES
The information, scripts, and concepts provided in this publication are for educational and informational purposes only and do not constitute financial, investment, or trading advice. Trading in financial markets (including Forex, Crypto, Stocks, and Commodities) carries a high level of risk and may not be suitable for all investors. You could lose some or all of your initial investment. Past performance is not indicative of future results. Always conduct your own due diligence, backtest any strategy thoroughly, and consult with a certified financial advisor before making any trading decisions. By using this script, you acknowledge that you are solely responsible for your own trading actions and outcomes. Indicateur
Indicateur

Triple CTO Background ZonesTitle: Triple CTO — Background Zones
Triple CTO — Background Zones paints overbought and oversold background zones using three automatically selected timeframes (one step higher, current, one step lower). Overlay only — no lines, labels, or shapes.
Overview
The Triple CTO — Background Zones indicator computes a Composite Trend Oscillator (CTO) score across three timeframes and paints the chart background when a multi-timeframe overbought or oversold condition is confirmed. It uses one step-higher TF as a trend filter, the current TF as the main filter, and one step-lower TF as signal confirmation. Only background color is drawn to minimize chart clutter.
Key features
- Three automatically-selected timeframes: higher (trend), current (filter), lower (signal).
- CTO score built from multiple smoothed layers (configurable number of layers).
- Multiple smoothing/filter options: PhiSmoother, EMA, DEMA, TEMA, WMA, SMA.
- Hysteresis thresholds (separate entry/exit) to prevent flicker near boundaries.
- Confirmation bars — require N consecutive bars on filter TFs before a zone activates.
- Signal TF must agree in direction to validate the zone.
- Background-only visualization with configurable colors and transparency.
- Efficient: single background paint, no labels/lines; max_bars_back note included.
How it works (concise)
1. Timeframe selection: the script maps the chart timeframe to a standard set (1,3,5,15,30,60,240,D) and picks the neighbouring higher and lower TFs automatically.
2. CTO calculation: the CTO compares progressively smoothed versions of price (close) across many layers. For each layer i the algorithm applies a filter with length i * sp (cluster dispersion) and scores +1 if the previous-smoothed value is greater than the current, otherwise −1. The normalized score is scaled to −100…+100 and optionally post-smoothed.
3. Zone detection:
- Overbought entry when both higher and current TF scores >= Overbought Entry threshold.
- Overbought exit when either score falls below Overbought Exit threshold.
- Analogous rules for oversold using negative thresholds.
- ConfirmBars requires both filter TFs to meet the raw condition for N consecutive bars before entering the latched zone.
- The lower (signal) TF must have score > 0 for overbought or < 0 for oversold to activate the background.
4. Visualization: when an overbought or oversold zone is active, the indicator paints the entire background with the chosen color and transparency.
Inputs (user-facing)
- Visualization: Enable background zones, overbought color, oversold color, transparency (0–100).
- Zone Logic: Overbought entry/exit thresholds, Oversold entry/exit thresholds, Confirm bars (1–10).
- CTO Parameters: Filter type (PhiSmoother, EMA, DEMA, TEMA, WMA, SMA), PhiSmoother phase (ph), Cluster dispersion (sp), Post-smooth length (ps), Number of layers (5–50).
- Note: max_bars_back must be large enough (default 5000) to avoid "not enough bars" errors for large layer/timeframe settings.
Recommended usage
- Use as a clean multi-timeframe background filter to highlight when momentum structure shows extreme consensus across TFs.
- Combine with your own price or indicator entries — the script only signals zone states, not trade entries.
- Increase lenLayers and sp for smoother CTO but expect higher CPU and larger max_bars_back.
- Tweak confirmBars and hysteresis thresholds to reduce noise on shorter timeframes.
Permissions & performance
- Overlay-only indicator; no drawing objects besides background paints.
- Heavy smoothing (many layers, high sp, large ps) increases calculation work and may require raising max_bars_back. Indicateur

Performance Comparison (Zeiierman)█ Overview
Performance Comparison (Zeiierman) is a period-mapping comparison engine that shows how the current month, quarter, or year is evolving relative to its historical structure.
It takes completed historical periods, compresses each into a normalized timeline, and overlays them on the active period so you can compare paths, pace, expansion, and finish. Instead of only asking where the price is now, the script asks how this period is behaving relative to past periods at the same stage of development.
The indicator displays all curves in Percentage Accumulated terms, meaning each period starts at the same zero point and then tracks total return from that period start. This makes it easier to compare period structure on an equal footing, regardless of the asset’s raw price level.
█ How It Works
⚪ 1) Period Segmentation
The script groups price into repeating time buckets based on the selected Period:
Monthly
Quarterly
Yearly
Each new month, quarter, or year starts a fresh period, while completed periods are stored for later comparison.
⚪ 2) Timeline Normalization
Because historical periods do not all contain the same number of bars, each is remapped to a shared normalized progress scale from start to end.
This allows the script to compare:
the beginning of one period to the beginning of another
the midpoint of one period to the midpoint of another
the final stage of one period to the final stage of another
So even if one quarter had more bars than another, both can still be compared on the same visual path.
⚪ 3) Value Mapping
The script uses Percentage Accumulated only.
Each period begins at 0% and then tracks cumulative return from that period’s starting price:
Percentage Accumulated = current price/period starting price − 1
This means all periods are anchored to the same starting point, making relative path comparison much cleaner than raw price comparison.
⚪ 4) Historical Curve Engine
Completed periods are collected into comparison buckets across the normalized timeline. From these buckets, the script can draw:
Historical paths
Median path
Average path
This creates a period-based structure model rather than a simple price overlay.
⚪ 5) Current Period Tracking
The active period is plotted on top of the historical framework, so you can see:
whether the current action is stronger or weaker than normal
whether it is tracking near the median path
whether it is diverging from the average or historical range
where the current period sits in time through the timeline bar
⚪ 6) Similarity Table
The table compares the current period against past visible periods using four path metrics:
MAE: Average distance from the current path. Lower is better.
Max Dev: Largest divergence at any point. Lower is better.
Dir Match %: How often did both paths move in the same direction? Higher is better.
End Diff: Difference at the latest comparable point. Closer to zero is better.
This helps identify which historical period most closely resembles the current one.
█ Why It Is Useful
⚪ Structural Context
The script does not just show whether the price is up or down. It shows whether the current period is unfolding in a way that is typical, weak, extended, delayed, or abnormal relative to history.
⚪ Period-Based Comparison
It is especially useful for traders and analysts who think in recurring cycles, such as:
monthly structure
quarterly seasonality
yearly progression
█ How to Use
⚪ Historical Comparison
Use the historical paths to see how prior periods behaved across the full normalized timeline.
⚪ Median Path
Use the median as the most typical historical path. This is often the cleanest benchmark for “normal” behavior.
⚪ Average Path
Use the average to measure the broad mean tendency of past periods.
⚪ Current Period
Use the current path to judge whether the live period is:
leading
lagging
tracking normally
diverging sharply from history
⚪ Similarity Table
Use the table to find the closest historical analog to the current period.
Low MAE and Max Dev suggest close path similarity.
High Dir Match % suggests similar movement behavior.
End Diff near zero suggests similar positioning at the current stage.
█ Settings
Period — groups data into Monthly, Quarterly, or Yearly periods.
Completed Periods to Compare — number of finished historical periods used in the comparison engine.
Chart Resolution — number of normalized steps used to draw each path.
-----------------
Disclaimer
The content provided in my scripts, indicators, ideas, algorithms, and systems is for educational and informational purposes only. It does not constitute financial advice, investment recommendations, or a solicitation to buy or sell any financial instruments. I will not accept liability for any loss or damage, including without limitation any loss of profit, which may arise directly or indirectly from the use of or reliance on such information.
All investments involve risk, and the past performance of a security, industry, sector, market, financial product, trading strategy, backtest, or individual's trading does not guarantee future results or returns. Investors are fully responsible for any investment decisions they make. Such decisions should be based solely on an evaluation of their financial circumstances, investment objectives, risk tolerance, and liquidity needs.
Indicateur

Indicateur

Momentum Pressure Gauge [JOAT] Momentum Pressure Gauge
Introduction
The Momentum Pressure Gauge is an advanced institutional-grade analysis tool designed to measure the underlying buying and selling pressure that drives market movements. This indicator goes beyond simple momentum oscillators by quantifying the actual pressure differential between buyers and sellers, incorporating volume analysis, detecting divergences, and identifying when momentum is reaching extreme levels. Understanding pressure and momentum is crucial because price often follows pressure - by measuring the force behind price movements, traders can anticipate future direction with greater confidence.
This tool is built for traders who understand that markets are driven by the constant battle between buyers and sellers, and that the outcome of this battle is reflected in pressure and momentum patterns. Whether you're a day trader timing entries with precision, a swing trader identifying trend strength, or a position trader spotting major reversals, this gauge provides the sophisticated pressure analysis needed to trade with the dominant force rather than against it.
Why This Indicator Exists
Most traders use basic momentum indicators without understanding the underlying pressure dynamics or volume participation. This indicator addresses that limitation by:
Pressure Analysis: Measures actual buying/selling pressure in each bar
Volume Weighting: Incorporates volume to confirm pressure significance
Momentum Scoring: Provides composite momentum scores with multiple factors
Divergence Detection: Identifies price/momentum divergences for early reversal signals
Extreme Zone Identification: Flags overbought/oversold conditions with pressure context
Energy Wave Analysis: Combines pressure with volume and price energy
The gauge transforms abstract momentum concepts into concrete pressure measurements that reveal the true force behind market movements.
Core Components Explained
1. Raw Pressure Calculation
The indicator measures buying and selling pressure in each bar:
// Raw buying/selling pressure
f_pressure_raw() =>
float range_val = high - low
float buy_pressure = range_val > 0 ? (close - low) / range_val : 0.5
float sell_pressure = range_val > 0 ? (high - close) / range_val : 0.5
// Apply smoothing
float pressure_ratio = ta.ema(raw_buy, i_pressure_len)
float pressure_smooth = ta.ema(pressure_ratio, i_smooth_len)
Pressure components:
Buy Pressure: Where price closed within the bar's range (0-1)
Sell Pressure: Complementary sell pressure (0-1)
Pressure Ratio: Buy pressure as a ratio
Smoothing: EMA smoothing for cleaner signals
Range Normalization: Pressure relative to bar's range
Pressure above 0.5 indicates buying dominance, below 0.5 indicates selling dominance.
2. Volume-Weighted Pressure
Volume analysis confirms the significance of pressure:
// Volume relative strength
float vol_sma = ta.sma(volume, i_pressure_len)
float vol_ratio = vol_sma > 0 ? volume / vol_sma : 1.0
float vol_weight = math.min(vol_ratio, 3.0) / 3.0 // Cap at 3x average
// Volume-weighted pressure
float vw_pressure = pressure_smooth * (0.7 + vol_weight * 0.3)
// Cumulative pressure
float cum_pressure = ta.sma(raw_buy, i_pressure_len) - 0.5 // Centered at 0
Volume features:
Volume Ratio: Current volume relative to average
Volume Weight: Normalized volume influence (0-1)
VW Pressure: Pressure adjusted for volume participation
Cumulative Pressure: Running pressure average
Volume Cap: Prevents extreme volume from distorting signals
High volume confirms pressure significance, while low volume questions its reliability.
3. Momentum Analysis
Multiple momentum factors are combined for comprehensive analysis:
// Pressure momentum (rate of change)
float pressure_momentum = pressure_smooth - pressure_smooth
// Pressure acceleration
float pressure_accel = pressure_momentum - pressure_momentum
// Composite pressure score (-100 to +100)
float composite_score = (pressure_smooth - 0.5) * 200
// Momentum-adjusted score
float momentum_adjustment = pressure_momentum * 100
float adjusted_score = composite_score + momentum_adjustment * 0.3
Momentum components:
Pressure Momentum: Rate of change in pressure
Pressure Acceleration: Change in momentum (second derivative)
Composite Score: Normalized pressure score (-100 to +100)
Momentum Adjustment: Score adjusted for momentum
Acceleration Detection: Identifies momentum shifts
Momentum analysis reveals not just current pressure but its direction and acceleration.
4. WaveTrend Integration
The WaveTrend oscillator adds an additional momentum layer:
f_wavetrend(int channel_len, int avg_len) =>
float ap = hlc3
float esa = ta.ema(ap, channel_len)
float d = ta.ema(math.abs(ap - esa), channel_len)
float ci = d > 0 ? (ap - esa) / (0.015 * d) : 0.0
float wt1_local = ta.ema(ci, avg_len)
float wt2_local = ta.sma(wt1_local, 4)
// WaveTrend signals
bool wt_bullish = wt1 > wt2 and wt1 > wt1
bool wt_bearish = wt1 < wt2 and wt1 < wt1
bool wt_oversold = wt1 < -60
bool wt_overbought = wt1 > 60
WaveTrend features:
WT1/WT2 Lines: Fast and slow WaveTrend lines
Cross Signals: Line crossovers for momentum changes
Extreme Levels: Overbought (>60) and oversold (<-60)
Trend Confirmation: Line slope for additional confirmation
Integration: Combined with pressure for confluence
WaveTrend provides an independent momentum confirmation.
5. Energy Wave Calculation
The indicator combines multiple energy sources:
// Energy combines pressure momentum with volume energy
float vol_energy = vol_sma > 0 ? (volume - vol_sma) / vol_sma * 100 : 0
float atr_14 = ta.atr(14)
float price_energy = atr_14 > 0 ? (close - open) / atr_14 * 100 : 0
float combined_energy = (pressure_momentum * 100 + vol_energy * 0.3 +
price_energy * 0.2) / 1.5
float energy_smooth = ta.ema(combined_energy, 5)
Energy components:
Volume Energy: Volume deviation from average
Price Energy: Price movement relative to ATR
Pressure Energy: Momentum contribution
Combined Energy: Weighted average of all energies
Energy Smoothing: EMA for cleaner energy signals
Energy waves show the underlying power driving market movements.
6. Divergence Detection
The indicator identifies price/momentum divergences:
// Price direction
float price_change = close - close
int price_dir = price_change > 0 ? 1 : price_change < 0 ? -1 : 0
// Pressure direction
int pressure_dir = pressure_momentum > i_momentum_thresh ? 1 :
pressure_momentum < -i_momentum_thresh ? -1 : 0
// Divergence detection
bool bullish_divergence = price_dir == -1 and pressure_dir == 1
bool bearish_divergence = price_dir == 1 and pressure_dir == -1
Divergence types:
Bullish Divergence: Price falling but pressure rising
Bearish Divergence: Price rising but pressure falling
Hidden Divergence: Continuation patterns
Regular Divergence: Reversal patterns
Threshold Filter: Minimum momentum for valid divergence
Divergences often precede significant price reversals.
7. State Classification System
The indicator classifies market states based on pressure:
// Pressure state
// 2 = extreme buying, 1 = buying, 0 = neutral, -1 = selling, -2 = extreme selling
var int pressure_state = 0
if pressure_smooth >= i_extreme_high
pressure_state := 2
else if pressure_smooth > 0.5 + i_momentum_thresh
pressure_state := 1
else if pressure_smooth <= i_extreme_low
pressure_state := -2
else if pressure_smooth < 0.5 - i_momentum_thresh
pressure_state := -1
// Momentum state
// 1 = accelerating, 0 = steady, -1 = decelerating
var int momentum_state = 0
if pressure_accel > i_momentum_thresh / 2
momentum_state := 1
else if pressure_accel < -i_momentum_thresh / 2
momentum_state := -1
State meanings:
Extreme Buying: Maximum buying pressure (>70%)
Buying: Moderate buying pressure (50-70%)
Neutral: Balanced pressure (40-60%)
Selling: Moderate selling pressure (30-50%)
Extreme Selling: Maximum selling pressure (<30%)
Accelerating: Momentum increasing
Decelerating: Momentum decreasing
State classification provides clear, actionable market conditions.
Visual Elements
Pressure Histogram: Main pressure display with gradient coloring
Multi-Layer Glow: Intensity-based glow effects
Energy Wave: Separate energy visualization
Momentum Line: Momentum rate of change
WaveTrend Lines: Additional momentum confirmation
Divergence Markers: Visual divergence signals
Extreme Zones: Highlighted overbought/oversold areas
Dashboard: Comprehensive metrics panel
Signal Labels: Key event labels with spacing
The dashboard displays:
1. Current pressure state and intensity
2. Momentum state and acceleration
3. Composite score and direction
4. Volume weight and analysis
5. Divergence status and alerts
6. Energy wave readings
7. Confluence quality score
8. WaveTrend status and signals
9. Overall signal strength
Input Parameters
Pressure Settings:
Pressure Period: Pressure calculation period (default: 14)
Smoothing Period: EMA smoothing (default: 5)
Momentum Lookback: Momentum calculation (default: 10)
Thresholds:
Extreme Buying: Maximum buying level (default: 0.7)
Extreme Selling: Maximum selling level (default: 0.3)
Momentum Threshold: Minimum momentum (default: 0.05)
WaveTrend Settings:
Channel Length: WT calculation period (default: 9)
Average Length: WT smoothing period (default: 12)
Enable WT: Toggle WaveTrend on/off
Visual Settings:
Color Scheme: Customizable pressure colors
Glow Effects: Enable visual enhancements
Show Zones: Display extreme zones
Show Labels: Control signal label frequency
How to Use This Indicator
Step 1: Assess Pressure State
Check the dashboard for current pressure state. Extreme states (>70% or <30%) often precede reversals, while moderate states suggest continuation.
Step 2: Analyze Momentum
Look at momentum direction and acceleration. Accelerating momentum in the pressure direction confirms strength, while deceleration warns of potential reversals.
Step 3: Check Volume Confirmation
Ensure pressure is supported by volume. High volume pressure is more reliable than low volume pressure.
Step 4: Watch for Divergences
Divergences are powerful reversal signals. A bullish divergence (price down, pressure up) suggests buying opportunity, while bearish divergence suggests selling.
Step 5: Monitor Energy Waves
Energy waves show the underlying power. Rising energy confirms current pressure, while falling energy suggests weakening.
Step 6: Use Extreme Zones
Extreme buying (>70%) often marks tops, while extreme selling (<30%) often marks bottoms. These are contrarian signals.
Best Practices
Extreme pressure states (>70% or <30%) often precede reversals
Divergences are most reliable at extreme levels
Volume confirmation is essential - pressure without volume is suspect
Momentum acceleration confirms pressure strength
Energy waves provide early warning of momentum shifts
Multiple timeframe analysis improves signal reliability
Combine with trend analysis for optimal results
Use WaveTrend crossovers for additional confirmation
Keep a pressure journal to track patterns
Be patient for the highest quality setups
Trading Applications
Momentum Trading:
Enter when pressure > 60% and accelerating
Add to positions as momentum increases
Exit when pressure decelerates or reverses
Use volume to confirm signal strength
Reversal Trading:
Look for extreme pressure (>70% or <30%)
Wait for divergence confirmation
Enter on first sign of pressure reversal
Target mean reversion to 50% level
Divergence Trading:
Identify clear price/pressure divergences
Confirm with volume and energy analysis
Enter on momentum shift confirmation
Use tight stops due to reversal nature
Strategy Integration
This indicator enhances any trading system:
Use pressure as a trend confirmation filter
Import momentum scores for signal weighting
Apply divergence detection for early warnings
Use extreme zones for contrarian signals
Integrate volume-weighted pressure for confirmation
Export pressure states for custom logic
Technical Implementation
Built with Pine Script v6 featuring:
Advanced pressure calculation with range normalization
Volume-weighted analysis with capping
Multi-factor momentum scoring system
WaveTrend oscillator integration
Energy wave calculation combining multiple sources
Sophisticated divergence detection with thresholds
State classification with multiple dimensions
Multi-layer visualization with glow effects
Real-time dashboard with 10 key metrics
Alert conditions for all major pressure events
The code uses confirmed bars for all calculations to prevent repainting.
Originality Statement
This indicator is original in its comprehensive approach to pressure and momentum analysis. While individual components (RSI, MACD, WaveTrend) are established tools, this indicator is justified because:
It synthesizes pressure analysis with volume weighting for more accurate signals
The energy wave concept combines multiple momentum sources into unified analysis
State classification provides clear, actionable market conditions
Divergence detection includes threshold filtering for higher quality signals
Multi-layer visualization with glow effects enhances readability
The dashboard presents complex pressure dynamics in an accessible format
Volume-weighted pressure adds confirmation often missing from momentum indicators
Acceleration analysis provides early warning of momentum shifts
Export functions enable integration with any trading system
Each component provides unique insights: pressure shows force, volume shows participation, momentum shows direction, energy shows power, and divergence shows potential reversals
The indicator's value lies in measuring the underlying forces that drive price movements rather than just tracking price itself, providing traders with deeper insight into market dynamics and potential future direction.
Disclaimer
This indicator is provided for educational and informational purposes only. It is not financial advice or a recommendation to buy or sell any financial instrument. Pressure and momentum analysis is a tool for understanding market forces, not a prediction system.
Pressure and momentum can change suddenly due to news events, economic data, or changes in market sentiment. Extreme pressure states can persist longer than expected, and divergences can fail without warning. The indicator's signals are mathematical calculations based on historical patterns and should be used in conjunction with other forms of analysis.
Always use proper risk management, including stop losses and position sizing appropriate for your account and risk tolerance. Never trade against strong pressure without confirmation - the trend can remain in force longer than your account can survive.
The author is not responsible for any losses incurred from using this indicator. Users assume full responsibility for all trading decisions made using this system.
-Made with passion by officialjackofalltrades
Indicateur

Indicateur

Indicateur

Zigzag Sequence DetectorOVERVIEW
This indicator is a dynamic pattern recognition tool built strictly on market structure mechanics. It detects custom sequences of Zigzag-based pivot points in real-time. It was developed to automate the tedious process of visually tracking structural shifts and to provide a programmatic foundation for sequence-based trading. It falls into the category of Price Action and Market Structure analysis.
MAIN CONCEPT
If we consider the market as a massive text, this script can be seen as a 'scanning tool' that finds the exact sentence we are looking for it. You write a sentence consisting of the words 'HH, HL, LL, and LH', and this indicator highlights exactly where that sequence occurs in the text.
ZIGZAG & PIVOTS
The core of this tool relies on the ZigZag algorithm, which filters out market noise by only drawing lines when the price reverses by a defined threshold. It reveals the skeletal framework of price action. At the peaks and troughs of these lines lie the pivot points: Higher High (HH), Lower Low (LL), Higher Low (HL), and Lower High (LH). In trading literature, these pivots are the fundamental building blocks of Dow Theory. Tracking these points provides a raw, unfiltered narrative of whether buyers or sellers are in control.
There are many ZigZag alternatives on TradingView that can produce effective results. However, the open-source model developed by @DevLucem provides, in my opinion, the most suitable structure to work on. The original version was based on percentage deviation; I made a minor addition for Mintick-based calculation and update it to version 6 of Pine Script. Special thanks to for his inspiring work.
MECHANICS
• The internal logic uses `chart.point` objects to cleanly track price and time coordinates. As the direction shifts, these objects are copied to maintain independent references.
• `f_calc_dev()`: Dynamically calculates the deviation threshold based on the user's selection (Mintick or Percent).
• `f_parse_sequence()`: Takes the raw string input, strips whitespaces, and splits it into a clean array for processing.
• `f_check_sequence()`: Isolates the most recent elements of the historical pivot array and evaluates them against the user's target sequence array element by element.
• The `trade_direction` state machine uses a unique integer-based accumulation system rather than a simple binary (1 or -1) toggle. It increments (+1, +2) for consecutive Long signals and decrements (-1, -2) for consecutive Shorts. This makes the script highly adaptable for developers building pyramiding strategies or dynamic position sizing models.
HOW TO USE
• Load the indicator on your chart and set your noise-filtering parameters via `Depth`, `Deviation Mode`, `Deviation Value`, and `Backstep`.
• In the settings, input your desired market structures for Entries and Exits using comma-separated values (e.g., "HH,HL,LH").
• You can define Long Entry, Long Exit, Short Entry and Short Exit conditions independently.
• You can also toggle the visual outputs on or off and set the colors in the indicator settings.
THE ALTERNATING PIVOT RULE (Important Note on Sequence Building)
• By the inherent geometric laws of the ZigZag algorithm, market structure must strictly alternate between a peak (High) and a trough (Low). It is structurally impossible for two consecutive peaks or two consecutive troughs to form. Therefore, when building your custom patterns, a High-type pivot must always be followed by a Low-type pivot, and vice versa.
• Invalid Sequences: "HH, HH", "HH, LH", "LH, HH", "LH, LH", "LL, LL", "LL, HL", "HL, LL", "HL, HL". (The engine will accept these inputs, but the condition will never occur on the chart, meaning no signals will ever trigger.)
• Always ensure your custom text sequences obey this strict alternating logic before expecting valid signals.
OUTPUTS
• The script plots ZigZag lines and annotates each confirmed pivot directly on the chart.
• Upon detecting a target sequence, it displays Entry or Exit signals on the triggering bar.
• It continuously feeds raw data (such as the exact `trade_direction` integer and active signal states) into the Data Window for quantitative tracking.
• It allows for setting automated Tradingview alerts based entry and exit signals.
DISCLAIMER
• The default signal sequences are provided for demonstration purposes only; it is the user's responsibility to define meaningful patterns.
• This indicator is not a standalone trading strategy or a predictive tool.
• It mathematically identifies what has already happened based on rigid pivot definitions.
• If the `Last Leg (Repaint)` option is enabled, it evaluates the developing market structure in real-time. This means signals on the current bar can appear and vanish if the price reverses before the pivot is locked in. Indicateur

RSI DivergenceReal-Time ZigZag Divergence Engine
A dynamic market structure analyzer combining adaptive ZigZag pivot detection with multi-oscillator divergence identification, featuring real-time forming-signal alerts and advanced exhaustion filtering for high-probability reversal trading.
Overview
The Real-Time ZigZag Divergence Engine revolutionizes classical divergence analysis by calculating signals in real-time as price legs develop, rather than waiting for bar close confirmations. Using an adaptive ZigZag algorithm that responds to either percentage-based or volatility-adjusted (ATR) deviation thresholds, the system continuously tracks swing highs and lows while monitoring your choice of 7 major oscillators for momentum divergences. Advanced filtering mechanisms—including leg exhaustion ratios, minimum oscillation thresholds, and dynamic overbought/oversold zone requirements—ensure only structurally sound divergences trigger alerts, eliminating the noise common in standard divergence indicators.
User Guide: Input Parameters & Their Impact
ZigZag Configuration
These parameters control how the engine identifies swing highs and lows—the structural backbone of all divergence detection.
Deviation Mode (Percentage): Selects the methodology for determining when a swing leg is significant enough to register as a pivot. "Percentage" uses fixed percentage moves from highs/lows (traditional); "ATR" uses Average True Range multiples for volatility-adaptive pivot detection that automatically adjusts to quiet vs. volatile market conditions. Use ATR for forex/crypto where volatility regimes shift; use Percentage for equities with consistent tick sizes.
Deviation % (0.5): The minimum price movement required to confirm a pivot reversal (in percentage terms). Lower values (0.2-0.3) create more sensitive zigzags that catch minor swings and micro-divergences—ideal for scalping on lower timeframes. Higher values (1.0-2.0) filter for major structural swings only, showing only significant divergences suitable for swing trading. Increasing this reduces signal frequency but increases structural importance.
ATR Length (14): The lookback period for volatility calculation when in ATR mode. Standard 14-bar setting measures medium-term volatility; decrease (7-10) for short-term volatility responsiveness (catches quick regime changes); increase (20-30) for smoother volatility baselines that ignore short-term spikes.
ATR Multiplier (1.5): The deviation threshold expressed as a multiple of ATR when in ATR mode. Lower multipliers (0.8-1.0) create tight zigzags responsive to small volatility-adjusted moves; higher multipliers (2.0-3.0) require significant volatility-confirmed moves to register pivots. This directly scales with market noise—increase when experiencing whipsaws, decrease when volatility compresses.
Oscillator Settings
Controls the momentum indicator used for divergence comparison against price structure.
Type (RSI): The mathematical engine generating momentum readings. RSI measures
speed/magnitude of moves (standard); MFI adds volume weighting (better for spotting accumulation/distribution divergences); CCI measures deviation from statistical mean (effective for trend strength); Stochastics tracks position within recent range (optimal for range-bound markets); Williams %R is inverse stochastic (sensitive to overbought/oversold); ROC measures pure percentage change (momentum slope); CMO measures summed changes (smoother momentum). Select based on your market type—RSI for general use, MFI for volume analysis, Stochastics for ranges.
Length (14): The calculation period for the selected oscillator. Shorter lengths (7-9) create responsive, noisy oscillators that catch divergences quickly but generate more false signals. Longer lengths (21-30) smooth the oscillator, showing only significant momentum divergences that persist over time. This should align with your trading horizon—match to your typical holding period.
Smoothing EMA (1): Post-calculation exponential moving average applied to the oscillator output. Values above 1 (3-5) reduce oscillator noise, making divergence lines cleaner but potentially lagging; 1 means raw oscillator output for maximum responsiveness. Increase if experiencing oscillator whipsaws near pivot points.
Detection Settings
Controls which types of divergences are calculated and when signals appear.
Regular Divergences (true): Enables detection of classic reversal divergences where price makes higher highs while oscillator makes lower highs (bearish), or price makes lower lows while oscillator makes higher lows (bullish). These indicate momentum exhaustion and potential trend reversals. Disable if you only trade trend continuation.
Hidden Divergences (false): Enables detection of trend-continuation divergences where price makes higher lows while oscillator makes lower lows (bullish continuation in uptrend), or price makes lower highs while oscillator makes higher highs (bearish continuation in downtrend). These indicate momentum consolidation within trend direction. Enable for trend-following strategies, disable for pure mean-reversion.
Live (Forming) Signals (true): When enabled, displays potential divergences on the currently developing (unconfirmed) ZigZag leg. This gives early warning before pivot confirmation but carries risk of the leg extending and invalidating the signal. Disable for conservative trading requiring fully confirmed structure; enable for aggressive early entry with confirmation on next pivot.
Confirmed Signals (true): Displays divergences only after ZigZag pivots are fully confirmed (leg complete). These are historically validated structural points with defined risk levels. Keep enabled for standard trading; disable only if you want to see only live forming setups.
Filters
Advanced quality control mechanisms to eliminate weak or structurally unsound divergences.
Min Bars Between Pivots (3): The minimum number of bars required between two pivot points to validate a divergence. Prevents "clustered" signals in choppy, sideways markets where pivots form too close together. Increase (5-8) to ensure divergences develop over meaningful time periods; decrease (1-2) for faster-paced markets where quick reversals are valid.
Min Leg Size % (0.0): The minimum percentage movement required for a ZigZag leg to qualify for divergence checking. Filters out tiny, insignificant swings that lack structural importance. Set to 1.0-2.0 to require meaningful price moves before divergence analysis; keep at 0.0 to analyze all swings regardless of size.
Max Leg Ratio (0.0): An exhaustion filter comparing current leg size to previous same-direction leg size. When enabled (values like 1.5-2.0), it prevents signals where the current leg is excessively large compared to the previous leg, indicating potential blow-off exhaustion rather than sustainable divergence. Values above 1.0 mean current leg can be X times larger than previous; 0.0 disables. Use 1.2-1.5 to avoid entering extended trends near exhaustion points.
Min Osc Divergence (0.0): The minimum absolute difference in oscillator values required between two pivots to constitute a valid divergence. Filters weak "barely there" divergences. Set to 5.0-10.0 to require meaningful oscillator disagreement with price; keep at 0.0 for any directional disagreement to qualify.
Require OB/OS Zone (false): When enabled, divergences only trigger if the second pivot occurs in extreme oscillator territory (overbought for highs, oversold for lows). This ensures divergences occur at statistically extreme levels rather than mid-range noise. Enable for high-probability mean-reversion setups; disable to catch mid-trend divergences.
Overbought (70.0) / Oversold (30.0): The threshold levels defining extreme zones when "Require OB/OS Zone" is enabled. Adjust based on your oscillator type—standard for RSI (70/30), but for CCI use (+100/-100), for Stochastics (80/20).
Visual Settings
Controls display aesthetics and performance management.
ZigZag Lines (true): Toggle display of confirmed pivot-to-pivot trend lines. These show the structural path of price and help visualize trend progression. Disable to reduce chart clutter if focusing only on divergence signals.
Leg Measurements (false): Displays percentage move and bar count labels on each completed ZigZag leg. Useful for analyzing swing magnitude and duration; enable for structural analysis, disable for cleaner charts.
Divergence Lines on Price (true): Draws connecting lines between the two price pivot points forming a divergence. Provides visual confirmation of the structural relationship being analyzed.
Bullish/Bearish Colors: Standard and hidden divergence label colors. Green/Teal for bullish signals (regular/hidden); Red/Pink for bearish. Adjust for colorblind accessibility or personal preference.
Max Stored Objects (50): Memory management limit for lines and labels. Prevents performance degradation on charts with extensive history. Increase (100-200) for long-term analysis on high-timeframe charts; decrease (20-30) for intraday scalping where only recent signals matter.
How It Works
Adaptive Pivot Detection
The engine continuously tracks price extremes, updating the "live" pivot candidate as new highs or lows develop within the current leg. When price reverses by the deviation threshold (percentage or ATR-based), the live pivot becomes confirmed and stored in history, while a new opposite-direction tracking begins.
Oscillator Synchronization
At every confirmed pivot and every bar of the live forming leg, the selected oscillator value is captured. This creates a parallel track of momentum highs/lows corresponding to price structure.
Divergence Classification
The system compares current price and oscillator values against previous same-type pivots (high-to-high, low-to-low). When price makes a higher high but the oscillator makes a lower high (and filters pass), a regular bearish divergence registers. The classification engine distinguishes between reversal divergences (regular) and continuation divergences (hidden) based on relative positioning.
Real-Time vs. Confirmed Logic
Live signals calculate on the developing leg, allowing traders to anticipate potential setups before structural completion—marked with a "⚡" symbol. Confirmed signals validate only after the ZigZag algorithm confirms the pivot, ensuring the divergence exists on completed structure.
Use this tool to identify momentum exhaustion points where price structure and oscillator momentum disagree. For conservative trading, require OB/OS zone validation and set Min Leg Size to 1.0% to avoid noise; for aggressive scalping, enable live signals with Stochastics on 5-minute charts with tight filters. Watch for confluence where regular divergences appear near major ZigZag structural levels—this combination of momentum divergence and structural completion provides the highest probability reversal setups. Indicateur
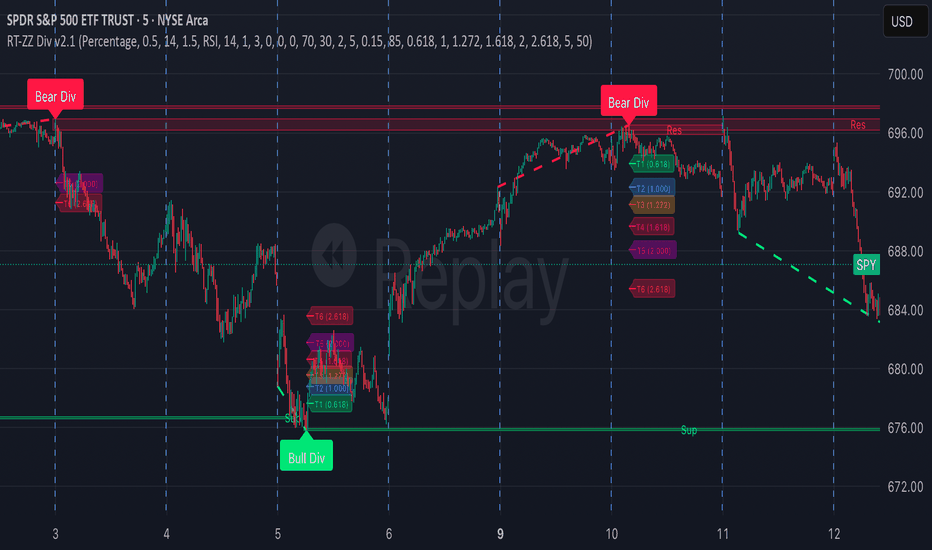
APEX V2 [JOAT]APEX V2
Introduction
APEX V2 Enhanced is an advanced open-source algorithmic trading strategy that synthesizes 9 proprietary analytical concepts through a sophisticated confluence system to generate high-probability trade signals. This strategy integrates Flow Absorption Module (FAM), Directional Bias Engine (DBE), Structure Mapping System (SMS), Volatility Classification (VCL), Momentum Divergence Module (MDM), Statistical Reversion Zones (SRZ), Order Flow Analysis (OFA), Anchor Deviation Bands, and Trend Momentum Signals into a unified trading framework with comprehensive risk management.
Unlike single-indicator strategies that produce frequent false signals, APEX V2 requires multi-dimensional confluence before executing trades. This confluence-based approach dramatically reduces false positives while capturing high-conviction institutional moves. The strategy includes adaptive position sizing based on risk percentage, dynamic stop loss and take profit levels, trailing stops, and real-time performance tracking through a comprehensive dashboard.
Why This Strategy Exists
This strategy addresses the fundamental challenge of trading: distinguishing high-probability setups from market noise. Individual analytical methods often produce conflicting signals, leading to whipsaws and losses. APEX V2 solves this by requiring multiple independent confirmation signals before entering trades, ensuring that:
Institutional Activity is Confirmed: FAM and OFA detect when large players are positioning
Directional Bias is Established: DBE quantifies market sentiment through probabilistic analysis
Structural Context is Validated: SMS identifies key support/resistance levels
Volatility Regime is Appropriate: VCL ensures trades occur in favorable volatility conditions
Momentum Divergence is Present: MDM confirms smart money positioning through multi-oscillator divergence
Mean Reversion Opportunity Exists: SRZ identifies statistical extremes for reversal trades
Order Flow is Toxic: OFA detects aggressive institutional buying/selling
Anchor Deviation is Extreme: Multi-timeframe VWAP deviation signals absorption zones
Trend Momentum Confirmation: Trend-following signals with minimal lag
Each analytical module provides a unique perspective on market structure. By requiring confluence across multiple dimensions, APEX V2 captures only the highest-quality setups where institutional activity, technical structure, momentum, volatility, and order flow all align.
Strategy Components Explained
1. Flow Absorption Module (FAM)
FAM analyzes VWAP deviation across 2-minute, 5-minute, and 15-minute timeframes to identify institutional liquidity absorption zones. When price deviates significantly from VWAP (default: 8.0 sigma on 2m/5m, 4.0 sigma on 15m) combined with volume surges (2.25x average) and sufficient relative volume (0.6+), FAM signals institutional absorption.
The strategy requires 2+ timeframe confirmation for FAM signals. Buy signals occur when price is below VWAP with volume surge across multiple timeframes (institutions absorbing at lows). Sell signals occur when price is above VWAP with volume surge (institutions distributing at highs).
FAM contributes 1 point to the confluence score when absorption is detected, indicating institutional players are actively positioning at price extremes.
2. Directional Bias Engine (DBE)
DBE calculates directional bias by analyzing the ratio of bullish vs bearish bars over a lookback period (default: 100 bars) combined with momentum analysis. The engine weights directional bias (60%) and momentum bias (40%) to produce a combined bias score ranging from -1.0 (extreme bearish) to +1.0 (extreme bullish).
When combined bias exceeds the threshold (default: 0.65), DBE signals bullish bias. When below -0.65, it signals bearish bias. This probabilistic approach quantifies market sentiment and filters trades against the prevailing bias.
DBE contributes 1 point to confluence when bias aligns with trade direction, ensuring trades flow with statistical probability rather than against it.
3. Structure Mapping System (SMS)
SMS detects structural pivot highs and pivot lows using configurable left/right bar parameters (default: 10 bars each). The system maintains arrays of the 10 most recent resistance and support levels, then checks if current price is within 1% of any tracked level.
When price approaches support (within 1% of recent pivot lows), SMS signals potential bounce. When price approaches resistance (within 1% of recent pivot highs), SMS signals potential rejection. These structural levels represent areas where price previously reversed, making them high-probability zones for future reversals.
SMS contributes 1 point to confluence when price is near support (for longs) or resistance (for shorts), providing structural context for entries.
4. Volatility Classification (VCL)
VCL classifies current volatility regime using ATR percentile ranking over a lookback period (default: 100 bars). The system calculates normalized ATR (ATR / price * 100) and determines its percentile rank. High volatility is defined as 70th percentile or above, low volatility as 30th percentile or below.
While VCL doesn't directly contribute to confluence scoring, it provides critical context displayed in the dashboard. High volatility regimes may require wider stops, while low volatility regimes may produce more reliable mean reversion signals.
The strategy adapts to volatility by using ATR-based position sizing and stop loss placement, ensuring risk management scales with market conditions.
5. Momentum Divergence Module (MDM)
MDM detects multi-oscillator divergences by comparing price pivots with RSI pivots. Bullish divergence occurs when price makes lower lows but RSI makes higher lows (indicating weakening selling pressure). Bearish divergence occurs when price makes higher highs but RSI makes lower highs (indicating weakening buying pressure).
The system tracks divergence counts and requires a minimum number of divergences (default: 2) before signaling. This prevents single-divergence false signals and ensures sustained divergence patterns.
MDM contributes 1 point to confluence when divergence aligns with trade direction, confirming that smart money is positioning against the prevailing price trend.
6. Statistical Reversion Zones (SRZ)
SRZ combines Bollinger Bands with RSI to identify statistical extremes for mean reversion trades. The system calculates Bollinger Bands (default: 20-period, 2.0 standard deviations) and RSI (default: 14-period) to detect oversold and overbought conditions.
Oversold signals occur when price is below the lower Bollinger Band AND RSI is below 30. Overbought signals occur when price is above the upper Bollinger Band AND RSI is above 70. These dual conditions ensure both price and momentum are at extremes.
SRZ contributes 1 point to confluence when statistical extremes align with trade direction, identifying high-probability mean reversion opportunities.
7. Order Flow Analysis (OFA)
OFA detects institutional order flow through toxicity analysis and absorption coefficient calculation. The toxicity index measures aggressive vs passive order flow by analyzing candle position and volume. When toxicity exceeds threshold (default: 0.7), it indicates institutions are aggressively taking liquidity.
The absorption coefficient quantifies institutional absorption by measuring volume intensity relative to price movement. High absorption (default: 0.75+) with minimal price movement indicates institutions are positioning without moving price significantly.
OFA calculates a confidence score (0-100%) based on absorption strength and toxicity. When confidence exceeds minimum threshold (default: 75%), OFA signals high-probability institutional activity.
OFA contributes 1 point to confluence when institutional footprints are detected with high confidence, confirming large players are actively positioning.
8. Anchor Deviation Bands
Anchor Deviation analyzes multi-timeframe VWAP deviation (2m, 5m, 15m) combined with oscillator sigma gap confirmation. The system calculates VWAP deviation using configurable methods (Price Volatility, Z-Score, or Spread StDev) and measures the gap between VWAP deviation and oscillator z-scores.
Buy signals occur when 2+ timeframes show negative VWAP deviation (price below VWAP) with 2+ timeframes confirming oscillator gap. Sell signals occur when 2+ timeframes show positive VWAP deviation with gap confirmation.
Anchor Deviation contributes 1 point to confluence when multi-timeframe tension is detected, indicating price is at extreme deviation from institutional reference levels.
9. Trend Momentum Signals
Trend Momentum Signals use a zero-lag EMA combined with volatility bands and trend strength analysis. The system calculates a zero-lag EMA by compensating for lag (EMA of price + (price - price )), then applies volatility bands using ATR multiplier (default: 1.5x).
The trend strength score is calculated by comparing current zero-lag EMA with historical values over a loop range (default: 1-70 bars). Long signals occur when trend score exceeds uptrend threshold (default: 5) AND price is above the upper volatility band. Short signals occur when trend score is below downtrend threshold (default: -5) AND price is below the lower volatility band.
Trend Momentum contributes 1 point to confluence when trend signals align with trade direction, providing trend-following confirmation with minimal lag.
10. Deviation Reversion System Component
The Deviation Reversion System component calculates deviation levels from a moving average (configurable: WMA, SMA, RMA, EMA, HMA). Three deviation levels are defined (default: 1.3%, 7.5%, 13.3%) representing progressively extreme deviations from the mean.
Buy signals occur when price drops below the first deviation level (mean - 1.3%). Sell signals occur when price rises above the first deviation level (mean + 1.3%). This component identifies when price has deviated sufficiently from its mean to warrant mean reversion trades.
Deviation Reversion contributes 1 point to confluence when price is at deviation extremes, complementing the SRZ module with a simpler percentage-based approach.
Confluence System & Signal Aggregation
APEX V2's core innovation is its confluence system. The strategy counts bullish and bearish signals from all 9 analytical modules:
FAM: Absorption buy/sell (2+ timeframe confirmation)
DBE: Bullish/bearish bias (>0.65 or <-0.65)
SMS: Near support/resistance (within 1%)
MDM: Bullish/bearish divergence (2+ divergences)
SRZ: Oversold/overbought (BB + RSI extremes)
OFA: Institutional buy/sell (75%+ confidence)
Anchor Deviation: Tension buy/sell (2+ timeframe + gap confirmation)
Deviation Reversion: Buy/sell signal (price at deviation levels)
Trend Momentum: Long/short signal (trend score + volatility bands)
When confluence mode is enabled (default: ON), the strategy requires a minimum number of modules to agree (default: 3 out of 9) before executing trades. This dramatically reduces false signals by ensuring multiple independent perspectives confirm the setup.
If both long and short signals meet confluence requirements simultaneously, the strategy selects the direction with more confirming modules. If tied, no trade is executed to avoid ambiguous setups.
Risk Management System
APEX V2 includes comprehensive risk management:
Position Sizing: Calculated based on risk per trade percentage (default: 2% of equity). The system calculates stop distance using ATR and sizes positions so that if stopped out, the loss equals exactly 2% of account equity.
Stop Loss: Set at a percentage below entry (default: 2% for longs, 2% above for shorts). Stops are placed immediately upon entry to limit maximum loss per trade.
Take Profit: Set at a percentage above entry (default: 4% for longs, 4% below for shorts). This provides a 2:1 reward-to-risk ratio.
Trailing Stop: Activates when take profit level is reached, then trails price by a percentage (default: 1.5%). This locks in profits while allowing winners to run.
Reversal Exits: If an opposite signal meets confluence requirements while in a position, the strategy immediately closes the current position. This prevents holding losing positions when market structure shifts.
Strategy Properties & Backtesting Parameters
The strategy uses realistic backtesting parameters to avoid misleading results:
Initial Capital: $10,000 (realistic for average retail trader)
Position Size: 100% of equity (controlled by risk-based position sizing)
Pyramiding: 3 (allows up to 3 positions in same direction)
Commission: Should be set to realistic levels (0.1% for crypto, 0.05% for forex, $1-5 per trade for stocks)
Slippage: Should be set to realistic levels (5-10 ticks for liquid markets)
Risk Per Trade: 2% (sustainable risk level)
Stop Loss: 2% (prevents catastrophic losses)
Take Profit: 4% (2:1 reward-to-risk ratio)
These parameters ensure backtesting results reflect realistic trading conditions. The strategy is designed to generate 100+ trades over a sufficient dataset to produce statistically significant results.
Visual Elements
FAM Gradient Ribbon: 5-layer cyan/magenta ribbon showing liquidity absorption intensity around VWAP
OFA Gradient Ribbon: 5-layer gold/indigo ribbon showing institutional order flow intensity
Anchor Deviation Ribbon: 5-layer teal/purple ribbon showing multi-timeframe VWAP tension
Entry Signals: Green triangle up for LONG entries, red triangle down for SHORT entries
Position Markers: Small circles below/above bars indicating active positions
Stop Loss Lines: Red lines showing stop loss levels for active positions
Take Profit Lines: Green lines showing take profit targets for active positions
Average Entry Price: White line showing average entry price for active positions
Comprehensive Dashboard: Real-time metrics including position status, P&L, signal confluence, individual module status, and performance metrics
Dashboard Metrics
The dashboard displays 20+ real-time metrics:
Position Status:
Status: LONG, SHORT, or FLAT
Position Size: Current position quantity
P&L: Open profit/loss in currency and percentage
Signal Confluence:
Bull Signals: Count of bullish indicators (X/9) with checkmark if confluence met
Bear Signals: Count of bearish indicators (X/9) with checkmark if confluence met
Individual Indicator Status:
FAM: BUY/SELL with deviation value
DBE: BULL/BEAR with bias score
SMS: SUP/RES (support/resistance proximity)
VCL: HIGH/LOW/NORM with percentile
MDM: BULL/BEAR with RSI value
SRZ: OS/OB (oversold/overbought) with RSI value
OFA: INST+/INST-/TOX+/TOX- with confidence percentage
ADB: BUY/SELL with deviation value
TMS: LONG/SHORT with trend score
Performance Metrics:
Win Rate: Percentage and win/loss ratio
Net Profit: Currency and percentage return
Equity: Current equity and percentage change from initial capital
Input Parameters
Strategy Settings:
Enable LONG/SHORT Trades: Toggle trade directions
Require Multi-Module Confluence: Enable/disable confluence requirement
Minimum Confluence Count: Number of modules that must agree (1-7, default: 3)
FAM Settings:
Enable FAM, VWAP Mode, Deviation Method, Volume Lookback, Volume Surge Multiplier, RVOL Threshold, 2m/5m/15m Thresholds, Show Gradient Ribbon
DBE Settings:
Enable DBE, Bias Lookback, Bias Threshold, Momentum Weight
SMS Settings:
Enable SMS, Pivot Left/Right Bars, Structure Lookback
VCL Settings:
Enable VCL, ATR Length, Regime Lookback, High/Low Vol Thresholds
MDM Settings:
Enable MDM, RSI Length, Pivot Lookback, Min Divergences
SRZ Settings:
Enable SRZ, Bollinger Length/Multiplier, RSI Length, RSI Overbought/Oversold
OFA Settings:
Enable OFA, Toxicity Lookback/Threshold, Min Absorption Coefficient, Minimum Confidence %, Show Gradient Ribbon
Anchor Deviation Settings:
Enable Anchor Deviation, VWAP Dev Mode, 2m/5m/15m VWAP Thresholds, 2m/5m/15m Osc σ-Gap Thresholds, Show Gradient Ribbon
Deviation Reversion Settings:
Enable Deviation Reversion System, MA Type, MA Period, Deviation 1/2/3 percentages
Trend Momentum Settings:
Enable Trend Momentum Signals, Zero Lag Length, Volatility Multiplier, Loop Start/End, Threshold Uptrend/Downtrend
Risk Management Settings:
Enable Stop Loss, Stop Loss %, Enable Take Profit, Take Profit %, Enable Trailing Stop, Trailing Stop %, Risk Per Trade %
Visualization Settings:
Show Entry/Exit Signals, Show Dashboard, Show All Gradient Ribbons, Ribbon Brightness Adjust
How to Use This Strategy
Step 1: Configure Backtesting Parameters
Set realistic commission and slippage in Strategy Properties. For crypto: 0.1% commission, 10 ticks slippage. For forex: 0.05% commission, 5 ticks slippage. For stocks: $1-5 per trade commission, 5 ticks slippage.
Step 2: Set Risk Parameters
Configure Risk Per Trade (default: 2%), Stop Loss (default: 2%), and Take Profit (default: 4%). These provide sustainable risk management with 2:1 reward-to-risk ratio.
Step 3: Choose Confluence Level
Set Minimum Confluence Count based on your risk tolerance. Higher confluence (4-5 indicators) produces fewer but higher-quality signals. Lower confluence (2-3 indicators) produces more signals but with more false positives.
Step 4: Enable/Disable Indicators
Toggle individual modules based on market conditions and your trading style. For trending markets, emphasize DBE, Trend Momentum, and Anchor Deviation. For ranging markets, emphasize SRZ, MDM, and Deviation Reversion.
Step 5: Monitor Dashboard
Watch the dashboard for signal confluence. When Bull Signals shows 3+/9 with checkmark, the strategy is ready to enter long. When Bear Signals shows 3+/9 with checkmark, ready to enter short.
Step 6: Review Individual Indicators
Check which specific modules are signaling. High-quality setups show alignment across multiple module types (institutional + technical + momentum + volatility).
Step 7: Backtest on Sufficient Data
Run backtests on datasets that generate 100+ trades for statistical significance. Review win rate, net profit, maximum drawdown, and profit factor.
Step 8: Optimize Parameters
Adjust module parameters for your specific instrument and timeframe. Avoid over-optimization - parameters should work across multiple instruments and time periods.
Step 9: Forward Test
After backtesting, forward test on paper trading or small live positions to validate strategy performance in real market conditions.
Step 10: Monitor Performance
Track Win Rate, Net Profit, and Equity metrics in the dashboard. If performance degrades, re-evaluate parameters or market conditions.
Best Practices
Use on liquid instruments with sufficient volume for reliable signals
Higher confluence (4-5 modules) is recommended for beginners to reduce false signals
Lower confluence (2-3 modules) can be used by experienced traders who can filter signals manually
Backtest on multiple timeframes (5m, 15m, 1h, 4h) to find optimal timeframe for your instrument
Use realistic commission and slippage - overly optimistic parameters produce misleading results
Risk no more than 2% per trade to ensure account survival during drawdown periods
Monitor VCL (Volatility Classification) - high volatility may require wider stops or reduced position size
Combine with higher timeframe trend analysis - trading with the trend improves win rate
Review individual module signals to understand why confluence was met
Disable modules that consistently produce false signals for your specific instrument
Enable trailing stops to lock in profits on winning trades
Use pyramiding (default: 3) to add to winning positions when additional confluence signals appear
Avoid trading during major news events - volatility spikes can invalidate technical signals
Backtest over multiple market conditions (trending, ranging, high volatility, low volatility)
Forward test for at least 100 trades before committing significant capital
Strategy Limitations
Requires sufficient historical data for all modules - may not work well on newly listed instruments
Multi-timeframe analysis (FAM, Anchor Deviation) requires data availability on 2m, 5m, 15m timeframes
Confluence requirement reduces trade frequency - may produce few signals on some instruments/timeframes
Backtesting results are historical and do not guarantee future performance
Strategy performance degrades during extreme volatility events (flash crashes, circuit breakers)
Commission and slippage significantly impact profitability - must use realistic values
Pyramiding can amplify losses if market reverses after adding to position
Stop loss placement using fixed percentage may be suboptimal during volatility regime changes
Module parameters optimized for one instrument may not work on others
Requires regular monitoring and parameter adjustment as market conditions evolve
Dashboard metrics are real-time snapshots and can change rapidly during volatile periods
Strategy assumes sufficient liquidity to execute at desired prices - may not work on illiquid instruments
Trailing stops can be triggered by normal volatility, closing winning trades prematurely
Reversal exits may close positions too early if opposite signal is temporary
Technical Implementation
Built with Pine Script v6 using:
9 independent analytical modules with individual enable/disable controls
Multi-timeframe security requests for FAM and Anchor Deviation (2m, 5m, 15m)
Confluence-based signal aggregation with configurable minimum threshold
Risk-based position sizing using ATR and account equity
Dynamic stop loss, take profit, and trailing stop management
Strategy.entry and strategy.exit functions for automated trade execution
Reversal exit logic to close positions when opposite confluence is met
Three 5-layer gradient ribbons (FAM, OFA, Anchor Deviation) with progressive transparency
Comprehensive dashboard with 20+ real-time metrics using table visualization
5 alert conditions for trade signals and position changes
Performance tracking (win rate, net profit, equity) displayed in dashboard
Pyramiding support (up to 3 positions) for scaling into winning trades
The code is fully open-source and can be modified to suit individual trading styles and risk tolerances.
Originality Statement
This strategy is original in its multi-confluence approach to algorithmic trading. The strategy synthesizes multiple analytical concepts into a unified framework:
It synthesizes 9 proprietary analytical concepts into a unified confluence system
The confluence requirement dramatically reduces false signals compared to single-method strategies
Each concept provides a unique perspective: institutional activity (FAM, OFA), directional bias (DBE), structural context (SMS), volatility regime (VCL), momentum divergence (MDM), mean reversion (SRZ), anchor deviation (multi-timeframe), and trend following (Trend Momentum)
Risk management system uses ATR-based position sizing to risk exactly 2% per trade regardless of stop distance
Reversal exit logic closes positions when opposite confluence is met, preventing holding losing positions during structure shifts
Comprehensive dashboard synthesizes 20+ metrics into actionable intelligence
Three gradient ribbons (FAM, OFA, Anchor Deviation) provide visual confirmation of institutional activity and order flow
Strategy is designed with realistic backtesting parameters (commission, slippage, position sizing) to avoid misleading results
Pyramiding support allows scaling into winning positions when additional confluence appears
Individual module enable/disable controls allow customization for different market conditions and trading styles
The strategy's value lies in its systematic approach to trade selection through multi-dimensional confluence. By requiring agreement across institutional activity, technical structure, momentum, volatility, and order flow, APEX V2 captures only the highest-quality setups where all factors align. This reduces emotional decision-making and provides a repeatable, testable framework for algorithmic trading.
Disclaimer
This strategy is provided for educational and informational purposes only. It is not financial advice. Trading involves substantial risk of loss. Past performance does not guarantee future results. Backtesting results are hypothetical and may not reflect actual trading performance. Always use proper risk management, never risk more than you can afford to lose, and thoroughly test any strategy on paper before committing real capital. Commission, slippage, and market conditions significantly impact profitability. No strategy works in all market conditions. Regular monitoring and parameter adjustment are required.
-Made with passion by officialjackofalltrades
Stratégie

ATR Dow Theory Because we built this engine using the Average True Range (ATR) instead of static percentages, the script natively "auto-scales" to whatever timeframe you are looking at.
An ATR on a 5-minute chart might be 15 points, while an ATR on a Daily chart might be 300 points. The multiplier simply says: "Wait for a move equal to X candles."
Because of this, your settings don't need wild adjustments, but you do need to tighten the multipliers on the massive macro timeframes (Weekly/Monthly) because a 10x ATR drop on a Monthly chart would mean the economy is literally collapsing before the script fires!
Here is the professional calibration cheat sheet for your Dow Engine:
1. The Recommended ATR Settings
Intraday Day-Trading (5m / 15m / 1hr)
ATR Length: 14 (Standard smoothing)
Minor (): 1.5 (Filters out 1-candle fakeouts)
Secondary {}: 4.0 (Catches the main intraday morning/afternoon waves)
Primary : 10.0 (Maps the dominant trend of the entire week)
Swing Trading (Daily Chart)
ATR Length: 14
Minor (): 1.5 (A quick 1-2 day breather)
Secondary {}: 3.5 (A standard week-long pullback)
Primary : 8.0 (The core macro Bull/Bear market tide)
Macro Investing (Weekly Chart)
ATR Length: 14
Minor (): 1.0 (Weekly candles are huge; 1 ATR is enough to show a minor bend)
Secondary {}: 3.0 (A multi-week correction)
Primary : 6.0 (A massive structural bear market)
Generational Holding (Monthly Chart)
ATR Length: 14
Minor (): 1.0
Secondary {}: 2.0
Primary : 4.0 (If a monthly chart drops 4x its average range, the decade-long trend is over).
Using Acronyms (PBUS, SBES, etc.) combined with a Horizontal Watermark Line turns these shift points into incredibly valuable, ongoing Support and Resistance levels without cluttering your candlesticks.
Here is exactly how I adjusted the engine based on logic:
The Acronyms: I programmed the engine to strictly use the 4-letter codes you designed.
P (Primary), S (Secondary), M (Minor)
BU (Bullish), BE (Bearish)
S (Shift)
PBUS is PRIMARY BULLISH SHIFT
SBES IS SECONDARY BEARISH SHIFT
MBUS is MINOR BULLISH SHIFT Indicateur
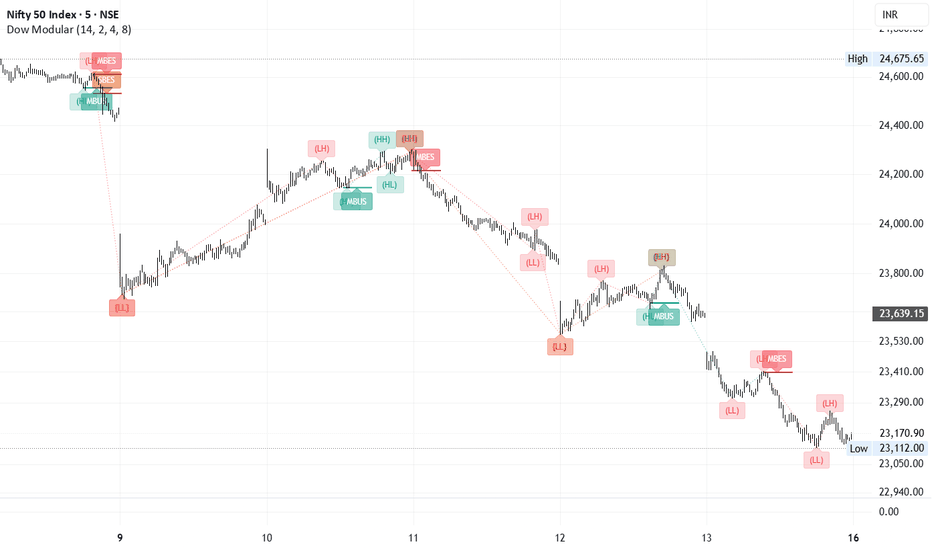
Indicateur

Statistical Reversion Engine [JOAT]Statistical Reversion Engine
Introduction
The Statistical Reversion Engine (SRE) is an advanced open-source mean reversion indicator that combines statistical deviation bands, premium/discount zone analysis, DCA level calculation, Z-score measurement, and enhanced reversion probability scoring to identify high-probability mean reversion opportunities. This indicator quantifies price deviation from statistical mean using multiple calculation methods (SMA, EMA, VWAP, HMA) and provides probabilistic assessment of reversion likelihood through multi-factor analysis including deviation magnitude, volatility regime, and historical reversion patterns.
Unlike basic Bollinger Band indicators that simply plot standard deviation bands, SRE employs a sophisticated statistical framework that calculates Z-scores, premium/discount percentages, enhanced reversion probability (incorporating volatility and premium factors), and tracks historical reversion speed to provide traders with quantitative mean reversion intelligence. The indicator also generates DCA (Dollar Cost Averaging) levels with volatility-adjusted spacing for systematic position building.
Why This Indicator Exists
This indicator addresses the challenge of identifying when price has deviated sufficiently from mean to warrant mean reversion trades. Traditional mean reversion indicators lack probabilistic quantification and don't account for volatility regime or historical reversion patterns. SRE systematically reveals:
Multiple Mean Calculations: SMA, EMA, VWAP (session/continuous), HMA for flexible mean definition
Statistical Deviation Bands: 1σ, 2σ, 3σ bands with customizable multipliers
Z-Score Calculation: Quantifies deviation in standard deviation units
Premium/Discount Analysis: Percentage deviation from mean with zone classification
Enhanced Reversion Probability: Multi-factor scoring (Z-score + premium + volatility)
DCA Level Generation: Volatility-adjusted levels for systematic position building
Historical Reversion Tracking: Measures average bars to return to mean after extreme deviation
Each component provides unique intelligence. Mean calculation defines center, deviation bands show extremes, Z-score quantifies magnitude, premium/discount shows percentage, probability scores likelihood, DCA levels provide entry framework, and historical tracking provides context.
Core Components Explained
1. Flexible Mean Calculation System
SRE supports four mean calculation methods:
f_calculate_mean(string type, int length) =>
float result = close
if type == "SMA"
result := ta.sma(close, length)
else if type == "EMA"
result := ta.ema(close, length)
else if type == "VWAP"
result := session_reset ? ta.vwap(hlc3) : ta.vwma(hlc3, length)
else if type == "HMA"
result := ta.hma(close, length)
result
Mean selection impacts reversion behavior:
- SMA: Simple average, slower to respond
- EMA: Exponential weighting, faster response
- VWAP: Volume-weighted, institutional reference
- HMA: Hull Moving Average, smoothest with minimal lag
2. Statistical Deviation Band System
Three deviation bands calculated using standard deviation:
float mean_line = f_calculate_mean(mean_type, mean_length)
float stdev = f_calculate_stdev(close, deviation_period)
float upper_band_1 = mean_line + (stdev * band_multiplier_1) // 1σ
float lower_band_1 = mean_line - (stdev * band_multiplier_1)
float upper_band_2 = mean_line + (stdev * band_multiplier_2) // 2σ
float lower_band_2 = mean_line - (stdev * band_multiplier_2)
float upper_band_3 = mean_line + (stdev * band_multiplier_3) // 3σ
float lower_band_3 = mean_line - (stdev * band_multiplier_3)
Default multipliers: 1.0, 2.0, 3.0 (customizable)
- 1σ: 68% of price action (normal range)
- 2σ: 95% of price action (extended range)
- 3σ: 99.7% of price action (extreme range)
3. Z-Score Calculation & Classification
Z-score quantifies deviation in standard deviation units:
f_calculate_zscore(float price, float mean, float stdev) =>
float zscore = stdev > 0 ? (price - mean) / stdev : 0.0
zscore
float zscore = f_calculate_zscore(close, mean_line, stdev)
Z-score interpretation:
- |Z| < 1.0: Normal deviation (40% reversion probability)
- |Z| 1.0-1.5: Moderate deviation (60% reversion probability)
- |Z| 1.5-2.0: Extended deviation (75% reversion probability)
- |Z| 2.0-2.5: Extreme deviation (85% reversion probability)
- |Z| > 3.0: 3-sigma event (95% reversion probability)
4. Premium/Discount Zone Analysis
Percentage deviation from mean with zone classification:
f_calculate_premium_discount(float price, float mean) =>
float pct = mean > 0 ? ((price - mean) / mean) * 100 : 0.0
pct
float premium_discount_pct = f_calculate_premium_discount(close, mean_line)
string current_zone =
premium_discount_pct >= premium_threshold * 2 ? "Extreme Premium" :
premium_discount_pct >= premium_threshold ? "Premium" :
premium_discount_pct <= discount_threshold * 2 ? "Extreme Discount" :
premium_discount_pct <= discount_threshold ? "Discount" :
"Fair Value"
Zone classification (default thresholds):
- Extreme Premium: >3.0% above mean (strong sell zone)
- Premium: 1.5-3.0% above mean (sell zone)
- Fair Value: -1.5% to +1.5% (neutral zone)
- Discount: -3.0% to -1.5% below mean (buy zone)
- Extreme Discount: <-3.0% below mean (strong buy zone)
5. Enhanced Reversion Probability Scoring
Multi-factor probability calculation:
f_enhanced_reversion_prob(float z, float premium_pct, float vol_rank) =>
float base_prob = f_reversion_probability(z)
// Adjust for premium/discount magnitude
float premium_factor = math.abs(premium_pct) > 3 ? 1.2 :
math.abs(premium_pct) > 2 ? 1.1 :
math.abs(premium_pct) > 1 ? 1.0 : 0.9
// Adjust for volatility (lower vol = higher reversion probability)
float vol_factor = vol_rank < 30 ? 1.2 :
vol_rank < 50 ? 1.1 :
vol_rank < 70 ? 1.0 : 0.85
math.min(base_prob * premium_factor * vol_factor, 99)
Enhanced probability accounts for:
- Base Z-score probability
- Premium/discount magnitude (larger deviation = higher probability)
- Volatility regime (lower volatility = more predictable reversion)
6. Volatility-Adjusted DCA Level Generation
DCA levels automatically adjust spacing based on volatility:
float current_atr = ta.atr(14)
float atr_pct = close > 0 ? (current_atr / close) * 100 : 0
float vol_multiplier = atr_pct > 3 ? 1.5 : atr_pct > 2 ? 1.2 : atr_pct > 1 ? 1.0 : 0.8
for i = 1 to dca_levels
float adjusted_spacing = (dca_spacing * vol_multiplier) / 100
float buy_level = mean_line * (1 - adjusted_spacing * i)
float sell_level = mean_line * (1 + adjusted_spacing * i)
array.push(dca_buy_levels, buy_level)
array.push(dca_sell_levels, sell_level)
Volatility adjustment:
- High vol (ATR% >3): 1.5x spacing (wider levels)
- Elevated vol (ATR% 2-3): 1.2x spacing
- Normal vol (ATR% 1-2): 1.0x spacing (default)
- Low vol (ATR% <1): 0.8x spacing (tighter levels)
7. Historical Reversion Speed Tracking
Measures average bars to return to mean after extreme deviation:
var array reversion_times = array.new_int(0)
var bool tracking_reversion = false
var int reversion_start_bar = 0
if math.abs(zscore) >= 2.5 and not tracking_reversion
tracking_reversion := true
reversion_start_bar := bar_index
if tracking_reversion and math.abs(zscore) < 0.5
int reversion_time = bar_index - reversion_start_bar
array.push(reversion_times, reversion_time)
tracking_reversion := false
float avg_reversion_time = array.size(reversion_times) > 0 ?
array.avg(reversion_times) : na
Average reversion time provides context for expected holding period.
Visual Elements
Mean Line: Electric lime line showing statistical mean
Deviation Bands: 1σ (lime), 2σ (violet), 3σ (deep violet) with gradient fills
Premium/Discount Zones: Background coloring (violet for premium, lime for discount)
DCA Levels: Dotted lines with "B1, B2, B3..." (buy) and "S1, S2, S3..." (sell) labels
Z-Score Label: Current Z-score displayed on price
Gradient Zone Fills: Progressive transparency between bands
Mean Reversion Signals: Triangle markers for strong buy/sell setups
Reversion Probability Heatmap: Background intensity based on enhanced probability
Dashboard: Real-time metrics including zone, P/D%, Z-score, reversion probability, mean value, distance, enhanced probability, deviation percentile, mean trend, nearest DCA, average reversion time, bars since extreme
Input Parameters
Mean Calculation:
Mean Type: SMA, EMA, VWAP, HMA (default: VWAP)
Mean Length: Period for mean calculation (default: 20)
Session Reset (VWAP): Toggle session anchoring (default: true)
Deviation Bands:
Band 1 Multiplier: 1σ multiplier (default: 1.0)
Band 2 Multiplier: 2σ multiplier (default: 2.0)
Band 3 Multiplier: 3σ multiplier (default: 3.0)
Deviation Period: Standard deviation calculation period (default: 20)
Premium/Discount:
Premium Threshold (%): Threshold for premium zone (default: 1.5%)
Discount Threshold (%): Threshold for discount zone (default: -1.5%)
DCA Levels:
Enable DCA Levels: Toggle DCA display (default: true)
Number of DCA Levels: Levels to generate (default: 5)
DCA Spacing (%): Base spacing between levels (default: 1.5%)
Visualization:
Show Deviation Bands: Toggle band display (default: true)
Show Band Fills: Toggle gradient fills (default: true)
Show Premium/Discount Zones: Toggle background coloring (default: true)
Show Z-Score Label: Toggle Z-score display (default: true)
How to Use This Indicator
Step 1: Identify Current Zone
Check dashboard "Zone" row. Extreme Discount = strong buy zone, Extreme Premium = strong sell zone.
Step 2: Assess Z-Score Magnitude
|Z| >2.0 indicates extended deviation. |Z| >3.0 is 3-sigma event (rare, high reversion probability).
Step 3: Check Enhanced Reversion Probability
Dashboard shows enhanced probability accounting for volatility and premium factors. >80% is high probability.
Step 4: Monitor Mean Trend
"Rising" mean suggests uptrend, "Falling" suggests downtrend. Trade with mean trend for higher probability.
Step 5: Use DCA Levels for Entry
Enter positions at DCA levels (B1, B2, B3 for longs; S1, S2, S3 for shorts) to average into position.
Step 6: Wait for Strong Signals
Triangle markers appear when:
- Extreme zone + enhanced probability >80% + band crossover
- These are highest conviction mean reversion setups
Best Practices
Mean reversion works best in ranging markets - avoid strong trends
3-sigma events (|Z| >3.0) have highest reversion probability but occur rarely
Use DCA levels to build positions systematically rather than all-in entries
Enhanced probability >80% indicates high-quality setup
Mean trend provides context - reversion against trend is lower probability
Volatility-adjusted DCA spacing prevents over-concentration in high vol
Average reversion time helps set realistic profit target timeframes
Combine with higher timeframe trend - mean reversion with trend is safer
Deviation percentile >90% indicates extreme deviation
Bars since extreme >50 suggests extended deviation may persist
Indicator Limitations
Mean reversion fails during strong trending markets
3-sigma events can persist longer than expected during major news
DCA levels don't account for fundamental catalysts
Enhanced probability is statistical, not deterministic
Historical reversion time doesn't guarantee future reversion speed
VWAP mean resets daily - may not be appropriate for all timeframes
Standard deviation assumes normal distribution - markets have fat tails
Premium/discount thresholds may need adjustment for different instruments
Technical Implementation
Built with Pine Script v6 using:
Four mean calculation methods (SMA, EMA, VWAP, HMA)
Three-tier deviation band system with customizable multipliers
Z-score calculation with standard deviation
Premium/discount percentage with zone classification
Enhanced reversion probability (Z-score + premium + volatility)
Volatility-adjusted DCA level generation
Historical reversion speed tracking with arrays
Deviation percentile ranking
Mean trend detection (fast vs slow mean)
Gradient zone fills with progressive transparency
Reversion probability heatmap background
Comprehensive dashboard with 12 metrics
The code is fully open-source and can be modified to suit individual trading styles.
Originality Statement
This indicator is original in its comprehensive statistical mean reversion approach. While Bollinger Bands and mean reversion are established concepts, this indicator is justified because:
It combines four mean calculation methods with three-tier deviation bands
Enhanced reversion probability incorporates Z-score, premium magnitude, and volatility regime
Volatility-adjusted DCA level generation adapts to market conditions
Historical reversion speed tracking provides empirical context
Premium/discount zone classification adds percentage-based perspective
Mean trend detection (fast vs slow) provides directional context
Deviation percentile ranking shows historical extremity
Integration of statistical measures (Z-score, stdev, percentile) with practical tools (DCA levels, signals)
Each component contributes unique information: mean defines center, deviation bands show extremes, Z-score quantifies magnitude, premium/discount shows percentage, enhanced probability scores likelihood, DCA levels provide framework, historical tracking provides context, and mean trend shows direction. The indicator's value lies in presenting these complementary perspectives simultaneously with unified statistical framework.
Disclaimer
This indicator is provided for educational and informational purposes only. It is not financial advice. Mean reversion probabilities do not guarantee outcomes. Trading involves substantial risk of loss. Past performance does not guarantee future results. Always use proper risk management and never risk more than you can afford to lose.
-Made with passion by officialjackofalltrades Indicateur

Indicateur