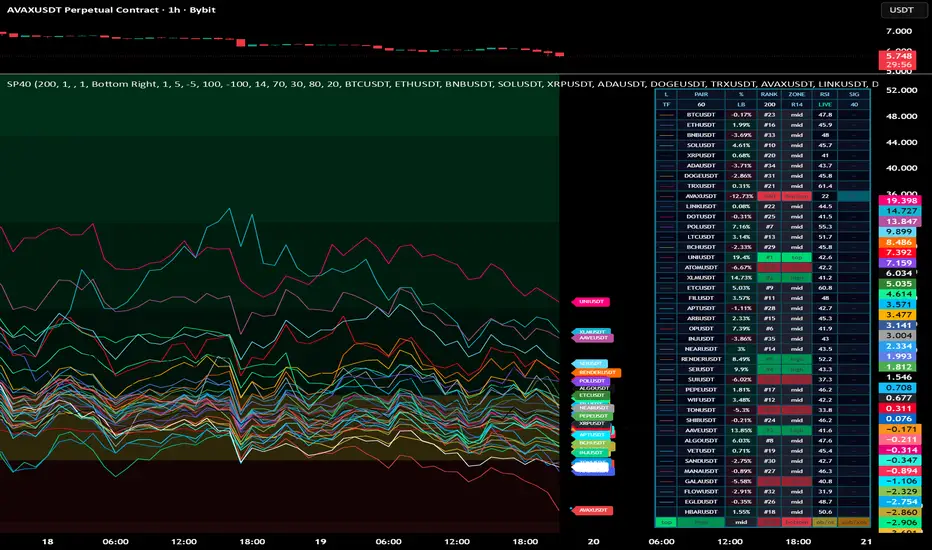
Crypto Spaghetti 40 Procrypto spaghetti 40 pro future is a multi-symbol relative strength dashboard designed to compare up to 40 crypto pairs in one clean oscillator panel.
the tool does not display normal price. instead, it rebases every selected token from the same lookback point and shows its relative performance as a percentage. this makes it easier to see which tokens are leading, which tokens are lagging, and where rotation is happening inside a crypto basket.
main idea
most traders look at one chart at a time. this tool helps compare many markets at once.
each line represents one token.
when a line is above zero, that token is performing better than its starting point over the selected lookback.
when a line is below zero, that token is performing weaker than its starting point over the selected lookback.
when one line rises faster than the others, that token is showing relative strength.
when one line falls faster than the others, that token is showing relative weakness.
what the indicator shows
performance lines
the script plots up to 40 crypto pairs as percentage performance lines. all pairs are rebased using the same lookback value, so they can be compared on the same scale.
zero line
the zero line is the base level. values above zero show positive performance from the rebase point. values below zero show negative performance from the rebase point.
background zones
the green area shows stronger positive performance.
the yellow area shows the neutral zone.
the red area shows weaker negative performance.
these zones are visual guides only. they help separate strong, neutral, and weak conditions.
rsi dots
small dots can appear on the lines when the selected token reaches rsi overbought, extreme overbought, oversold, or extreme oversold conditions.
these dots are not automatic buy or sell signals. they are momentum warnings.
panel
the panel shows each token with several useful readings:
pair: the selected crypto pair.
percent: the current relative performance.
rank: the current position of the token inside the 40-symbol basket.
zone: top, high, mid, low, or bottom.
rsi: the current rsi value.
sig: rsi status such as ob, xob, os, or xos.
rank and zone
rank shows where a token stands compared to the rest of the basket.
rank #1 means the strongest token in the current basket.
rank #40 means the weakest token in the current basket.
top means the current leader.
high means the token is inside the top group.
mid means the token is in the middle of the basket.
low means the token is inside the weak group.
bottom means the current weakest token.
this ranking system makes it easier to identify leaders and laggards without relying only on line colors.
alerts
the script includes dynamic alert logic using alert calls.
available alert logic includes:
new top token
new bottom token
token enters top 5
token enters bottom 5
top 5 token with rsi overbought or extreme overbought
bottom 5 token with rsi oversold or extreme oversold
performance crosses above the neutral top zone
performance crosses below the neutral bottom zone
to use these alerts, create a tradingview alert and select the condition:
any alert() function call
how to use the tool
step 1: choose the symbols
select the crypto pairs you want to compare. the default list includes major crypto assets and popular altcoins. you can replace any symbol with another pair.
step 2: choose the lookback
the rebase lookback controls how far back the comparison starts.
a shorter lookback gives a more reactive view.
a longer lookback gives a broader market rotation view.
for beginners, a lookback around 200 bars gives a balanced view.
step 3: read the zero line
tokens above zero are outperforming their own starting point.
tokens below zero are underperforming their own starting point.
tokens near zero are close to neutral.
step 4: check rank
rank is one of the most important readings.
a token ranked #1 is the current strongest performer in the selected basket.
a token ranked in the top 5 is part of the strongest group.
a token ranked in the bottom 5 is part of the weakest group.
step 5: check rsi status
if a token is top ranked and also shows ob or xob, it is strong but may be stretched.
if a token is bottom ranked and also shows os or xos, it is weak but may be stretched to the downside.
rsi does not replace price action. it only adds momentum context.
beginner examples
example 1: finding the strongest token
if sol is ranked #1 and its performance line is rising above the others, sol is currently leading the selected basket.
a beginner can use this information to focus analysis on sol instead of searching across many charts manually.
this does not mean immediate entry. the trader should still check structure, trend, support, resistance, and risk.
example 2: identifying weakness
if a token is ranked #40 and its line is deep in the red zone, it is the weakest token in the selected group.
this can help traders avoid weak assets during bullish conditions or watch for possible continuation weakness.
example 3: rotation
if btc was rank #1 and then eth becomes rank #1, the alert can show a top rotation.
this means leadership inside the basket has changed.
rotation can help traders understand where market attention is moving.
example 4: top 5 with rsi overbought
if a token enters the top 5 and rsi is overbought, the token is strong but potentially extended.
a beginner should not chase blindly. it is usually better to wait for a pullback, a clean continuation setup, or confirmation on the price chart.
example 5: bottom 5 with rsi oversold
if a token enters the bottom 5 and rsi is oversold, the token is weak and may be stretched.
this can be useful for studying possible capitulation, but it is not a buy signal by itself.
best use cases
market rotation analysis
crypto basket comparison
finding relative strength
finding relative weakness
spotting leaders and laggards
monitoring top 5 and bottom 5 changes
watching rsi extremes across many symbols
building a watchlist for further analysis
suggested beginner workflow
first, check the top 5.
then, check if those tokens are above zero.
then, check if they are still rising or already flat.
after that, open the normal price chart of the strongest token.
look for structure, trend, support, resistance, volume, and risk level.
do the same with the bottom 5 if you want to study weak markets.
do not trade only because a token is top ranked or bottom ranked.
the indicator is a scanner and comparison tool. it is not a full trading system.
settings explained
rebase lookback bars
sets how many bars are used as the starting point for the performance comparison.
smoothing
smooths the performance lines. higher values make the lines cleaner but slower.
use log-return style
uses log-style performance calculation instead of simple percentage calculation.
request timeframe
allows the comparison to be calculated from another timeframe. empty means the chart timeframe is used.
line width
controls the thickness of the spaghetti lines.
show futuristic panel
shows or hides the ranking panel.
show token labels
shows or hides labels at the right side of the visible chart.
background zones
controls the green, yellow, and red performance zones.
rsi settings
controls the rsi length and the overbought, oversold, extreme overbought, and extreme oversold thresholds.
alert settings
allows each alert type to be enabled or disabled.
min bars between same alert type can reduce repeated alerts.
important notes
this indicator is designed for comparison, not prediction.
a high rank means relative strength inside the selected basket.
a low rank means relative weakness inside the selected basket.
rank can change quickly in volatile markets.
rsi extremes can stay extreme during strong trends.
always confirm signals with price action.
always use risk management.
always test settings before using them in live conditions.
risk notice
this tool is for technical analysis and educational use. it does not provide financial advice and does not guarantee any result. all readings, ranks, zones, and alerts are visual references only. every trader is responsible for their own analysis, risk management, and trading decisions.
Indicateur

Volume Liquidity Sweep [XWiseTrade]Liquidity Sweep with Volume Confirmation
Most liquidity sweep and stop-hunt indicators rely on price geometry alone — they flag any wick past a prior high or low.
The problem: in quiet conditions, price drifts past old levels with no real participation, producing constant false signals. This indicator adds the missing dimension: it only flags a sweep when volume confirms it.
What makes it different
A sweep is marked only when the breaking candle trades above a configurable multiple of average volume. Low-volume drifts past a level are ignored. This is the core distinction from geometry-only sweep tools — real liquidity grabs leave a volume footprint; quiet fakeouts don't.
What it shows
•Auto-detected swing highs/lows where liquidity rests (pivot-based)
•Bull sweep — price wicks below a prior low, then closes back above, on confirmed volume
•Bear sweep — price wicks above a prior high, then closes back below, on confirmed volume
Swept levels marked on the chart
Inputs
Pivot lookback, volume average length, volume spike multiplier, signal cooldown, level display toggle.
Built-in alerts for both directions. These are descriptive market-structure signals for discretionary use, not buy/sell recommendations. Indicateur

Indicateur

Indicateur
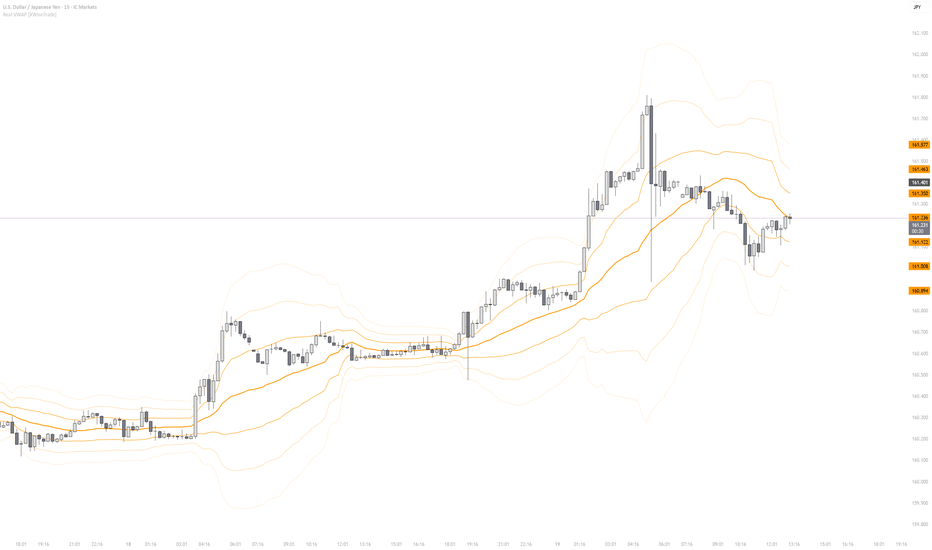
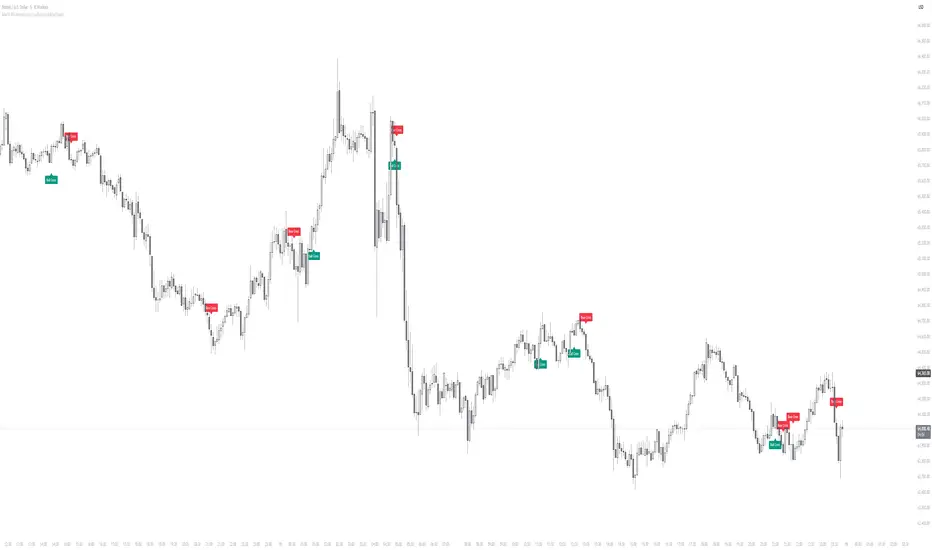
MACD RSI Momentum Confluence[XWiseTrade]MACD RSI Momentum Confluence
This indicator generates Bull/Bear signals only when a MACD signal-line cross is confirmed by two independent momentum conditions, rather than firing on the cross alone. The goal is to reduce the false crosses that a plain MACD+RSI combination produces in ranging markets.
Why these components are combined
A MACD cross marks a potential shift in momentum, but on its own it triggers frequently during choppy, directionless price action. RSI relative to its midline is a common trend filter, but a value sitting just above or below 50 says little about whether momentum is actually building. Used separately, each gives signals the other would reject. This script requires them to agree and to be accelerating in the same direction.
How the components work together
A signal requires three conditions to align on the same bar:
Trigger — MACD line crosses its signal line (up for Bull, down for Bear).
Momentum confirmation — the MACD histogram is expanding in the cross direction, so flat or contracting crosses (typical of chop) are filtered out.
Direction confirmation — RSI is on the correct side of its midline and moving toward the signal direction over a configurable lookback, not merely resting there.
A cooldown prevents clustered repeat signals after a trigger.
How to use it
Add it to any chart and timeframe. "Bull Cross" / "Bear Cross" labels mark confirmed signals; alerts are available for both. The histogram-expansion filter and RSI slope lookback are adjustable, letting you tighten the filter on lower timeframes or loosen it on higher ones. These are descriptive signals for discretionary use, not buy/sell recommendations.
Inputs: RSI length & midline, RSI slope lookback, MACD fast/slow/signal, histogram-expansion toggle, signal cooldown. Indicateur

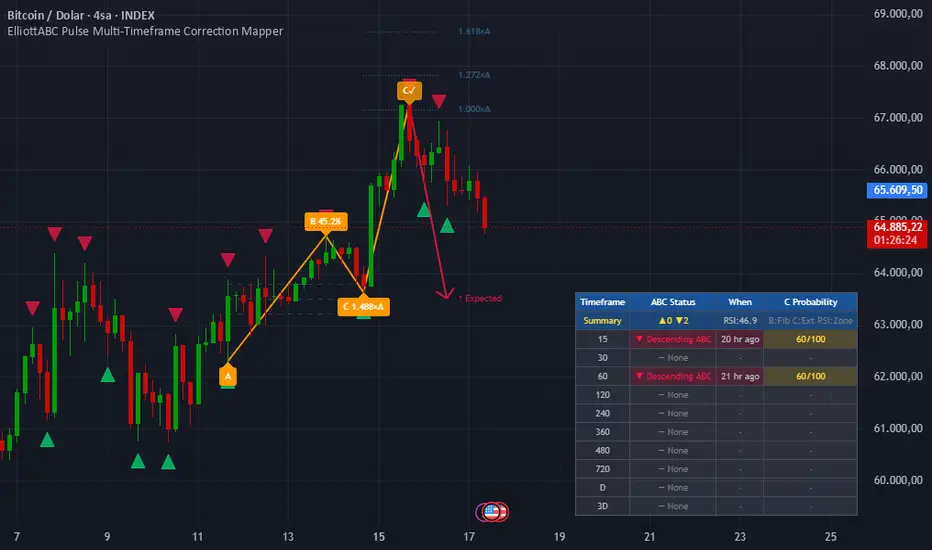
ElliottABC Pulse Multi-Timeframe Correction MapperElliottABC Pulse – Multi-Timeframe Correction Mapper
ElliottABC Pulse automatically identifies and labels Elliott Wave ABC corrective structures across up to ten simultaneous timeframes, combining classical wave theory with Fibonacci ratio validation, RSI confluence filtering, and a real-time signal scoring engine — all rendered as a single chart overlay.
Instead of manually hunting for corrective patterns on each timeframe separately, this indicator scans pivot structures across all selected timeframes at once and presents a consolidated dashboard showing signal direction, elapsed time since formation, and a composite quality score for every active timeframe.
What Is an ABC Correction?
In Elliott Wave theory, markets move in two phases: impulsive waves (in the direction of the trend) and corrective waves (counter-trend). The ABC correction is the most common corrective structure, consisting of three legs:
Wave A — The initial counter-trend move from a swing high or low
Wave B — A partial retracement back toward the origin of wave A
Wave C — A final push in the direction of wave A, typically equal to or extending beyond wave A
When the C wave completes, price often resumes the original trend direction — making C completions high-probability areas for re-entry or reversal trades.
This indicator detects two variants:
Descending ABC (H-L-H-L): A bearish correction that resolves into a potential bullish continuation. The C wave terminates below the B wave origin.
Ascending ABC (L-H-L-H): A bullish correction that resolves into a potential bearish continuation. The C wave terminates above the B wave origin.
Features
Automatic ABC corrective pattern detection using zigzag pivot filtering
Strict Fibonacci ratio validation for both wave B retracement and wave C extension
Optional RSI momentum confluence filter
Real-time 0–100 composite signal scoring system
Fibonacci target projection levels (1.000×A, 1.272×A, 1.618×A)
B wave retracement grid (38.2%, 50.0%, 61.8%)
Expected direction arrow projected from the C completion point
Duplicate-safe drawing engine — the same pattern is never drawn twice
Multi-timeframe dashboard across up to 10 user-defined timeframes
Color-coded elapsed time indicator (fresh / aging / stale signals)
Clean, non-repainting overlay with full input customization
How It Works
Pivot Detection
The indicator uses Pine Script's ta.pivothigh() and ta.pivotlow() functions with user-defined left and right bar counts to identify structural swing highs and lows. A zigzag filter (Min. Swing Size %) discards any pivot where the price move is smaller than the defined percentage threshold, eliminating micro-noise from the pivot array and keeping only meaningful structural swings.
Pivots are stored in an alternating high/low array. If two consecutive pivots occur in the same direction, only the more extreme one is kept — ensuring the zigzag structure is always clean and directionally alternating.
ABC Validation
Each candidate pattern is tested against five conditions simultaneously:
ConditionRequirementAlternating structurePivots must follow strict H-L-H-L or L-H-L-H alternationB retracement (min)Wave B must retrace at least Min A-B Retracement of wave A (default 38.2%)B retracement (max)Wave B must not retrace more than Max A-B Retracement of wave A (default 88.6%)C extension (min)Wave C must extend at least Min C Extension of wave A (default 1.0×)C extension (max)Wave C must not extend beyond Max C Extension of wave A (default 1.618×)Structural integrityC must break B's origin; B must not exceed A's originRSI confluence (optional)Descending ABC: RSI < 50 / Ascending ABC: RSI > 50
The indicator scans up to 6 consecutive pivot windows on each bar update, so it catches both fresh and recently formed patterns without missing setups due to pivot array timing.
Duplicate Prevention
A dedicated index array tracks the bar position of each pattern's A pivot. Once a pattern is drawn, its A bar index is recorded and skipped on all future bar updates — preventing the redraw artifacts common in pivot-based indicators.
Signal Scoring (0–100)
Every confirmed ABC pattern receives a composite score from four independent components:
ComponentMax ScoreConditionB Fibonacci Zone30 ptsB retracement within 0.500–0.618 (golden zone) scores full; 0.382–0.786 scores partialC Extension Zone25 ptsC extension within 1.0–1.272 (classic target) scores full; 1.272–1.618 scores partialRSI Extreme Zone25 ptsRSI below 30 (Bull) or above 70 (Bear) scores full; partial credit between 30–50 or 50–70A Wave Magnitude20 ptsWave A spanning ≥ 2% of price scores full; ≥ 1% scores partial
Scores of 70 or above indicate high-quality setups. Scores between 40–69 are moderate. Below 40 suggests marginal structure — still valid, but lower-conviction.
Chart Overlays
When a valid ABC is confirmed, the following elements are drawn directly on the chart:
Wave labels: A at the origin, B with its retracement percentage, C with its extension multiplier, and C✓ at the completion point
Connecting lines: Segment lines linking A → B → C → C✓
Fibonacci extension levels: Three dotted horizontal lines projected from the C pivot — 1.000×A, 1.272×A, and 1.618×A — showing classic C wave targets
B retracement grid: Three dashed horizontal levels at 38.2%, 50.0%, and 61.8% between A and B for precision B entry zones
Direction arrow: A projected arrow from the C✓ point toward the A-B midpoint, visually indicating the expected post-correction move direction
Multi-Timeframe Dashboard
The bottom-right table runs the full ABC detection engine independently on each of the 10 configured timeframes using request.security() with lookahead_off to prevent any future data leakage.
Each row in the table shows:
ColumnDescriptionTimeframeThe TF label as configured (e.g. 15, 60, 240, D)ABC Status▲ Ascending ABC / ▼ Descending ABC / — NoneWhenHow long ago the C pivot formed — color-coded green (< 30 min), yellow (< 4 hr), gray (older)C ProbabilityThe composite 0–100 score, color-coded green / yellow / red by strength tier
A summary row at the top displays the total count of bullish and bearish signals across all timeframes, plus the current RSI reading color-coded by zone. When multiple timeframes simultaneously show the same signal direction, confluence is high and setup quality increases significantly.
How To Use
Basic Setup
Add the indicator to your chart on any timeframe
Set TF 1 through TF 10 to the timeframes you want to monitor simultaneously (e.g. 15m, 30m, 1H, 2H, 4H, 6H, 8H, 12H, D, 3D)
Watch the bottom-right dashboard for active ABC signals across all timeframes
Tuning Pivot Sensitivity
Increase Left Bars / Right Bars for fewer, stronger pivots (better for higher timeframe structure)
Decrease them for more frequent, shorter-term pivots (better for intraday scalping)
Raise Min. Swing Size (%) to filter out noisy pivots on volatile assets such as crypto
Tuning ABC Strictness
Tighten Min/Max A-B Retracement to focus only on golden zone retracements (0.5–0.618)
Narrow Min/Max C Extension to require only classic C targets (1.0–1.272)
Enable RSI Divergence Filter on trending instruments for higher-conviction signals
Reading the Dashboard
Prioritize signals where 3 or more timeframes show the same direction simultaneously
Prefer signals with scores of 70 or above for the clearest Fibonacci structure
Use the When column to avoid acting on stale signals — fresh signals (green) carry more weight
Cross-reference with the current RSI reading in the summary row for momentum context
Fibonacci Levels
The 1.000×A level is the minimum expected C target — often used as a conservative take-profit
The 1.272×A level is the most common termination zone for standard ABC patterns
The 1.618×A level marks the extended C target — relevant in high-momentum corrective moves
The B retracement grid (38.2% / 50% / 61.8%) helps identify optimal B-wave entry levels before C begins
Recommended Use Cases
Intraday traders: Configure TF 1–5 as 5m / 15m / 30m / 1H / 2H. Look for ABC completions on the 15m or 30m confirmed by a matching signal on the 1H or 2H for intrabar precision entries.
Swing traders: Use 1H / 4H / 6H / 12H / Daily / 3D. Wait for the daily or 3D to print a fresh high-score ABC before entering on a lower timeframe pullback.
Multi-timeframe analysts: Monitor confluence across all 10 timeframes. When 4 or more timeframes simultaneously show the same signal type with scores above 60, the corrective structure is likely significant on the macro level.
Originality
This script is an original work combining zigzag-filtered pivot detection, simultaneous ten-timeframe ABC corrective pattern validation, a four-component signal scoring engine, and a proximity-safe duplicate prevention system. While Elliott Wave ABC detection is a known concept, the specific implementation — the alternating zigzag array, the 6-window sliding pattern scan, the composite scoring model, and the fully integrated MTF dashboard with elapsed-time coloring — represents the author's own approach to making corrective wave analysis practical and actionable on a live chart.
Limitations
RSI filtering uses the current bar RSI as an approximation for pivot-bar RSI. This is a deliberate simplification that improves signal quality on trending instruments but may occasionally exclude valid setups during consolidation.
The pivot array is capped at 50 pivots and the drawing history arrays at 100 entries to maintain performance. On very active instruments with tight pivot settings, the oldest patterns scroll off automatically.
TradingView's runtime limit of 500 labels and 500 lines applies. On charts with a very long history and tight pivot settings, older drawings are removed by the platform.
This tool is designed for confluence analysis and structural context, not as a standalone mechanical entry system. Always integrate with broader market structure, session context, and sound risk management.
Disclaimer
This indicator is intended for educational and analytical purposes only. No indicator can predict future market movements with certainty. Always use proper risk management and combine multiple forms of analysis before making trading decisions.
TradingView Short Description:
Automatically detect Elliott Wave ABC corrective completions across up to 10 timeframes. Features Fibonacci ratio validation, RSI confluence filtering, a 0–100 signal scoring engine, and a live multi-timeframe dashboard showing signal direction, elapsed time, and setup quality — all in a single chart overlay. Indicateur

Top Volume + EMAs + RSI [Chart TF] - Westtown TradesTop Volume + EMAs + RSI This powerful scanner displays a clean, real-time table of the top volume stocks from your chosen watchlist, sorted by today's trading volume. It combines high-volume activity with key technical signals (EMAs and RSI) all in one compact overlay-free table — perfect for quickly spotting momentum, unusual volume, and potential breakout candidates.Key Features:Volume Leaderboard — Shows today's volume, 7-day average volume, and the Volume Ratio (how many times above average).
Multi-Timeframe EMA Direction — Instant visual arrows (▲/▼) for EMA 10, 20, 50, and 200 on the chart's current timeframe.
RSI Analysis — Current RSI value with color coding: Green = Oversold
Red = Overbought
White = Neutral
Fully Customizable — Add any tickers (comma separated)
Choose how many to display (Top 5–25)
Table position, background colors, and header style
RSI length and levels
How to Use:Add your favorite tickers in the settings (default: NVDA, AAPL, MSFT, GOOGL, AMZN).
Set your desired number of rows and table position.
Switch chart timeframes — the indicator automatically updates volume, EMAs, and RSI for the active timeframe.
Look for high Volume Ratio + bullish EMA alignment + healthy RSI for strong momentum plays.
Ideal for day traders, swing traders, and momentum scanners who want to instantly see which stocks are seeing the heaviest activity combined with technical confirmation.Works on any chart timeframe and any symbol — the scanner runs independently of the chart’s main ticker.Pro Tip: Use this on a 5m or 15m chart during market hours to catch real-time volume surges.Enjoy spotting the next big movers!
Indicateur

Indicateur

Indicateur
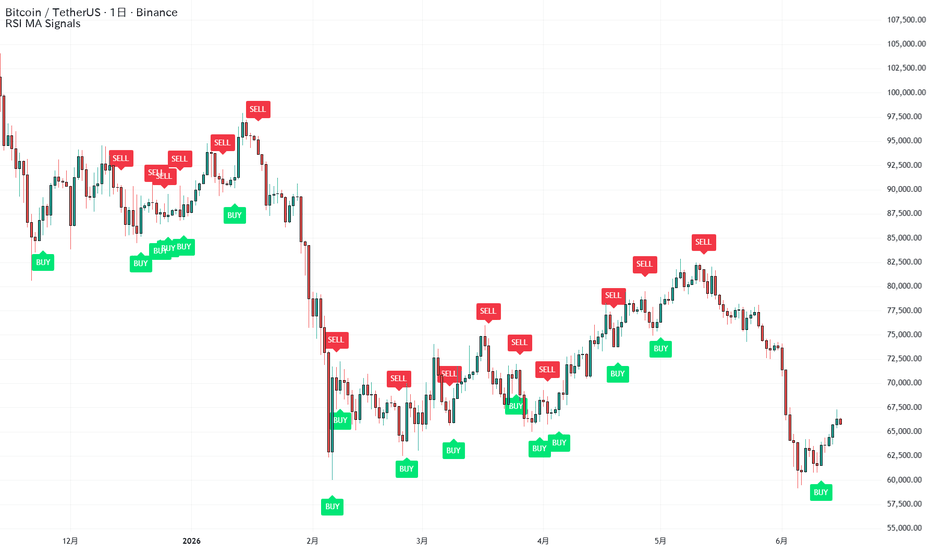
Nexus Divergence Sniper🎯 Introducing: Nexus Divergence Sniper – The Ultimate Reversal Algorithm
Are you tired of catching falling knives, getting faked out by premature signals, or watching your indicator’s signals magically vanish after price hits your stop loss? Reversal trading offers massive R:R (Risk-to-Reward) potential, but without a bulletproof filtering system, it can quickly drain your account.
Enter the Nexus Divergence Sniper (NDS).
NDS is not just another basic divergence plotter. It is an all-in-one algorithmic trading framework that seamlessly fuses Momentum (MACD), Volatility (ATR), Price Dynamics (Advanced Candlestick Action), and Volatility Bands (Bollinger Bands) into a high-probability sniper system.
🚀 How Does NDS Work?
To protect your capital from market noise, NDS enforces a strict, multi-layer confirmation matrix before printing a single BUY or SELL signal:
1. Structural Divergence: Identifies underlying trend exhaustion through double peak/trough structures synced with the MACD Histogram.
2. Pullback & Engulfing Confirmation: NDS never blindly trades the exact top or bottom. The algorithm patiently waits for a mandatory price "breath" (pullback) and triggers only when a decisive Engulfing candle confirms momentum has shifted.
3. Multi-Dimensional Noise Filtering: Powered by ATR to automatically filter out abnormal market spikes or tiny, meaningless candles. It also checks the preceding 4 candles to ensure you aren't trading directly into a runaway freight train.
⚡ Key Features:
1. 100% Non-Repainting: Signals utilize the barstate.isconfirmed protection layer. Once a signal prints on a closed candle, it stays there forever. No visual tricks, no moving goals.
2. Visual Smart SL/TP: Instantly plots dynamic, ATR-based Stop Loss, Take Profit 1 (Partial), and Take Profit 2 (Runner) levels directly on your chart.
3. Real-Time Performance Dashboard: Track your edge on the fly. The built-in stats panel automatically monitors your Win Rate, Total Trades, TP completions, and SL hits based on your chosen live chart data.
4. Customizable Bollinger Bands Filter: Fine-tune your entries. Choose to take all signals or restrict the algorithm to execute trades exclusively in premium overextended zones (Upper/Lower Bollinger halves).
Nexus Divergence Sniper doesn't promise a "Holy Grail," but it does promise absolute, algorithmic discipline for your charts. Add NDS to your arsenal today and start sniping the markets with mathematical precision! Indicateur

Indicateur

Indicateur

Indicateur

Wyckoff Accumulation HunterSurfaces potential accumulation setups in deep-drawdown names where demand may be absorbing supply — built around classic Wyckoff structure (selling climax, spring, accumulation range) with a scored, rules-based filter.
How eligibility works
A name becomes eligible only when it's at least 30% off its 2-year high and meets a liquidity floor. Eligible names are then scored 0–10 across eight conditions: drawdown depth, position relative to the 21 and 55 EMAs, selling-climax recency, range compression, volume dry-up, StochRSI reset, and proximity to the structural demand floor.
How an entry prints
An entry marker appears only when the score clears the threshold you set AND structure confirms — either a spring (an undercut-and-reclaim of the structural low) or a retracement into the 0.618–0.786 zone at EMA confluence. A base-maturity check prevents firing during waterfalls (it requires the broken low to have actually held), and signals confirm on bar close.
Conviction tagging
A filled green triangle marks a spring at the demand floor (highest conviction — invalidation sits right at the floor). A hollow gray triangle marks a spring up in the range, with the floor still open below.
On-chart structure
Three liquidity bands map the markdown: green demand, gray range, red supply. A fibonacci ladder (0.236 → 1.272) projects from the base low as a reference for managing a position, and a red line marks the invalidation level at the spring low — volume-gated, so a low-volume test poke doesn't count, only a genuine high-volume break.
Inputs
Adjustable threshold (set your own conviction level), lookback lengths (scale to any timeframe), and all display toggles.
Notes
Works on any timeframe once lookbacks are scaled; designed and tuned on the weekly. Repaint-free — all signals confirm on close, no lookahead. This is a discretionary analysis tool to surface setups for your own research. It is not a recommendation or financial advice, and prior structure does not guarantee future behavior. Indicateur

Indicateur

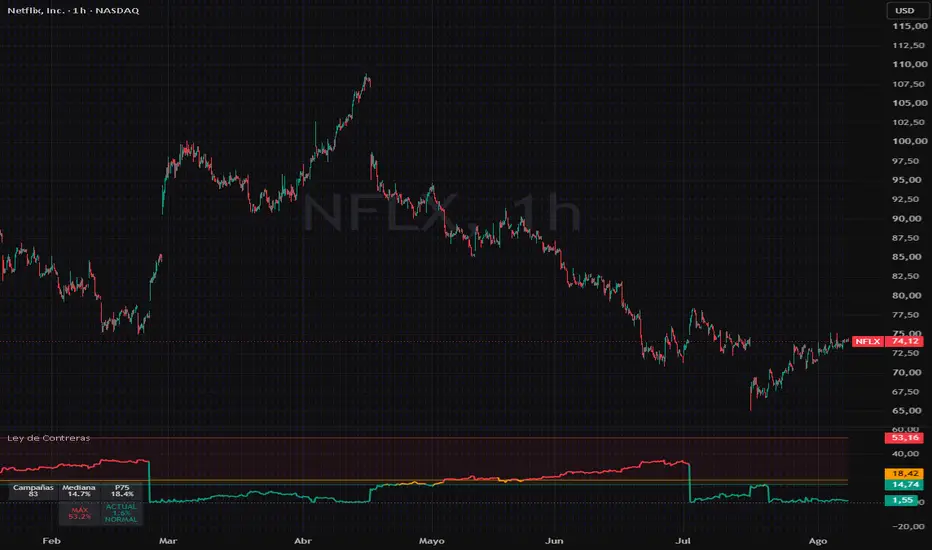
Campaign Map - Contreras Law Version en espanol mas abajo. · English version first, Spanish below.
─────────────────────────────────
CAMPAIGN MAP — CONTRERAS' LAW
WHAT IT MEASURES
This indicator builds the historical distribution of a symbol's
campaign corrections (peak→trough declines confirmed by reversal) and
places the CURRENT correction inside that map: is it normal breathing,
a deep pullback, or statistically unusual territory?
THE OBSERVATION BEHIND IT
Contreras' Law (Jacinto Contreras, June 2026): in US large-cap
technology stocks, the typical depth of campaign corrections converges
to a structural constant (~14-15% median at campaign scale),
regardless of the symbol. What differentiates each stock is not its
median but its historical maximum tail (observed: from ~25% to ~53%
depending on the symbol, across ~11 years of hourly data on 9 names).
Operational takeaway: MONITOR WITH THE MEDIAN, SIZE WITH THE TAIL.
HOW IT WORKS
· A reversal-threshold zigzag detects campaign peaks and troughs.
· Only COMPLETED corrections (confirmed by reversal) enter the
statistics: median, 75th percentile, and historical maximum.
· The main line plots the depth of the ongoing correction, colored by
zone: normal (teal), deep (orange), unusual (red).
· Summary table with the symbol's map and current status.
· Two alerts: median cross and P75 cross.
HOW TO USE IT
· Below the median: normal breathing; the pullback alone carries no
trend-change information.
· Between median and P75: deep but normal correction.
· Above P75: statistically unusual territory. The correct reading is
NOT "it must bounce now" — it is: look for exhaustion evidence
(divergences, capitulation) and demand confirmation.
· The historical maximum (the tail) is the worst-case reference for
position sizing and campaign stops.
INPUTS
· Reversal (%): rally confirming the end of a bearish campaign.
8% = campaign scale (default). 3% = swing scale.
· Minimum depth (%): smaller corrections are excluded from the map.
10% campaign / 5% swing.
LIMITATIONS (read before use)
· Statistics do NOT repaint (completed corrections only), but the
ONGOING correction is provisional by nature: its campaign peak may
extend until the reversal confirms.
· The median convergence was observed in US large-cap tech on the
hourly timeframe; it may not hold in other sectors, assets or
timeframes. Verify it on your symbol before relying on it.
· Enough campaigns (>8-10) are required for the map to be
statistically meaningful; the indicator shows "calibrating…" until
then.
· This is a MEASUREMENT and context tool. It does not generate buy or
sell signals and guarantees no outcome. Not financial advice.
─────────────────────────────────
VERSIÓN EN ESPAÑOL
MAPA DE CAMPAÑAS — LEY DE CONTRERAS
QUÉ MIDE
Este indicador construye la distribución histórica de las correcciones
de campaña de un valor (caídas máximo→mínimo confirmadas por reversión)
y sitúa la corrección actual dentro de ese mapa: ¿es una respiración
normal, una corrección profunda o territorio inusual?
LA OBSERVACIÓN QUE LO ORIGINA
Ley de Contreras (Jacinto Contreras, junio de 2026): en valores
tecnológicos estadounidenses de alta capitalización, la profundidad
típica de las correcciones de campaña converge en una constante
estructural (~14-15% de mediana, escala campaña), independiente del
símbolo. Lo que diferencia a cada valor no es su mediana, sino su cola
máxima histórica (observado: desde ~25% hasta ~53% según el símbolo,
sobre ~11 años de datos horarios en 9 valores).
Moraleja operativa: VIGILAR CON LA MEDIANA, DIMENSIONAR CON LA COLA.
CÓMO FUNCIONA
· Un zigzag por umbral de reversión detecta picos y valles de campaña.
· Solo las correcciones COMPLETADAS (confirmadas por reversión) entran
en la estadística: mediana, percentil 75 y máximo histórico.
· La línea principal muestra la profundidad de la corrección en curso,
coloreada según la zona: normal (verde), profunda (naranja),
inusual (rojo).
· Tabla resumen con el mapa del símbolo y el estado actual.
· Dos alertas: cruce de la mediana y cruce del P75.
CÓMO USARLO
· Por debajo de la mediana: respiración normal; el retroceso no es,
por sí solo, información de cambio de tendencia.
· Entre mediana y P75: corrección profunda pero dentro de lo normal.
· Por encima del P75: territorio estadísticamente inusual. La lectura
correcta no es "ya tiene que rebotar", sino: buscar señales de
agotamiento (divergencias, capitulación) y exigir confirmación.
· El máximo histórico (la cola) es la referencia de peor caso para
dimensionar posición y stops de campaña.
PARÁMETROS
· Reversión (%): rally que confirma el fin de una campaña bajista.
8% = escala campaña (por defecto). 3% = escala swing.
· Profundidad mínima (%): correcciones menores no entran al mapa.
10% campaña / 5% swing.
LIMITACIONES (léelas antes de usar)
· Las estadísticas NO repintan (solo correcciones completadas), pero
la corrección EN CURSO es provisional por naturaleza: su máximo de
campaña puede extenderse hasta que la reversión confirme.
· La convergencia de medianas está observada en tecnológicas USA de
alta capitalización en marco horario; en otros sectores, activos o
marcos puede no cumplirse. Compruébalo en tu símbolo antes de usarlo.
· Se necesitan suficientes campañas (>8-10) para que el mapa tenga
valor estadístico; el indicador muestra "calibrando…" mientras tanto.
· Es una herramienta de MEDICIÓN y contexto. No genera señales de
compra/venta ni garantiza resultado alguno. No es asesoramiento
financiero. Indicateur

Indicateur
Stratégie

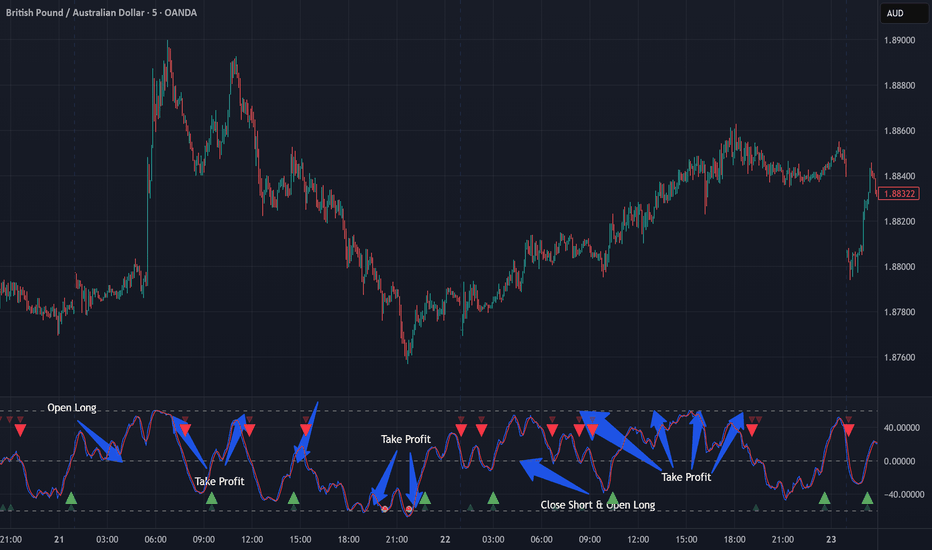
Nadaraya-Watson Envelope [Gabremoku]Nadaraya-Watson Envelope
This indicator builds a non-repainting Nadaraya-Watson envelope using a one-sided Gaussian kernel, so every value is computed from the current bar and past bars only. The goal is to provide a smoother adaptive baseline than a standard moving average while keeping the script operationally honest and suitable for live use.
What makes this script different:
- The central basis is a kernel-weighted Nadaraya-Watson estimate, not a classic SMA/EMA baseline.
- The main envelope is not built from standard deviation by default. It uses kernel-weighted mean absolute deviation (MAD), which is generally less sensitive to single-bar outliers and often produces a more stable channel.
- Standard deviation bands can still be enabled as an optional overlay, so users can compare MAD-based and Stdev-based dispersion around the same kernel basis.
- Signal logic is configurable. Breakout labels can be triggered by close crossing the band, wick piercing the band, or full body breakout, which makes the visual behavior easier to align with the trader’s interpretation.
How it works:
The script applies Gaussian weights to past bars inside the selected window. More recent bars receive the highest weight, while older bars progressively contribute less. The Bandwidth input controls how fast those weights decay. In practice, the effective lookback is usually much shorter than the full Window setting when Bandwidth is low. A practical rule of thumb is that the effective lookback is about 3 × Bandwidth bars, capped by the Window value.
The indicator computes:
1. A kernel-weighted mean, used as the Nadaraya-Watson basis.
2. A kernel-weighted MAD, used as the primary envelope width.
3. An optional kernel-weighted standard deviation, displayed only when the comparison bands are enabled.
The upper and lower MAD bands are then filled with a gradient that increases in strength as price moves away from the basis toward the envelope edges. This makes the visual intensity reflect displacement magnitude, not just bullish or bearish direction.
Compression logic:
The compression zone is based on min-max normalization of envelope width over a lookback period. This is not a statistical percentile rank. A threshold of 0.15 means the current envelope width is near the lower end of the observed width range over the selected compression lookback.
Signal modes:
- Close Cross: triggers only when the close crosses a band.
- Wick Pierce: triggers when the candle’s high or low exceeds a band.
- Body Breakout: triggers when the candle body exceeds a band.
Use Wick Pierce if you want signal labels to match the visible moment where candles extend outside the envelope.
How to use it:
- Use the basis as an adaptive trend reference.
- Use the MAD envelope to judge whether price is stretched relative to recent kernel-weighted behavior.
- Watch compression zones for narrow-range conditions that may precede expansion.
- Compare MAD and Stdev bands when you want to evaluate whether recent volatility is dominated by isolated spikes or by broader dispersion.
Practical notes:
- This script is non-repainting by construction because it does not use centered calculations or future bars.
- Low Bandwidth values create a more reactive basis and shorter effective memory.
- High Bandwidth values create a smoother basis and wider historical influence.
- Increasing Window far beyond roughly 3 × Bandwidth usually has little additional effect.
- Signal labels are state-machine filtered, so they are designed to mark sequence transitions rather than every repeated touch outside the bands.
This indicator is intended as a visual decision-support tool, not as a standalone trading system. It helps traders study adaptive trend, envelope displacement, compression, and breakout structure in a cleaner way than a standard volatility channel. Indicateur
Indicateur

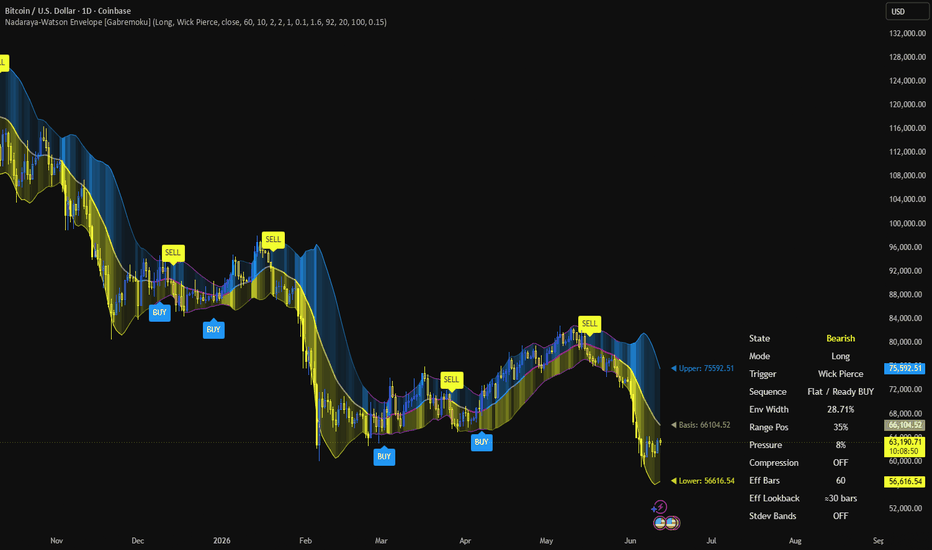
Self-Validating Elliott Wave EngineSELF-VALIDATING ELLIOTT WAVE ENGINE
A probabilistic Elliott Wave framework that does three things most wave tools do not: it weighs SEVERAL competing counts at once instead of asserting one, it CALIBRATES its own confidence against what actually happened on the instrument you are viewing, and it tells you honestly when no count is trustworthy. It is decision-support and context - not a signal generator, and never a claim of certainty.
WHY THESE PARTS BELONG TOGETHER (one engine, not a bundle)
Elliott Wave analysis is unavoidably ambiguous: the same swings can support an impulse, a zigzag, a flat or a triangle, and practitioners disagree constantly. A tool that draws one count and hides that ambiguity is misleading. This script is built as a single pipeline whose stages exist specifically to manage that ambiguity, and removing any one stage breaks it:
1. Structure - an alternating swing (ZigZag) series is built from confirmed pivots, and each pivot is tagged with momentum (RSI) and relative volume. This is the raw evidence every wave rule is tested against; without a clean swing series there is nothing to count.
2. Multi-count pattern engine - from that swing series the script forms several competing labelled hypotheses at once (impulse forming wave 3/4/5 or complete, zigzag, flat, contracting triangle). Because Elliott is ambiguous, evaluating alternatives is the whole point, not an add-on.
3. Scoring - each hypothesis is graded on Fibonacci fit, proportion and the alternation guideline (waves 2 and 4 should differ in form), and "wave energy" (does wave 3 thrust hardest, in trend direction, on rising volume?). These are combined deliberately: Fibonacci ratios alone mislabel corrections as impulses; momentum alone is directionless noise; only together do they discriminate real structure.
4. Regime context - a trend/range/compression read (from ADX and ATR) tilts the priors, because impulses are more likely in trends and corrections in ranges. It changes the odds, it does not override the structure.
5. Market-structure confirmation - an independent break-of-structure / change-of-character check raises or lowers the chosen count, so the wave read must agree with raw price action to score well.
6. Calibrated forecast - the forward zone is built from THIS chart's own distribution of historical retracement depths, not fixed ratios pulled from a textbook, so it reflects how the specific instrument actually behaves.
7. Outcome calibration - every forward call (target + invalidation + confidence) is logged and later checked: did price reach target before invalidation? Outcomes are bucketed by confidence, so the confidence number on screen can be mapped to a MEASURED hit-rate. This is the stage that makes the tool self-validating, and it is impossible without all the stages above feeding it.
So the components are not stacked for convenience - they form one loop: build competing hypotheses, score them on structure and momentum, tilt by regime, confirm against price structure, forecast from the instrument's own history, then grade that forecast against reality and report the measured reliability. That is why this is one indicator rather than seven separate overlays.
HOW IT WORKS ON THE CHART
- Wave labels and connecting lines draw the primary (highest-scoring) count's structure.
- A dashed projection line and a shaded forecast zone mark where the primary count expects price to go, with the zone width calibrated from the chart's own retrace history.
- A dashboard reports: the primary count with its probability share, its position and stage, the two best alternative counts, the raw confidence, the measured calibrated hit-rate once enough cases have resolved, the regime, the market-structure state (and whether it confirms or warns), the hard-rule pass/fail, wave energy, an opportunity read (confidence shaped by reward-to-risk and structure), and the target / invalidation levels.
HOW TO USE IT
- Read the ambiguity, not a single answer. The secondary and tertiary counts and their probabilities tell you how clear or murky the structure currently is.
- Trust "Calibrated" over "Confidence". Confidence is the raw structural score; the calibrated figure is the measured success rate for that confidence level on resolved cases - the honest number.
- Respect "stand aside". When confidence is below your threshold the panel says so instead of forcing a count. That is a feature.
- Use target and invalidation as context for your own plan. Invalidation is the level that would break the primary count; the forecast zone is where it expects to resolve. The script places no orders.
- Combine with your own method. The market-structure and regime rows are there so the wave read can be cross-checked against plain price action.
SETTINGS OVERVIEW
- Structure: swing sensitivity (pivot legs), max swings stored, and pivot source - wicks (high/low) or bodies (close), so it suits how you read a given market.
- Scoring weights: Fibonacci fit, proportion/look, wave-3 momentum.
- Context: ADX length and trend threshold.
- Forecast: inner/outer percentiles of the retrace distribution, minimum swings to calibrate, minimum resolved cases before the calibrated hit-rate is trusted.
- Display: minimum confidence for a "clean" count, label/zone/panel toggles, bull/bear colours.
- Alerts: new wave, count flip, invalidation breach, forecast-zone entry (via "Any alert() function call").
Pivot source is selectable and volume is used only when a symbol reports it, so the engine runs on futures, equities, forex, crypto and indices on any timeframe.
ORIGINALITY
Most Elliott tools draw a single count and stop. This one runs a bounded multi-count search, scores each hypothesis on structure plus momentum plus volume, tilts by regime and confirms against market structure, forecasts from the instrument's own retrace distribution, and - uniquely - measures its own realised hit-rate per confidence level so the number on screen is grounded in outcomes rather than asserted. It quantifies and reports its own reliability.
REPAINT NOTICE AND LIMITATIONS (honest)
- Swing detection uses confirmed pivots, which finalise a fixed number of bars after they form. The most recent leg is therefore always provisional and can change. This is inherent to Elliott structure detection and is disclosed deliberately, not hidden.
- Counts are probabilistic hypotheses, not predictions. Two analysts - and this engine on two settings - can read the same chart differently.
- Calibration is a long-run estimate over resolved cases on this chart; early on, and after a regime change, it needs samples before it means anything, and past hit-rate is not a future guarantee.
- This is context and decision-support. It is not a trading system and issues no orders.
DISCLAIMER
This script is for research and education only. It is not financial advice, not a recommendation, and not a solicitation to trade. It places no orders and guarantees no outcome. Markets carry risk; test any tool on your own data and timeframe and make your own decisions.
Indicateur

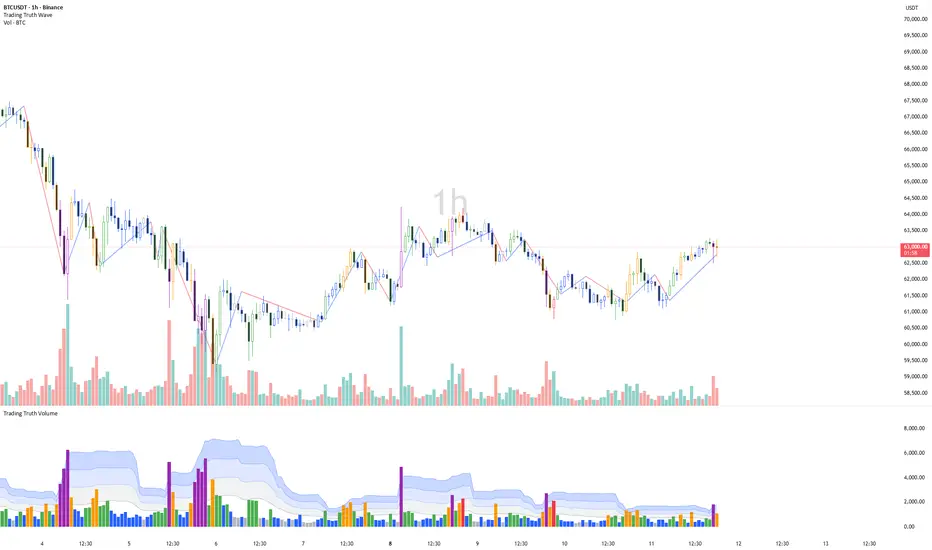
Trading Truth Volume================================================================================
📊 Trading Truth Volume
🎯 Wave Volume Analysis & Volume Slope Detection
================================================================================
This companion indicator extends the Geometric Trading System by providing
advanced volume analysis—wave volume tracking, volume slope detection, and
multi-level standard deviation bands for identifying climax and exhaustion.
================================================================================
🔷 CORE VOLUME CLASSIFICATION SYSTEM
================================================================================
The system classifies each bar's volume relative to a Wilder's Moving Average,
creating a visual heatmap for instant volume intensity recognition.
--------------------------------------------------------------------------------
📊 VOLUME INTENSITY LEVELS
--------------------------------------------------------------------------------
💜 ULTRA HIGH VOLUME (2.2x+ avg)
→ Climax volume—major institutional activity or capitulation
→ Often marks reversals, breakouts, or exhaustion points
→ Color: Purple bars
🔴 VERY HIGH VOLUME (1.8x - 2.2x avg)
→ Strong institutional participation
→ Confirms major trend moves or distribution/accumulation
→ Color: Red bars
🟠 HIGH VOLUME (1.2x - 1.8x avg)
→ Above-average activity
→ Validates breakouts and trend continuation
→ Color: Orange bars
🟢 NORMAL VOLUME (0.8x - 1.2x avg)
→ Healthy trending volume
→ Standard market participation
→ Color: Green bars
🔵 LOW VOLUME (0.4x - 0.8x avg)
→ Weak conviction
→ Pullback or consolidation phase
→ Color: Blue bars
⚪ VERY LOW VOLUME (<0.4x avg)
→ Minimal liquidity—avoid entries
→ Holiday/weekend sessions or dead zones
→ Color: Silver bars
================================================================================
🌊 WAVE VOLUME TRACKING SYSTEM
================================================================================
The indicator tracks cumulative volume within each price wave using Renko-style
direction detection. This reveals whether buyers or sellers are in control.
--------------------------------------------------------------------------------
📈 UPWAVE VOLUME TRACKING
--------------------------------------------------------------------------------
When price creates higher highs (direction = UP):
→ Cumulative volume is tracked for the entire upwave
→ Labels show: V (% change | bars)
→ Example: "15420V (2.35% | 12)" = 15420 volume, 2.35% move, 12 bars
--------------------------------------------------------------------------------
📉 DOWNWAVE VOLUME TRACKING
--------------------------------------------------------------------------------
When price creates lower lows (direction = DOWN):
→ Cumulative volume is tracked for the entire downwave
→ Same label format with direction context
→ Compare upwave vs downwave volume for trend strength
--------------------------------------------------------------------------------
🔄 DIRECTION CHANGE DETECTION
--------------------------------------------------------------------------------
The system uses configurable methods to detect wave direction changes:
ATR Method (Default)
→ Uses Average True Range to filter noise
→ Value = ATR period (default: 14)
→ Best for: Volatile markets, crypto
Traditional Method
→ Fixed point value for direction change
→ Value = minimum points to change direction
→ Best for: Stable markets, indices
Part of Price Method
→ Percentage-based direction change
→ Value = divisor (price / value = threshold)
→ Best for: Scaling across different price levels
================================================================================
📐 VOLUME SLOPE ANALYSIS (Advanced)
================================================================================
The slope analysis reveals whether volume is INCREASING or DECREASING within
each wave—critical for identifying climax vs exhaustion.
--------------------------------------------------------------------------------
📈 SLOPE DETECTION METHODS
--------------------------------------------------------------------------------
🔷 SIMPLE METHOD
→ Draws line from lowest volume bar to highest volume bar in wave
→ Shows clear volume trend direction
→ Best for: Quick visual assessment
🔷 LINEAR REGRESSION METHOD
→ Fits a regression line through all volume bars in wave
→ Smoother, more statistically robust
→ Best for: Precise volume trend analysis
--------------------------------------------------------------------------------
🎨 SLOPE INTERPRETATION
--------------------------------------------------------------------------------
🟢 UPWAVE + RISING VOLUME SLOPE
→ Buyers increasing commitment
→ Strong trend continuation signal
→ Look for: Breakout confirmations
🟢 UPWAVE + FALLING VOLUME SLOPE
→ Buyers losing steam
→ Potential exhaustion warning
→ Look for: Pullback or reversal setup
🔴 DOWNWAVE + RISING VOLUME SLOPE
→ Sellers increasing pressure
→ Strong distribution or panic
→ Look for: Capitulation bottoms
🔴 DOWNWAVE + FALLING VOLUME SLOPE
→ Selling pressure diminishing
→ Potential bottoming pattern
→ Look for: Reversal setups
================================================================================
📊 VOLUME STANDARD DEVIATION BANDS
================================================================================
The system plots statistical bands around the volume moving average to identify
abnormal volume spikes and exhaustion zones.
--------------------------------------------------------------------------------
📏 BAND LEVELS
--------------------------------------------------------------------------------
⚪ VOLUME MA (Gray Line)
→ Base average volume level
→ Center of the statistical distribution
🔵 STDDEV 1 BAND (Light Blue)
→ 1 standard deviation above MA
→ ~68% of volume bars fall below this level
→ Moderate volume spike threshold
🔵 STDDEV 2 BAND (Medium Blue)
→ 2 standard deviations above MA
→ ~95% of volume bars fall below this level
→ Significant volume spike threshold
🔵 STDDEV 3 BAND (Dark Blue)
→ 3 standard deviations above MA
→ ~99.7% of volume bars fall below this level
→ EXTREME volume—climax or capitulation zone
--------------------------------------------------------------------------------
🎯 BAND TRADING SIGNALS
--------------------------------------------------------------------------------
📊 Volume Touching StdDev 1
→ Above average activity
→ Confirms trend strength
→ Normal for breakouts
📊 Volume Touching StdDev 2
→ Unusual volume spike
→ Institutional activity likely
→ Watch for continuation OR reversal
📊 Volume Touching StdDev 3
→ EXTREME volume event
→ Often marks major turning points
→ Climax tops or capitulation bottoms
================================================================================
⚙️ TRADINGVIEW INPUT SETTINGS
================================================================================
📊 BASIC VOLUME SETTINGS
--------------------------------------------------------------------------------
☑️ Show Volume Moving Average
Default: OFF
→ Plots Wilder's MA line on volume
→ Useful for seeing the dynamic average
📏 Length of MA applied on Volume
Default: 20
Range: 1-200
→ Period for volume moving average calculation
→ Lower = more responsive, Higher = smoother
--------------------------------------------------------------------------------
📈 VOLUME RATIO THRESHOLDS
--------------------------------------------------------------------------------
These ratios define the volume classification boundaries:
🔢 Ultra High Volume Ratio
Default: 2.2
→ Volume >= 2.2x MA = Ultra High (Purple)
🔢 Very High Volume Ratio
Default: 1.8
→ Volume >= 1.8x MA = Very High (Red)
🔢 High Volume Ratio
Default: 1.2
→ Volume >= 1.2x MA = High (Orange)
🔢 Normal Volume Ratio
Default: 0.8
→ Volume >= 0.8x MA = Normal (Green)
🔢 Low Volume Ratio
Default: 0.4
→ Volume >= 0.4x MA = Low (Blue)
🔢 Very Low Volume Ratio
Default: 0.4
→ Volume < 0.4x MA = Very Low (Silver)
💡 TIP: Adjust ratios based on your market's volatility. Crypto may need
higher thresholds (2.5x, 2.0x), while forex may need lower (1.8x, 1.5x).
--------------------------------------------------------------------------------
🌊 WAVE VOLUME SETTINGS
--------------------------------------------------------------------------------
🎨 Up Volume Color
Default: Black
→ Color for upwave volume labels
🎨 Down Volume Color
Default: Black
→ Color for downwave volume labels
📏 Size of Wave Line
Options: 1, 2, 3
Default: 2
→ Line thickness for wave markers
☑️ Plot Wave Volume
Default: OFF
→ Enable to show wave volume labels on chart
→ Shows cumulative volume per wave with % change
--------------------------------------------------------------------------------
🔧 RENKO DIRECTION SETTINGS
--------------------------------------------------------------------------------
📐 Renko Assignment Method
Options: ATR, Traditional, Part of Price
Default: ATR
ATR: Uses Average True Range for direction detection
→ Value = ATR period (e.g., 14)
→ Best for: Adaptive to volatility
Traditional: Fixed point threshold
→ Value = minimum points to change direction
→ Best for: Consistent markets
Part of Price: Percentage-based
→ Value = divisor (price / value = threshold)
→ Best for: Multi-asset strategies
🔢 Value
Default: 14.0
→ Meaning depends on method selected above
📊 Price Source
Options: Close, Open / Close, High / Low
Default: Close
→ Which price to use for direction detection
🔄 Use True Range instead of Volume
Options: Always, Auto, Never
Default: Auto
→ Auto: Uses True Range when volume data unavailable
→ Useful for indices or assets without volume
--------------------------------------------------------------------------------
📏 VOLUME DISPLAY SETTINGS
--------------------------------------------------------------------------------
📐 Size
Options: Tiny, Small, Medium, Large, Huge
Default: Medium
→ Size of wave volume labels
🔢 Volume Scale Down Factor
Options: 1, 10, 100, 1000, ... 1000000000
Default: 1
→ Divides volume figures for readability
→ Use 1000 for stocks, 1000000 for crypto
☑️ Show Pivot Markers
Default: OFF
→ Shows arrow markers at wave pivots
🎨 High Pivot Color
Default: Gray
→ Color for swing high markers
🎨 Low Pivot Color
Default: Black (50% transparency)
→ Color for swing low markers
☑️ Show Volume Candles
Default: OFF
→ Colors candles based on volume intensity
→ Green shades for up candles, Red for down
🔢 Volume EMA Period
Default: 20
→ EMA period for volume candle coloring
--------------------------------------------------------------------------------
📐 VOLUME SLOPE ANALYSIS SETTINGS
--------------------------------------------------------------------------------
☑️ Enable Volume Slope Analysis
Default: ON
→ Master toggle for slope detection features
📊 Slope Method
Options: Simple, Linear Regression
Default: Simple
Simple: Line between swing low/high volume points
Linear Regression: Fitted line through all wave bars
☑️ Show Volume Std Dev Bands
Default: ON
→ Displays the statistical deviation bands
🔢 Volume Std Dev Period
Default: 20
→ Period for standard deviation calculation
📏 Slope Line Width
Options: 1, 2, 3, 4
Default: 2
→ Thickness of slope lines
🎨 Upwave Slope Color
Default: Green (30% transparency)
→ Color for rising wave slope lines
🎨 Downwave Slope Color
Default: Red (30% transparency)
→ Color for falling wave slope lines
================================================================================
🟢 BULLISH VOLUME SIGNALS
================================================================================
--------------------------------------------------------------------------------
Signal 1: Climax Volume at Support
--------------------------------------------------------------------------------
Setup: Ultra High volume (purple) at geometric support level
Interpretation: Capitulation selling—smart money absorbing supply
📥 Action: Look for bullish reversal candle
🎯 Target: Previous swing high or midpoint
📊 Confirmation: Volume slope turning up in new wave
--------------------------------------------------------------------------------
Signal 2: Rising Volume in Upwave
--------------------------------------------------------------------------------
Setup: Volume slope trending UP during upwave
Interpretation: Buyers increasing commitment—trend acceleration
📥 Action: Add to long positions on pullbacks
🎯 Target: Extended targets (TP3, TP4)
📊 Confirmation: Each swing low has higher volume than previous
--------------------------------------------------------------------------------
Signal 3: Decreasing Volume on Pullback
--------------------------------------------------------------------------------
Setup: Volume drops to Low/Very Low during downwave correction
Interpretation: Healthy profit-taking, no distribution
📥 Action: Prepare for continuation entry
🎯 Target: New highs
📊 Confirmation: Volume expands when uptrend resumes
================================================================================
🔴 BEARISH VOLUME SIGNALS
================================================================================
--------------------------------------------------------------------------------
Signal 1: Climax Volume at Resistance
--------------------------------------------------------------------------------
Setup: Ultra High volume (purple) at geometric resistance
Interpretation: Blow-off top—smart money distributing
📤 Action: Look for bearish reversal candle
🎯 Target: Previous swing low or midpoint
📊 Confirmation: Volume slope turning down in new wave
--------------------------------------------------------------------------------
Signal 2: Rising Volume in Downwave
--------------------------------------------------------------------------------
Setup: Volume slope trending UP during downwave
Interpretation: Panic selling—trend acceleration down
📤 Action: Add to short positions on rallies
🎯 Target: Extended targets (TP3, TP4)
📊 Confirmation: Each swing high has higher volume than previous
--------------------------------------------------------------------------------
Signal 3: Decreasing Volume on Rally
--------------------------------------------------------------------------------
Setup: Volume drops to Low/Very Low during upwave bounce
Interpretation: Weak buying, no accumulation
📤 Action: Prepare for continuation short entry
🎯 Target: New lows
📊 Confirmation: Volume expands when downtrend resumes
================================================================================
🎯 VOLUME + GEOMETRY CONFLUENCE
================================================================================
The Volume indicator works best when combined with the main Geometric Trading
System indicator. Look for these high-probability setups:
--------------------------------------------------------------------------------
💎 CONFLUENCE SETUP 1: Angle + Volume Spike
--------------------------------------------------------------------------------
Condition: Price touches 1x1 geometric angle
+ Ultra High or Very High volume bar
+ Volume slope diverging from price direction
= HIGH PROBABILITY REVERSAL
--------------------------------------------------------------------------------
💎 CONFLUENCE SETUP 2: Midpoint + Volume Climax
--------------------------------------------------------------------------------
Condition: Price at HTF midpoint level
+ Volume touching StdDev 3 band
+ Wave volume 2x+ previous wave
= MAJOR TURNING POINT
--------------------------------------------------------------------------------
💎 CONFLUENCE SETUP 3: Time Cycle + Volume Exhaustion
--------------------------------------------------------------------------------
Condition: Price at geometric time cycle vertical
+ Declining volume slope in current wave
+ Volume below StdDev 1 band
= TREND EXHAUSTION / REVERSAL ZONE
================================================================================
💎 PRO TRADING NOTES
================================================================================
🎯 VOLUME ANALYSIS HIERARCHY
1. StdDev Bands → Identify abnormal volume events
2. Wave Volume → Compare buying vs selling pressure
3. Volume Slope → Confirm trend strength or exhaustion
4. Color Classification → Quick visual assessment
--------------------------------------------------------------------------------
📊 VOLUME DIVERGENCE PATTERNS
--------------------------------------------------------------------------------
Price Higher High + Volume Lower High = BEARISH DIVERGENCE
→ Weakening buying pressure, potential top
Price Lower Low + Volume Lower Low = BULLISH DIVERGENCE
→ Weakening selling pressure, potential bottom
Price Flat + Volume Expanding = BREAKOUT IMMINENT
→ Accumulation or distribution complete
--------------------------------------------------------------------------------
🌊 WAVE VOLUME COMPARISONS
--------------------------------------------------------------------------------
Upwave Vol > Downwave Vol = BULLISH BIAS
→ Buyers more aggressive than sellers
Downwave Vol > Upwave Vol = BEARISH BIAS
→ Sellers more aggressive than buyers
Equal Wave Volumes = CONSOLIDATION
→ No clear winner, wait for breakout
--------------------------------------------------------------------------------
📈 VOLUME SLOPE STRATEGIES
--------------------------------------------------------------------------------
Rising Slope + Rising Price = STRONG TREND (ride it)
Falling Slope + Rising Price = EXHAUSTION (prepare exit)
Rising Slope + Falling Price = PANIC (look for bottom)
Falling Slope + Falling Price = WEAK SELLING (potential bounce)
================================================================================
🆘 TROUBLESHOOTING
================================================================================
Q: Volume bars not colored correctly?
A: - Check that volume data is available for your symbol
- Some indices don't have volume—use True Range option
- Adjust ratio thresholds if all bars are same color
Q: Wave volume labels not showing?
A: - Enable "Plot Wave Volume" in settings
- Check that wave colors are not transparent
- Reduce "Volume Scale Down Factor" if numbers are 0
Q: StdDev bands too wide/narrow?
A: - Adjust "Volume Std Dev Period" (higher = wider bands)
- Very volatile assets may need shorter period
- Stable assets may need longer period
Q: Volume slope not visible?
A: - Enable "Enable Volume Slope Analysis"
- Check slope line width is 2 or higher
- Ensure slope colors are not too transparent
Q: Different from main price chart volume?
A: - This indicator uses Wilder's MA (exponential smoothing)
- Built-in TradingView volume uses SMA
- Both are valid—this is more responsive
Q: Works on all markets?
A: - ✅ Crypto (24/7 volume)
- ✅ Stocks (regular hours volume)
- ✅ Futures (tick volume)
- ⚠️ Forex (tick volume, less reliable)
- ⚠️ Indices (may need True Range option)
Q: Best settings for scalping?
A: - Reduce MA Length to 10-14
- Lower StdDev Period to 14
- Use "Part of Price" method with value 100-200
Q: Best settings for swing trading?
A: - Increase MA Length to 30-50
- Higher StdDev Period to 30
- Use "ATR" method with value 20-30
================================================================================
📜 VERSION HISTORY
================================================================================
v1.0 (Current - January 2025)
✅ Volume classification system (6 levels)
✅ Wilder's Moving Average calculation
✅ Wave volume tracking with labels
✅ Renko-style direction detection
✅ Volume slope analysis (Simple & LinReg)
✅ Standard deviation bands (1, 2, 3 sigma)
✅ Customizable ratio thresholds
✅ Volume candle coloring option
✅ Multi-method direction detection
✅ Scale factor for large volume numbers
Planned v2.0
🔜 Volume profile integration
🔜 VWAP deviation bands
🔜 Volume-weighted wave analysis
🔜 Automated divergence detection
🔜 Volume alerts (climax, exhaustion)
================================================================================
🧠 THE SCIENCE BEHIND VOLUME ANALYSIS
================================================================================
Core Volume Principles Applied
1. Volume Precedes Price
→ Major moves are preceded by volume expansion
→ Climax volume marks turning points
2. Volume Confirms Trend
→ Healthy trends have rising volume in trend direction
→ Declining volume = weakening trend
3. Exhaustion Patterns
→ Ultra-high volume at extremes = capitulation
→ Low volume at extremes = no conviction
4. Wave Volume Comparison
→ Compare effort (volume) to result (price movement)
→ High effort + low result = potential reversal
5. Standard Deviation Context
→ Statistical framework for "abnormal" volume
→ 3 sigma events are rare and significant
WHY THIS WORKS
- Smart Money Footprint: Large players can't hide volume
- Confirmation Tool: Volume validates or invalidates price moves
- Early Warning: Volume divergences precede price reversals
- Universal: Same principles work across all markets
================================================================================
⚠️ RISK DISCLAIMER
================================================================================
This indicator is an EDUCATIONAL TOOL for volume analysis. It does NOT
guarantee profits. Markets involve substantial risk of loss.
- Volume analysis is ONE piece of the puzzle
- Always combine with price structure analysis
- Use proper position sizing (1-2% risk per trade)
- Backtest strategies before live trading
- No indicator is 100% accurate
================================================================================
🎓 LEARNING PATH
================================================================================
BEGINNER
1. Start with just the colored volume bars
2. Learn to identify Ultra High and Very High volume events
3. Notice how price reacts after volume spikes
4. Track wave volume to see buyer vs seller strength
INTERMEDIATE
5. Enable StdDev bands to quantify "abnormal" volume
6. Use volume slope to confirm trend strength
7. Compare wave volumes for bias direction
8. Look for volume divergences with price
ADVANCED
9. Combine with Geometric Trading System angles
10. Trade volume climax reversals at geometric levels
11. Use wave volume ratios for position sizing
12. Develop volume-based entry/exit rules
================================================================================
💬 FINAL WORDS FROM THE ARCHITECT
================================================================================
"Price tells you WHAT happened. Volume tells you WHO made it happen. When
smart money moves, volume reveals their footprint. Learn to read the
volume story, and you'll see the market's intentions before they unfold."
Volume is the fuel that drives price. Without volume, moves are suspect.
With volume, moves are confirmed. Master volume analysis, and you'll
trade with conviction.
================================================================================
📊 Volume is the Heartbeat of the Market
© 2025 AstroTrade_ | Invite-Only TradingView Script
================================================================================ Indicateur

Indicateur