
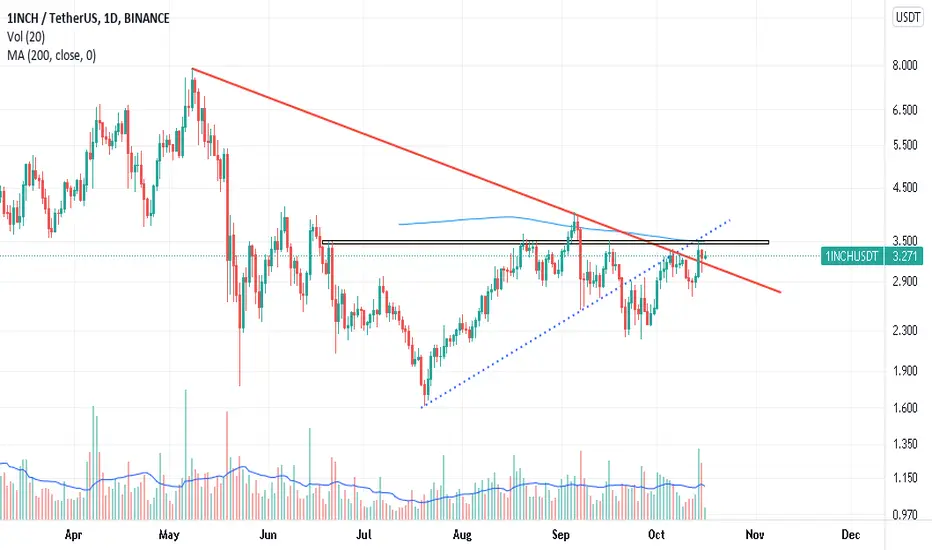
As you can see, according to the chart above, this digital currency after breaking its long-term dynamic resistance (red line), to the intersection of short-term dynamic resistance (blue dashed line that can be seen in the chart) and static resistance (orange area) and It also hit its $ 200 moving average resistance at $ 3.5 and failed to break it.
The recent short-term correction of this currency can be considered as a kind of pullback to the broken resistance and the absorption of momentum necessary to overcome the hard resistance of $ 3.5. A good entry point for the resistance is $ 3.5 and its high stabilization.
The recent short-term correction of this currency can be considered as a kind of pullback to the broken resistance and the absorption of momentum necessary to overcome the hard resistance of $ 3.5. A good entry point for the resistance is $ 3.5 and its high stabilization.

Pernyataan Penyangkalan
Informasi dan publikasi ini tidak dimaksudkan, dan bukan merupakan, saran atau rekomendasi keuangan, investasi, trading, atau jenis lainnya yang diberikan atau didukung oleh TradingView. Baca selengkapnya di Ketentuan Penggunaan.
Pernyataan Penyangkalan
Informasi dan publikasi ini tidak dimaksudkan, dan bukan merupakan, saran atau rekomendasi keuangan, investasi, trading, atau jenis lainnya yang diberikan atau didukung oleh TradingView. Baca selengkapnya di Ketentuan Penggunaan.