
Text me if you have any questions/comments for me.
-----
360
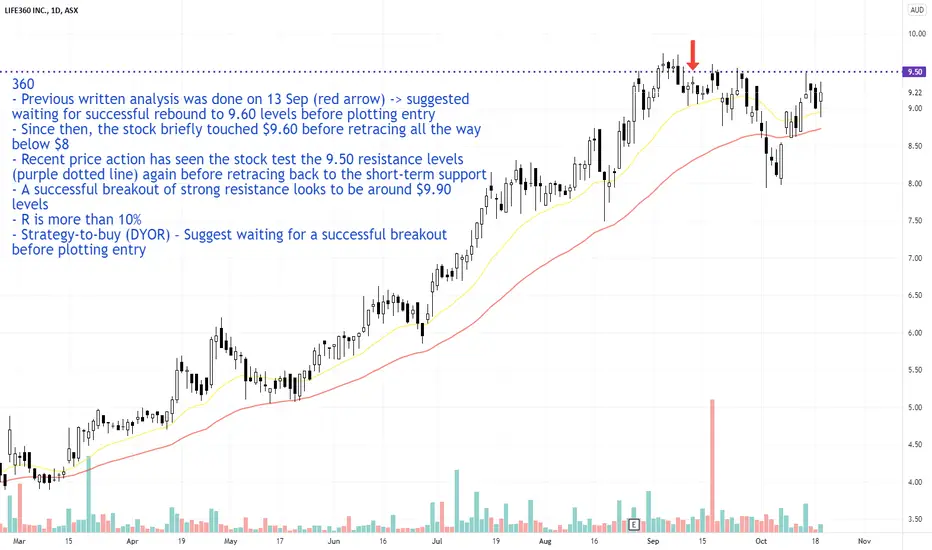
- Previous written analysis was done on 13 Sep (red arrow) -> suggested waiting for successful rebound to 9.60 levels before plotting entry
- Since then, the stock briefly touched $9.60 before retracing all the way below $8
- Recent price action has seen the stock test the 9.50 resistance levels (purple dotted line) again before retracing back to the short-term support
- A successful breakout of strong resistance looks to be around $9.90 levels
- R is more than 10%
- Strategy-to-buy (DYOR) – Suggest waiting for a successful breakout before plotting entry

Pernyataan Penyangkalan
Informasi dan publikasi ini tidak dimaksudkan, dan bukan merupakan, saran atau rekomendasi keuangan, investasi, trading, atau jenis lainnya yang diberikan atau didukung oleh TradingView. Baca selengkapnya di Ketentuan Penggunaan.
Pernyataan Penyangkalan
Informasi dan publikasi ini tidak dimaksudkan, dan bukan merupakan, saran atau rekomendasi keuangan, investasi, trading, atau jenis lainnya yang diberikan atau didukung oleh TradingView. Baca selengkapnya di Ketentuan Penggunaan.