
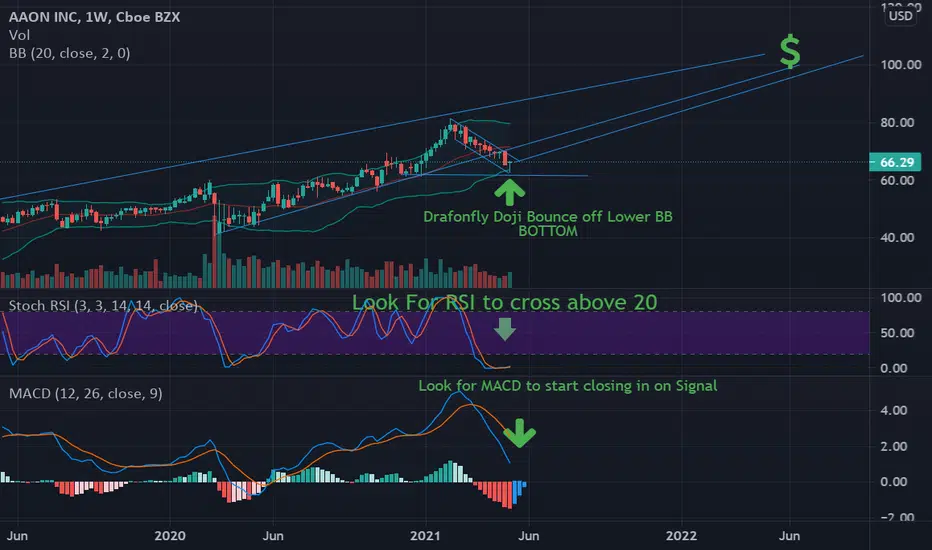
I see multiple indicators showing a bottom on the weekly chart.
1. The stock is in a solid uptrend.
2. Last candle is a green doji.
3. The current price is near a clear level of support.
4. The doji bounces off the Lower BB
5. Looking for MACD to start closing in on signal line
6. Looking for RSI STOCH to cross above 20 line.
If this thing turns around, this could be a wonderful opportunity for an Option trade!

Pernyataan Penyangkalan
Informasi dan publikasi ini tidak dimaksudkan, dan bukan merupakan, saran atau rekomendasi keuangan, investasi, trading, atau jenis lainnya yang diberikan atau didukung oleh TradingView. Baca selengkapnya di Ketentuan Penggunaan.
Pernyataan Penyangkalan
Informasi dan publikasi ini tidak dimaksudkan, dan bukan merupakan, saran atau rekomendasi keuangan, investasi, trading, atau jenis lainnya yang diberikan atau didukung oleh TradingView. Baca selengkapnya di Ketentuan Penggunaan.