
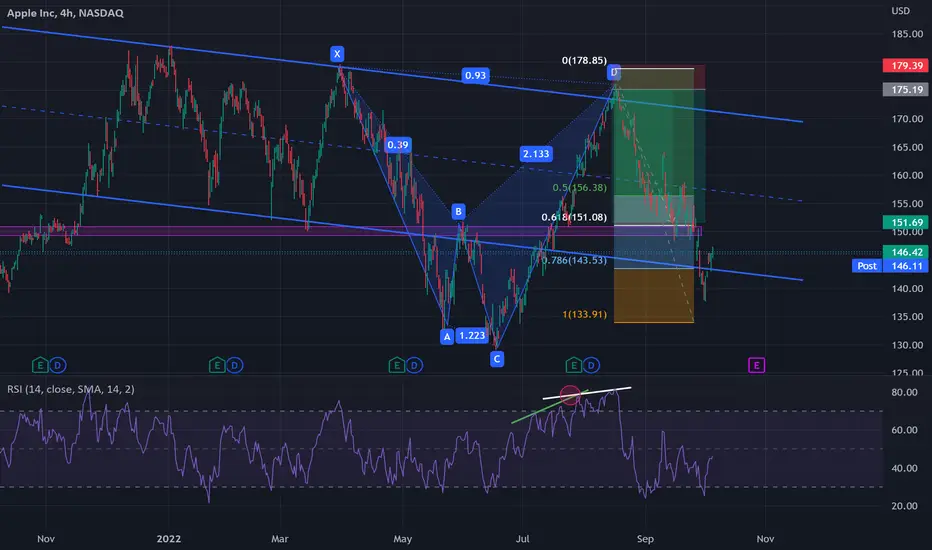
Here I took the trade for 3 reasons,
1 XABCD PATTERN
2 FIBONACCI level 0.618 is at the same level as strong support marked in purple on my chart which is where I set my take profit
3 the price was reaching the point D (the highest one) on the resistance of the descending channel existing since December.
4 RSI shows that the price is running out of steam, indicating a eventual drop
1 XABCD PATTERN
2 FIBONACCI level 0.618 is at the same level as strong support marked in purple on my chart which is where I set my take profit
3 the price was reaching the point D (the highest one) on the resistance of the descending channel existing since December.
4 RSI shows that the price is running out of steam, indicating a eventual drop

Pernyataan Penyangkalan
Informasi dan publikasi ini tidak dimaksudkan, dan bukan merupakan, saran atau rekomendasi keuangan, investasi, trading, atau jenis lainnya yang diberikan atau didukung oleh TradingView. Baca selengkapnya di Ketentuan Penggunaan.
Pernyataan Penyangkalan
Informasi dan publikasi ini tidak dimaksudkan, dan bukan merupakan, saran atau rekomendasi keuangan, investasi, trading, atau jenis lainnya yang diberikan atau didukung oleh TradingView. Baca selengkapnya di Ketentuan Penggunaan.