
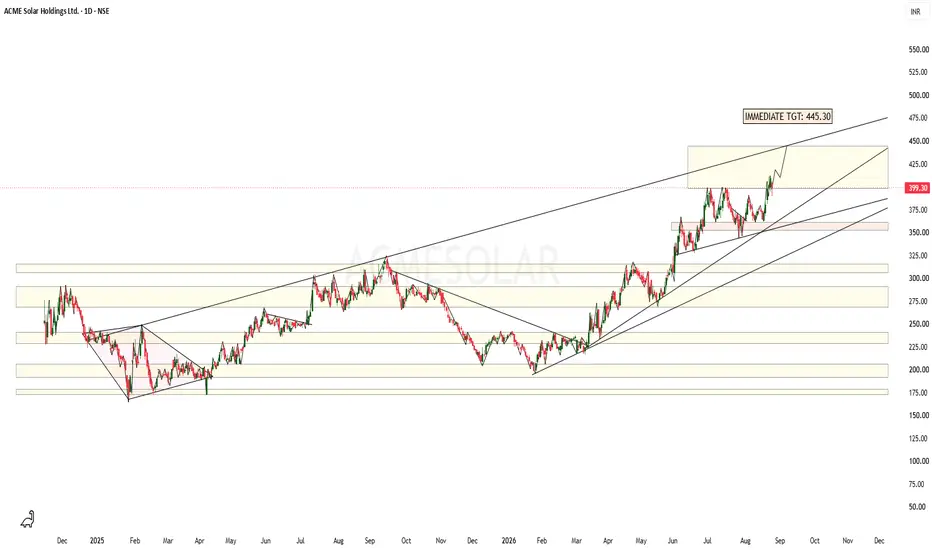
Presenting One More Chart Analysis after a Long time...
ACME SOLAR HOLDINGS LTD Chart is quite strong with Bullish View and looks promising at
CMP 399.30.
Patterns are drawn on Daily Chart and as usual complex & detailed drawing with Price Analysis is presented considering all the aspects of the chart.
Target & SL is as follows:
Tgt: 445.30
SL: 380-385 (Closing Basis)
Market is all about OPPORTUNITY / ENTRY / TIMING !!!!!
Basis some minute observations, chart analysis is made, target and SL is given to understand the core of the subject and for learning purpose only.
ACME SOLAR HOLDINGS LTD Chart is quite strong with Bullish View and looks promising at
CMP 399.30.
Patterns are drawn on Daily Chart and as usual complex & detailed drawing with Price Analysis is presented considering all the aspects of the chart.
Target & SL is as follows:
Tgt: 445.30
SL: 380-385 (Closing Basis)
Market is all about OPPORTUNITY / ENTRY / TIMING !!!!!
Basis some minute observations, chart analysis is made, target and SL is given to understand the core of the subject and for learning purpose only.

Pernyataan Penyangkalan
Informasi dan publikasi ini tidak dimaksudkan, dan bukan merupakan, saran atau rekomendasi keuangan, investasi, trading, atau jenis lainnya yang diberikan atau didukung oleh TradingView. Baca selengkapnya di Ketentuan Penggunaan.
Pernyataan Penyangkalan
Informasi dan publikasi ini tidak dimaksudkan, dan bukan merupakan, saran atau rekomendasi keuangan, investasi, trading, atau jenis lainnya yang diberikan atau didukung oleh TradingView. Baca selengkapnya di Ketentuan Penggunaan.