
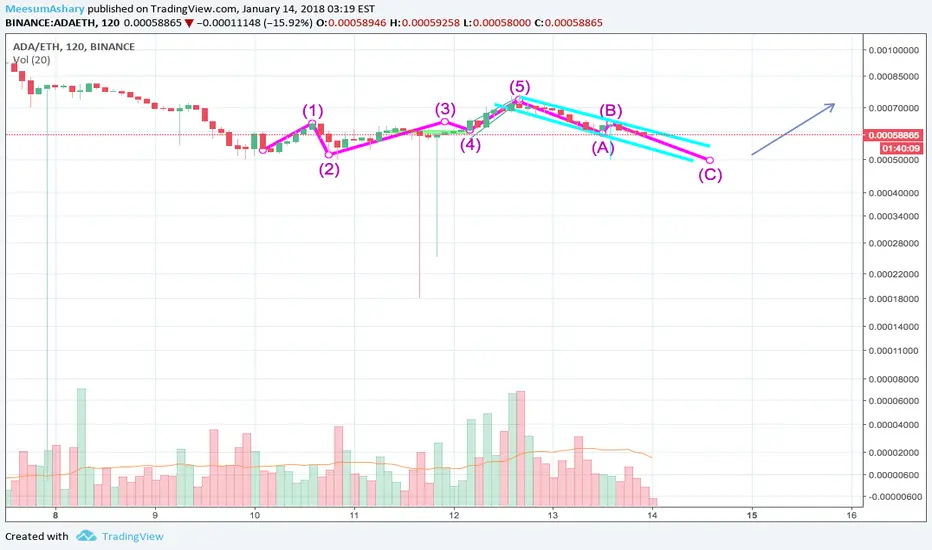
The Elliot Wave pattern shows that, after the ABC correction (Pink), prices will rise again for a while following a 1,2,3,4,5 Elliot wave.
The possible bullish trend is also confirmed by the flag pattern (Teal) seen around the ABC correction. We know that the flag pattern is a continuous pattern. This indicates that after the graph breaks out of the flag, it will resume its previous pattern. Which in this case, was a bullish trend.
Feel free to critique this analysis, as I am still fairly new to this.
The possible bullish trend is also confirmed by the flag pattern (Teal) seen around the ABC correction. We know that the flag pattern is a continuous pattern. This indicates that after the graph breaks out of the flag, it will resume its previous pattern. Which in this case, was a bullish trend.
Feel free to critique this analysis, as I am still fairly new to this.

Pernyataan Penyangkalan
Informasi dan publikasi ini tidak dimaksudkan, dan bukan merupakan, saran atau rekomendasi keuangan, investasi, trading, atau jenis lainnya yang diberikan atau didukung oleh TradingView. Baca selengkapnya di Ketentuan Penggunaan.
Pernyataan Penyangkalan
Informasi dan publikasi ini tidak dimaksudkan, dan bukan merupakan, saran atau rekomendasi keuangan, investasi, trading, atau jenis lainnya yang diberikan atau didukung oleh TradingView. Baca selengkapnya di Ketentuan Penggunaan.