
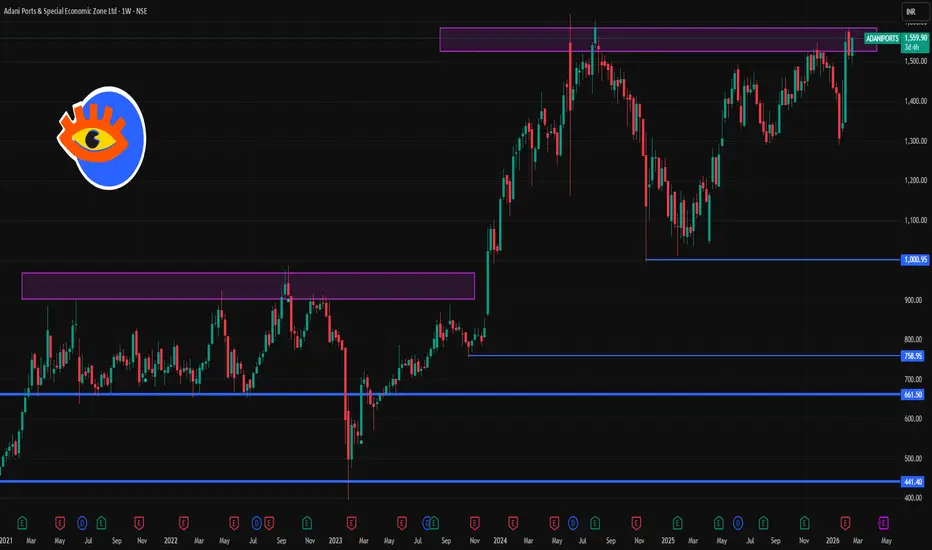
📌 Current Price (16-Feb-2026)
₹1,540.10 on NSE
📈 1-Week Technical Levels – Key Support & Resistance
🔹 Resistance Levels (Upside Targets)
These are levels where the stock may face selling pressure:
₹1,558 – ₹1,561 – near pivot/short-term resistance
₹1,577 – ₹1,608 – next resistance zone on weekly pivot calculations
~₹1,570 – short-term technical resistance per technical screens
🔻 Support Levels (Downside Floors)
These zones may act as short-term buying interest points:
~₹1,508 – ₹1,510 – immediate support zone
₹1,476 – ₹1,477 – secondary support zone
₹1,458 – ₹1,462 – another support level from pivot analysis
📊 Technical Indicators (Short Term)
Technical rating (1-week) suggests a buy trend prevailing – positive indicators from multiple short-term technical models.
RSI & MACD readings are generally neutral to mildly bullish in short timeframes.
Price is trading above key short-term moving averages indicating edge in upward momentum.
📊 Short-Term Trading Range Expectation
For the coming few sessions (1–5 trading days), traders often watch for moves around this approximate range:
⬆ Resistance: ~₹1,558 – ₹1,608
⬇ Support: ~₹1,476 – ₹1,508
Note: Levels aren’t precise promises — short-term price moves can be volatile, and broader market sentiment (like Sensex/Nifty moves) often impacts this stock.

Contact Knowledgehub for a detailed consultation: Dm on WhatsApp: [wa.link/a2o0kz]-
Phone No: [+91 93102 26243]-
Email: [tradingviewknowledgehub@gmail.com]---
-- Let’s achieve success together!
Phone No: [+91 93102 26243]-
Email: [tradingviewknowledgehub@gmail.com]---
-- Let’s achieve success together!
Publikasi terkait
Pernyataan Penyangkalan
Informasi dan publikasi ini tidak dimaksudkan, dan bukan merupakan, saran atau rekomendasi keuangan, investasi, trading, atau jenis lainnya yang diberikan atau didukung oleh TradingView. Baca selengkapnya di Ketentuan Penggunaan.