
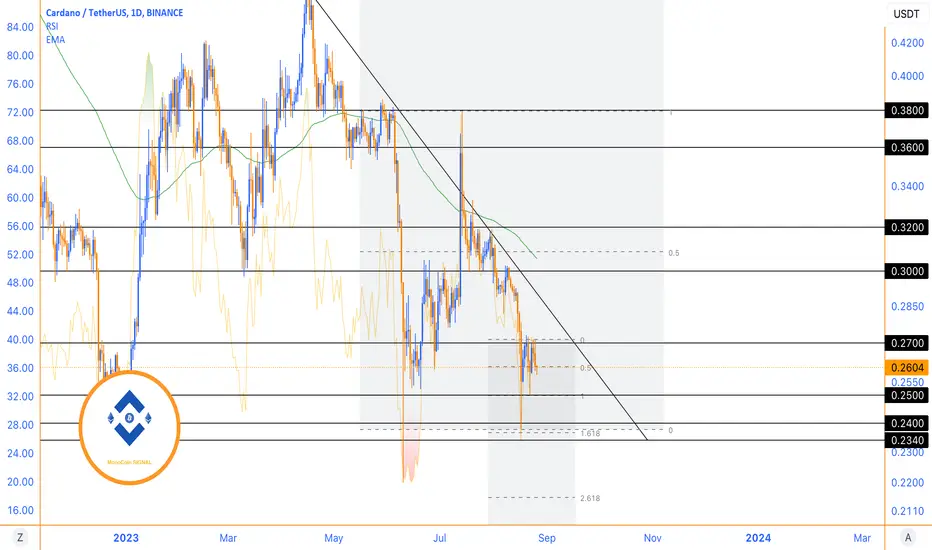
Cardano exhibited a consistent overall trend last week, which suggests the possibility of this trend persisting. The price range of Cardano shows it has been moving between a resistance level of $0.27 and a support level of $0.24. The chart's dynamic resistance remains robust, with buyers unable to breach it. This increases the likelihood of a potential test of the lower boundary of the price channel.
In the context of the 4-hour timeframe, buyers have made few attempts to overcome the previous peak during the downward trend. As a result, price ranges below $0.25 are seen as areas where significant market participants are active, aiming to preserve liquidity. This makes it highly probable that the price will reach these levels.
A more specific support area, known as a reaction zone, is identified around the $0.234 mark. It is anticipated that Cardano could experience a positive upswing from this zone, potentially reaching the upper boundary of the range channel.
In the context of the 4-hour timeframe, buyers have made few attempts to overcome the previous peak during the downward trend. As a result, price ranges below $0.25 are seen as areas where significant market participants are active, aiming to preserve liquidity. This makes it highly probable that the price will reach these levels.
A more specific support area, known as a reaction zone, is identified around the $0.234 mark. It is anticipated that Cardano could experience a positive upswing from this zone, potentially reaching the upper boundary of the range channel.

Join the free Telegram channel
💎 Telegram Channel: t.me/MonoCoin_Public
🔔 Bot: t.me/MonoCoinSignal_Bot?start=starter_tv
🌐 Website: MonoCoin.net
⭐️ 5-Star TrustPilot: trustpilot.com/review/monocoin.net
💎 Telegram Channel: t.me/MonoCoin_Public
🔔 Bot: t.me/MonoCoinSignal_Bot?start=starter_tv
🌐 Website: MonoCoin.net
⭐️ 5-Star TrustPilot: trustpilot.com/review/monocoin.net
Pernyataan Penyangkalan
Informasi dan publikasi ini tidak dimaksudkan, dan bukan merupakan, saran atau rekomendasi keuangan, investasi, trading, atau jenis lainnya yang diberikan atau didukung oleh TradingView. Baca selengkapnya di Ketentuan Penggunaan.
Join the free Telegram channel
💎 Telegram Channel: t.me/MonoCoin_Public
🔔 Bot: t.me/MonoCoinSignal_Bot?start=starter_tv
🌐 Website: MonoCoin.net
⭐️ 5-Star TrustPilot: trustpilot.com/review/monocoin.net
💎 Telegram Channel: t.me/MonoCoin_Public
🔔 Bot: t.me/MonoCoinSignal_Bot?start=starter_tv
🌐 Website: MonoCoin.net
⭐️ 5-Star TrustPilot: trustpilot.com/review/monocoin.net
Pernyataan Penyangkalan
Informasi dan publikasi ini tidak dimaksudkan, dan bukan merupakan, saran atau rekomendasi keuangan, investasi, trading, atau jenis lainnya yang diberikan atau didukung oleh TradingView. Baca selengkapnya di Ketentuan Penggunaan.