
📈 AROENTER — Technical Structure Analysis
Chart Visual & Pattern Layout: ChartsSpecialist (via TradingView)
🔍 Technical Observations
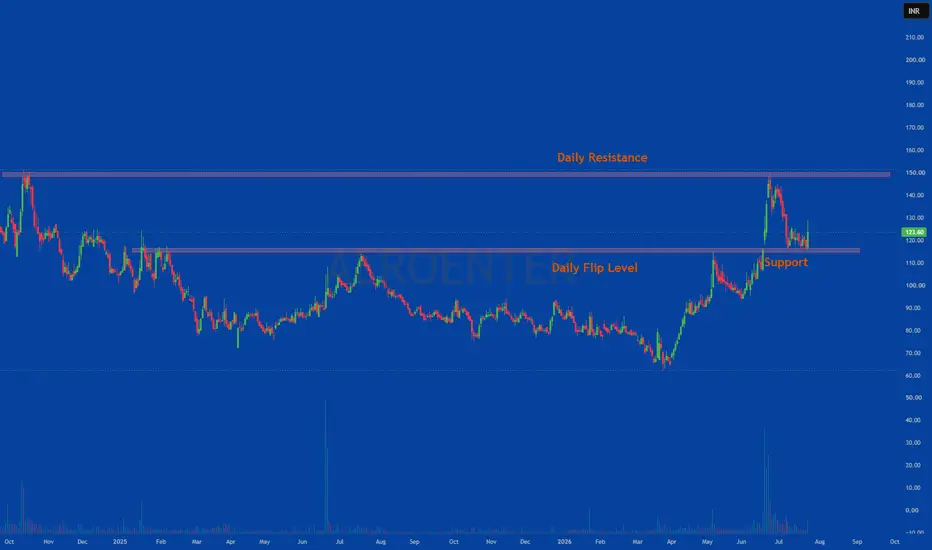
Role Reversal (Support Become Resistance / Flip Levels): The chart features two distinct horizontal bands annotated as "Daily Flip Level."
Breakout & Retest at Lower Flip Zone: The lower highlighted channel previously served as a strong multi-month horizontal resistance zone. Following a decisive breakout, price retraced back to this exact level, validating it as new support ("Support").
Upper Supply Rejection: Upon bouncing off the lower support flip level, price rallied sharply to test a higher historical "Daily Flip Level," where it encountered supply and experienced a short-term pullback.
📚 Technical Analysis Concepts Demonstrated
Polarity Principle / Flip Levels: Observing how broken horizontal resistance levels invert to function as prospective support levels on subsequent retests.
Range-Bound Wave Structure: Mapping structural swing points across primary horizontal demand and supply channels.
Price Acceleration vs. Compression: Tracking multi-month consolidation cycles transitioning into rapid vertical expansion and subsequent retracements.
📌 SEBI Compliant Educational Disclaimer
Regulatory Disclaimer & Disclosures:
Educational Purpose Only: This post analyzes chart patterns and technical concepts strictly for learning and educational purposes.
No Recommendation: This content does NOT contain target levels, stop-loss triggers, entry calls, or buy/sell/hold recommendations.
SEBI Registration Status: ChartsSpecialist and the publisher are NOT SEBI-registered Research Analysts or Investment Advisors.
Risk Warning: Securities trading involves market risk. Past patterns do not guarantee future price movements. Please consult a qualified SEBI-registered financial advisor before taking any market positions.
#ChartsSpecialist #AROENTER #TechnicalAnalysis #ChartReading #StockMarketEducation #SEBICompliant #PriceAction #TradingView #FinancialLiteracy #NSE #SupportAndResistance #FlipLevels
Chart Visual & Pattern Layout: ChartsSpecialist (via TradingView)
🔍 Technical Observations
Role Reversal (Support Become Resistance / Flip Levels): The chart features two distinct horizontal bands annotated as "Daily Flip Level."
Breakout & Retest at Lower Flip Zone: The lower highlighted channel previously served as a strong multi-month horizontal resistance zone. Following a decisive breakout, price retraced back to this exact level, validating it as new support ("Support").
Upper Supply Rejection: Upon bouncing off the lower support flip level, price rallied sharply to test a higher historical "Daily Flip Level," where it encountered supply and experienced a short-term pullback.
📚 Technical Analysis Concepts Demonstrated
Polarity Principle / Flip Levels: Observing how broken horizontal resistance levels invert to function as prospective support levels on subsequent retests.
Range-Bound Wave Structure: Mapping structural swing points across primary horizontal demand and supply channels.
Price Acceleration vs. Compression: Tracking multi-month consolidation cycles transitioning into rapid vertical expansion and subsequent retracements.
📌 SEBI Compliant Educational Disclaimer
Regulatory Disclaimer & Disclosures:
Educational Purpose Only: This post analyzes chart patterns and technical concepts strictly for learning and educational purposes.
No Recommendation: This content does NOT contain target levels, stop-loss triggers, entry calls, or buy/sell/hold recommendations.
SEBI Registration Status: ChartsSpecialist and the publisher are NOT SEBI-registered Research Analysts or Investment Advisors.
Risk Warning: Securities trading involves market risk. Past patterns do not guarantee future price movements. Please consult a qualified SEBI-registered financial advisor before taking any market positions.
#ChartsSpecialist #AROENTER #TechnicalAnalysis #ChartReading #StockMarketEducation #SEBICompliant #PriceAction #TradingView #FinancialLiteracy #NSE #SupportAndResistance #FlipLevels

Pernyataan Penyangkalan
Informasi dan publikasi ini tidak dimaksudkan, dan bukan merupakan, saran atau rekomendasi keuangan, investasi, trading, atau jenis lainnya yang diberikan atau didukung oleh TradingView. Baca selengkapnya di Ketentuan Penggunaan.
Pernyataan Penyangkalan
Informasi dan publikasi ini tidak dimaksudkan, dan bukan merupakan, saran atau rekomendasi keuangan, investasi, trading, atau jenis lainnya yang diberikan atau didukung oleh TradingView. Baca selengkapnya di Ketentuan Penggunaan.