
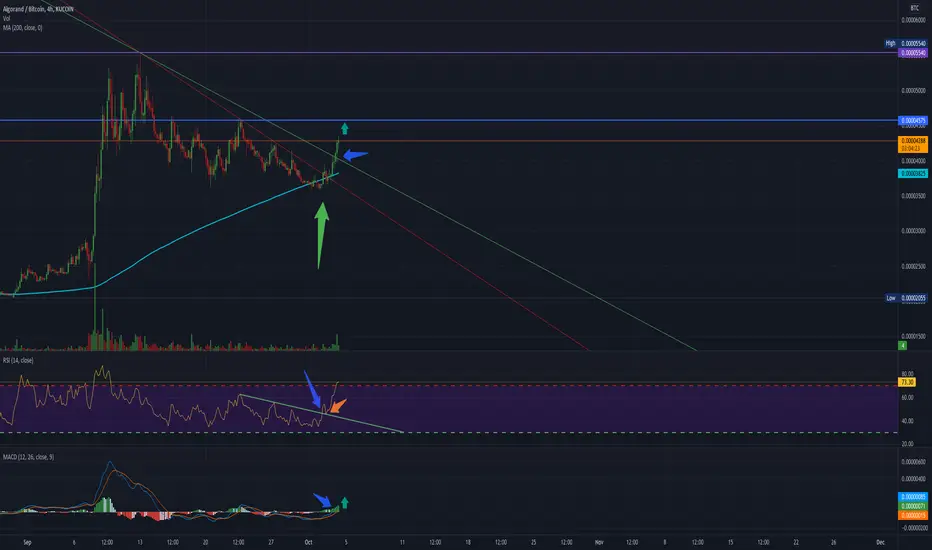
Here is a quick analysis of the ALGO/BTC chart pumping.
Next targets are resistances marked in horizontal ray blue at 4575 sats & purple at 5540 sats per ALGO coin.
Big green arrow shows how the trend tested the 200 MA and bounced off of it making to break the downtrend channel that was created.
RSI indicator shows how once the downtrend was broken (blue small arrow), it backtested before mooning (orange small arrow).
MACD Showing how positive momentum is building up... :)
Catatan
LOLOLOLOL
Pernyataan Penyangkalan
Informasi dan publikasi ini tidak dimaksudkan, dan bukan merupakan, saran atau rekomendasi keuangan, investasi, trading, atau jenis lainnya yang diberikan atau didukung oleh TradingView. Baca selengkapnya di Ketentuan Penggunaan.
Pernyataan Penyangkalan
Informasi dan publikasi ini tidak dimaksudkan, dan bukan merupakan, saran atau rekomendasi keuangan, investasi, trading, atau jenis lainnya yang diberikan atau didukung oleh TradingView. Baca selengkapnya di Ketentuan Penggunaan.