
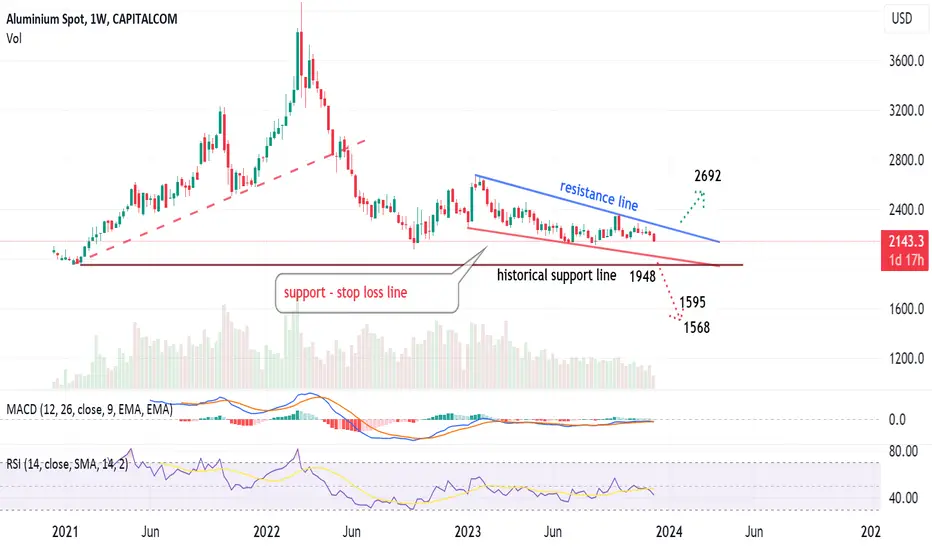
Weekly chart, Aluminum is showing negative indicators RSI and MACD. It seems the price is testing down the support line, then -may be- the historical support line.
Below that level, price can easily go to 1595 and 1568
Above resistance, the target is 2692
Below that level, price can easily go to 1595 and 1568
Above resistance, the target is 2692
Trade aktif
Aluminium price crossed the resistance line upwards, and activated the target
Pernyataan Penyangkalan
Informasi dan publikasi ini tidak dimaksudkan, dan bukan merupakan, saran atau rekomendasi keuangan, investasi, trading, atau jenis lainnya yang diberikan atau didukung oleh TradingView. Baca selengkapnya di Ketentuan Penggunaan.
Pernyataan Penyangkalan
Informasi dan publikasi ini tidak dimaksudkan, dan bukan merupakan, saran atau rekomendasi keuangan, investasi, trading, atau jenis lainnya yang diberikan atau didukung oleh TradingView. Baca selengkapnya di Ketentuan Penggunaan.