
1. The Macro Perspective: The Multi-Year Accumulation Phase
I am taking a LONG bias on Astra Microwave Products Limited (ASTRAMICRO) on the weekly (1W) timeframe.
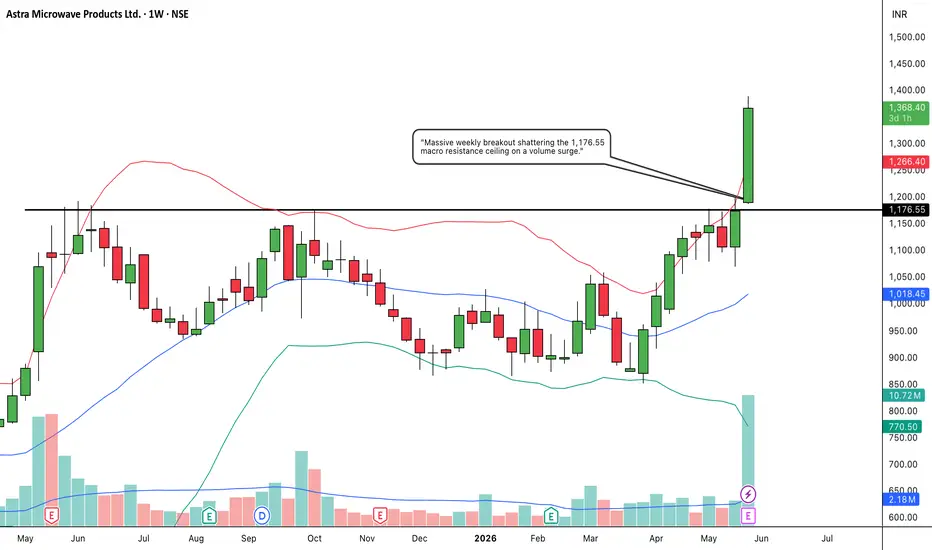
When analyzing pure market structure, the most powerful and sustainable trends are born from prolonged high-level consolidation patterns. Looking at the structural development in Screenshot 2026-05-26 at 14.35.15.jpg, the stock has spent roughly a year building a massive macro base. After a previous secular markup phase that topped out in mid-2025, the price entered a broad accumulation and digestion cycle. Sellers repeatedly defended the overhead ceiling, shaking out impatient retail traders, while strong-handed institutional portfolios quietly absorbed the floating supply at progressively higher structural support levels.
2. The Educational Setup: Dynamic Support and Volatility Compression
To understand the technical validity behind this macro launch, we look at the interaction between horizontal levels and dynamic indicators:
The Major Neckline Ceiling: The critical overhead barrier is marked by the solid black horizontal line at 1,176.55. This level represents the absolute peak of historical supply where major selling pressure previously capped every attempt at upward continuation.
The 20 SMA Springboard: Notice how the price action behaved during the corrective phases across late 2025 and early 2026. The stock consistently found heavy institutional defense near the rising weekly 20 SMA (the middle blue line of your Bollinger Bands, currently sitting at 1,019.32). By establishing a rock-solid structural floor here and compressing tightly right below the 1,176.55 resistance, the asset formed a perfectly coiled springboard. Volatility compression of this scale on a weekly timeframe always precedes an explosive expansion phase.
3. Current Price Action: Entering Pure Price Discovery
Look at the most recent weekly candle on the far right of the chart. The technical pressure cooker has officially blown its lid off. Institutional buyers have stepped in with massive conviction, printing an absolute powerhouse of a green weekly expansion candle that has vaulted the stock up to 1,385.70 (+17.94%). This vertical thrust has completely decimated the 1,176.55 multi-year ceiling on an unmistakable institutional volume surge (the towering volume bar below). The price has violently pierced and is riding entirely outside the upper Bollinger Band, snapping the bands wide open. By clearing this massive consolidation block, ASTRAMICRO has officially entered uncharted "Blue Sky Territory" where all historical overhead supply is gone.
4. The Trade Plan: Entries, Targets, and Risk Management
Entry Strategy: Macro momentum is exceptionally strong with the stock trading at 1,385.70. Chasing a vertical weekly candle that closes entirely outside the upper Bollinger Band carries an inherent risk of a short-term, lower-timeframe mean-reversion pullback. The highest-probability, lowest-risk entry strategy involves waiting for the initial vertical excitement to settle. Look to scale into long positions or place limit orders to catch a potential structural pullback to perfectly retest the 1,175.00 to 1,220.00 broken resistance zone. Letting old historical resistance prove itself as concrete new support provides an unmatched risk-to-reward ratio.
Take Profit (Targets): Because the stock is breaking out of a massive multi-year base into pure price discovery, we use a classical measured move strategy based on the depth of the consolidation structure. Projecting the depth of this macro base upward from the breakout point targets a primary structural macro zone between 1,480.00 and 1,520.00. The ultimate psychological milestone of 1,500.00 will act as a powerful macro magnet.
Invalidation (Stop Loss): An explosive breakout thesis is completely invalidated if the asset fails to hold its newly claimed floor and collapses back inside the base boundaries. A hard stop loss should be placed safely below the rising weekly 20 SMA cushion, around the 980.00 to 1,020.00 level. A definitive weekly close completely back below 950 would act as a severe warning sign of a failed macro breakout and a major bull trap.
5. Time Horizon:
Because this technical setup is engineered on a 1-Week chart capturing a massive structural phase transition and an ultimate lifetime high breakout, this is a longer-term position trade designed to capture a secular markup trend over the coming months. Let the macro trend run!
I am taking a LONG bias on Astra Microwave Products Limited (ASTRAMICRO) on the weekly (1W) timeframe.
When analyzing pure market structure, the most powerful and sustainable trends are born from prolonged high-level consolidation patterns. Looking at the structural development in Screenshot 2026-05-26 at 14.35.15.jpg, the stock has spent roughly a year building a massive macro base. After a previous secular markup phase that topped out in mid-2025, the price entered a broad accumulation and digestion cycle. Sellers repeatedly defended the overhead ceiling, shaking out impatient retail traders, while strong-handed institutional portfolios quietly absorbed the floating supply at progressively higher structural support levels.
2. The Educational Setup: Dynamic Support and Volatility Compression
To understand the technical validity behind this macro launch, we look at the interaction between horizontal levels and dynamic indicators:
The Major Neckline Ceiling: The critical overhead barrier is marked by the solid black horizontal line at 1,176.55. This level represents the absolute peak of historical supply where major selling pressure previously capped every attempt at upward continuation.
The 20 SMA Springboard: Notice how the price action behaved during the corrective phases across late 2025 and early 2026. The stock consistently found heavy institutional defense near the rising weekly 20 SMA (the middle blue line of your Bollinger Bands, currently sitting at 1,019.32). By establishing a rock-solid structural floor here and compressing tightly right below the 1,176.55 resistance, the asset formed a perfectly coiled springboard. Volatility compression of this scale on a weekly timeframe always precedes an explosive expansion phase.
3. Current Price Action: Entering Pure Price Discovery
Look at the most recent weekly candle on the far right of the chart. The technical pressure cooker has officially blown its lid off. Institutional buyers have stepped in with massive conviction, printing an absolute powerhouse of a green weekly expansion candle that has vaulted the stock up to 1,385.70 (+17.94%). This vertical thrust has completely decimated the 1,176.55 multi-year ceiling on an unmistakable institutional volume surge (the towering volume bar below). The price has violently pierced and is riding entirely outside the upper Bollinger Band, snapping the bands wide open. By clearing this massive consolidation block, ASTRAMICRO has officially entered uncharted "Blue Sky Territory" where all historical overhead supply is gone.
4. The Trade Plan: Entries, Targets, and Risk Management
Entry Strategy: Macro momentum is exceptionally strong with the stock trading at 1,385.70. Chasing a vertical weekly candle that closes entirely outside the upper Bollinger Band carries an inherent risk of a short-term, lower-timeframe mean-reversion pullback. The highest-probability, lowest-risk entry strategy involves waiting for the initial vertical excitement to settle. Look to scale into long positions or place limit orders to catch a potential structural pullback to perfectly retest the 1,175.00 to 1,220.00 broken resistance zone. Letting old historical resistance prove itself as concrete new support provides an unmatched risk-to-reward ratio.
Take Profit (Targets): Because the stock is breaking out of a massive multi-year base into pure price discovery, we use a classical measured move strategy based on the depth of the consolidation structure. Projecting the depth of this macro base upward from the breakout point targets a primary structural macro zone between 1,480.00 and 1,520.00. The ultimate psychological milestone of 1,500.00 will act as a powerful macro magnet.
Invalidation (Stop Loss): An explosive breakout thesis is completely invalidated if the asset fails to hold its newly claimed floor and collapses back inside the base boundaries. A hard stop loss should be placed safely below the rising weekly 20 SMA cushion, around the 980.00 to 1,020.00 level. A definitive weekly close completely back below 950 would act as a severe warning sign of a failed macro breakout and a major bull trap.
5. Time Horizon:
Because this technical setup is engineered on a 1-Week chart capturing a massive structural phase transition and an ultimate lifetime high breakout, this is a longer-term position trade designed to capture a secular markup trend over the coming months. Let the macro trend run!
Trade aktif
After successfull breakout price is consolidatingPrice reached a fresh all time high of 1433

Pernyataan Penyangkalan
Informasi dan publikasi ini tidak dimaksudkan, dan bukan merupakan, saran atau rekomendasi keuangan, investasi, trading, atau jenis lainnya yang diberikan atau didukung oleh TradingView. Baca selengkapnya di Ketentuan Penggunaan.
Pernyataan Penyangkalan
Informasi dan publikasi ini tidak dimaksudkan, dan bukan merupakan, saran atau rekomendasi keuangan, investasi, trading, atau jenis lainnya yang diberikan atau didukung oleh TradingView. Baca selengkapnya di Ketentuan Penggunaan.