
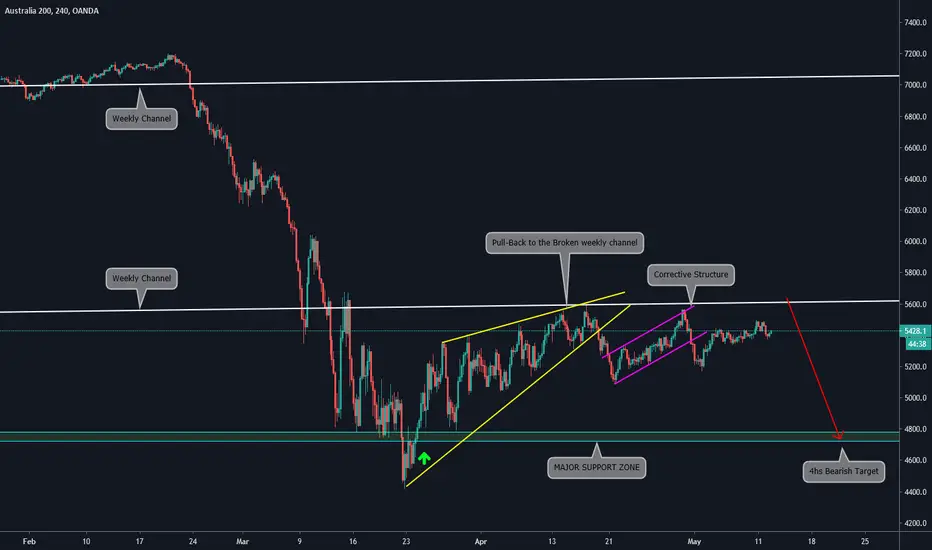
Main items we can see on the 4HS chart:
a)From the Historical Higher High at 7200 the price made a bearish movement and found support at 4800
b)From there we observed a bullish movement towards the Broken ascending trendlines of the previous ascending motive waves
c)The structure that we can see is a Wedge Pattern doing a pullback to the previous ascending trendline
d)We saw a breakout of the wedge pattern and a corrective structure next to it
e)Our Forecast is that there is a major resistance zone at 5600 -5650 and we will expect a bearish movement towards 4700-4800
WEEKLY CHART:

Pernyataan Penyangkalan
Informasi dan publikasi ini tidak dimaksudkan, dan bukan merupakan, saran atau rekomendasi keuangan, investasi, trading, atau jenis lainnya yang diberikan atau didukung oleh TradingView. Baca selengkapnya di Ketentuan Penggunaan.
Pernyataan Penyangkalan
Informasi dan publikasi ini tidak dimaksudkan, dan bukan merupakan, saran atau rekomendasi keuangan, investasi, trading, atau jenis lainnya yang diberikan atau didukung oleh TradingView. Baca selengkapnya di Ketentuan Penggunaan.