

Continuation of previous post :
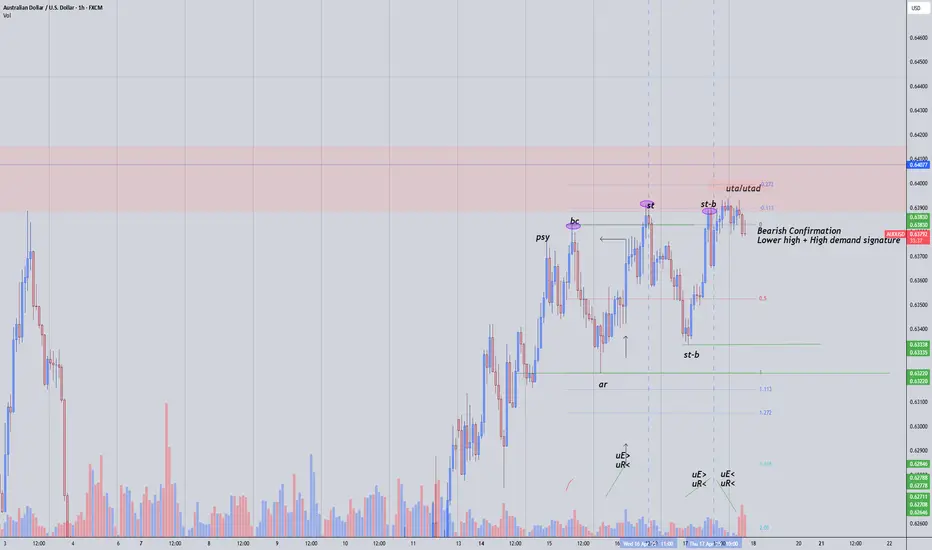
1H Range starts off this schematic by stopping the momentum at the point of the first secondary test, it fails to break the previous high and this markets goes from moving up to sideways into this TR. Each rally to previous highs reflects upside effort increasing, but upside result is decreasing indicating buyers weakness near this level. uE>, uR< = bearish indicator.
Favorable bearish confirmation would be a lower high, paired with high buy volume confirming the shift to bearish market.
1H Range starts off this schematic by stopping the momentum at the point of the first secondary test, it fails to break the previous high and this markets goes from moving up to sideways into this TR. Each rally to previous highs reflects upside effort increasing, but upside result is decreasing indicating buyers weakness near this level. uE>, uR< = bearish indicator.
Favorable bearish confirmation would be a lower high, paired with high buy volume confirming the shift to bearish market.

Pernyataan Penyangkalan
Informasi dan publikasi ini tidak dimaksudkan, dan bukan merupakan, saran atau rekomendasi keuangan, investasi, trading, atau jenis lainnya yang diberikan atau didukung oleh TradingView. Baca selengkapnya di Ketentuan Penggunaan.
Pernyataan Penyangkalan
Informasi dan publikasi ini tidak dimaksudkan, dan bukan merupakan, saran atau rekomendasi keuangan, investasi, trading, atau jenis lainnya yang diberikan atau didukung oleh TradingView. Baca selengkapnya di Ketentuan Penggunaan.