
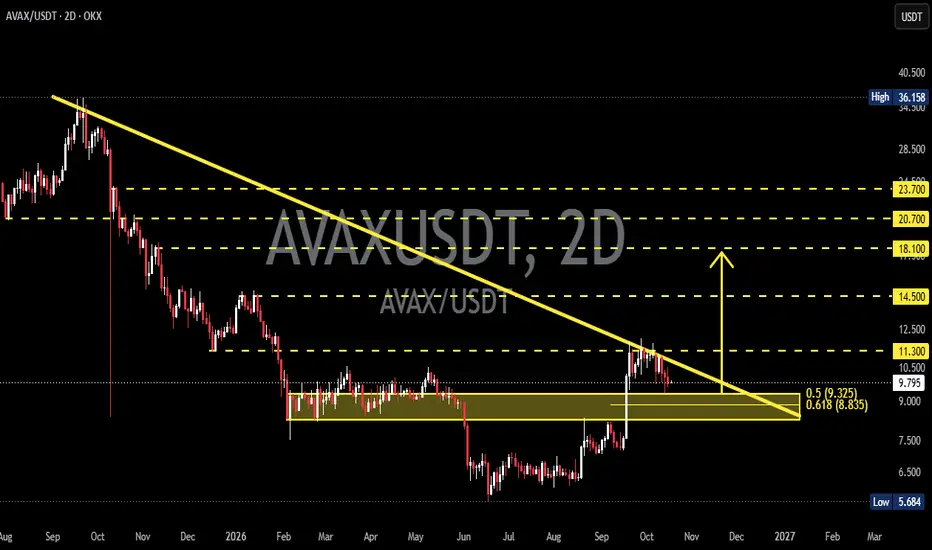
AVAX continues to trade below a Descending Trendline, indicating that the medium-term downtrend remains a major challenge for buyers. This trendline has repeatedly limited price movements and could continue to act as dynamic resistance.
However, after forming a low around $5.68, the price began to recover and climbed toward $11.30 before facing renewed selling pressure.
This development opens the possibility of a momentum shift, although confirmation of a trend reversal is still needed.
🟨 Key Support Zone: $8.30–$9.30
The yellow block represents an important support area that previously served as a price consolidation zone between February and May. This area could attract renewed buying interest if the price experiences a pullback.
AVAX is currently trading around $9.77, making a retest of the $8.30–$9.30 zone one of the key scenarios to watch before a potential continuation to the upside.
If the price retests this zone and holds above it, accompanied by a strong bullish reaction, the probability of a rebound could increase. Conversely, a decisive break below support could open the door to further downside.
## 🟢 Bullish Scenario
AVAX could extend its recovery if the $8.30–$9.30 support zone holds.
📌 Key developments to watch:
1. Price pulls back toward the $8.30–$9.30 support block.
2. Buyers defend the zone and generate a bullish reaction.
3. Price moves higher again and breaks above the $11.30 resistance.
4. A breakout above the Descending Trendline strengthens the potential for a trend reversal.
🎯 Potential upside targets:
- $11.30 — Immediate resistance.
- $14.50 — Next resistance target.
- $18.10 — Further upside target if bullish momentum strengthens.
- $20.70–$23.70 — Higher resistance zone in a stronger recovery scenario.
⚠️ These targets represent potential price levels, not guaranteed outcomes. Breakout confirmation and trading volume should be monitored closely.
## 🔴 Bearish Scenario
Bearish risks remain as long as the price fails to break above and sustain its position beyond the Descending Trendline.
📌 Key developments to watch:
1. Price fails to break above the dynamic resistance of the Descending Trendline.
2. Selling pressure increases, pushing the price back toward $9.30.
3. Price breaks below the $8.30–$9.30 support block.
4. If a confirmed breakdown occurs, the former support zone could turn into resistance.
🎯 Potential downside levels:
- $8.30 — Lower boundary of the support block.
- $7.50 — Historical price area to monitor.
- $6.50 — Consolidation area before the previous decline.
- $5.68 — Major swing low on the chart.
A 2D candle close below $8.30, particularly if accompanied by increasing selling volume, would strengthen the risk of further downside.
## 🔍 Conclusion
AVAX is approaching a critical phase after recovering from its low near $5.68. Although the price has rallied toward $11.30, the Descending Trendline remains a major obstacle to a stronger trend reversal.
💡 The primary scenario to watch is a retest of the $8.30–$9.30 support zone before the next potential upward move.
If support holds and the price regains bullish momentum, AVAX could retest $11.30, followed by $14.50 and $18.10.
However, if support breaks down, the bullish scenario would weaken, and a retest of lower price levels would become a risk to consider.
⏳ Confirmation remains key. Monitor the price reaction within the yellow support block, a potential breakout above the Descending Trendline, and trading volume before making any trading decisions.
⚠️ This analysis is for educational purposes only and does not constitute financial advice. Always conduct your own research (DYOR) and manage your risk responsibly.
#AVAX #AVAXUSDT #Avalanche
However, after forming a low around $5.68, the price began to recover and climbed toward $11.30 before facing renewed selling pressure.
This development opens the possibility of a momentum shift, although confirmation of a trend reversal is still needed.
🟨 Key Support Zone: $8.30–$9.30
The yellow block represents an important support area that previously served as a price consolidation zone between February and May. This area could attract renewed buying interest if the price experiences a pullback.
AVAX is currently trading around $9.77, making a retest of the $8.30–$9.30 zone one of the key scenarios to watch before a potential continuation to the upside.
If the price retests this zone and holds above it, accompanied by a strong bullish reaction, the probability of a rebound could increase. Conversely, a decisive break below support could open the door to further downside.
## 🟢 Bullish Scenario
AVAX could extend its recovery if the $8.30–$9.30 support zone holds.
📌 Key developments to watch:
1. Price pulls back toward the $8.30–$9.30 support block.
2. Buyers defend the zone and generate a bullish reaction.
3. Price moves higher again and breaks above the $11.30 resistance.
4. A breakout above the Descending Trendline strengthens the potential for a trend reversal.
🎯 Potential upside targets:
- $11.30 — Immediate resistance.
- $14.50 — Next resistance target.
- $18.10 — Further upside target if bullish momentum strengthens.
- $20.70–$23.70 — Higher resistance zone in a stronger recovery scenario.
⚠️ These targets represent potential price levels, not guaranteed outcomes. Breakout confirmation and trading volume should be monitored closely.
## 🔴 Bearish Scenario
Bearish risks remain as long as the price fails to break above and sustain its position beyond the Descending Trendline.
📌 Key developments to watch:
1. Price fails to break above the dynamic resistance of the Descending Trendline.
2. Selling pressure increases, pushing the price back toward $9.30.
3. Price breaks below the $8.30–$9.30 support block.
4. If a confirmed breakdown occurs, the former support zone could turn into resistance.
🎯 Potential downside levels:
- $8.30 — Lower boundary of the support block.
- $7.50 — Historical price area to monitor.
- $6.50 — Consolidation area before the previous decline.
- $5.68 — Major swing low on the chart.
A 2D candle close below $8.30, particularly if accompanied by increasing selling volume, would strengthen the risk of further downside.
## 🔍 Conclusion
AVAX is approaching a critical phase after recovering from its low near $5.68. Although the price has rallied toward $11.30, the Descending Trendline remains a major obstacle to a stronger trend reversal.
💡 The primary scenario to watch is a retest of the $8.30–$9.30 support zone before the next potential upward move.
If support holds and the price regains bullish momentum, AVAX could retest $11.30, followed by $14.50 and $18.10.
However, if support breaks down, the bullish scenario would weaken, and a retest of lower price levels would become a risk to consider.
⏳ Confirmation remains key. Monitor the price reaction within the yellow support block, a potential breakout above the Descending Trendline, and trading volume before making any trading decisions.
⚠️ This analysis is for educational purposes only and does not constitute financial advice. Always conduct your own research (DYOR) and manage your risk responsibly.
#AVAX #AVAXUSDT #Avalanche

✅ Get Free Signals! Join Our Telegram Channel Here: t.me/TheCryptoNuclear
✅ Twitter: twitter.com/crypto_nuclear
✅ Join Bybit : partner.bybit.com/b/nuclearvip
✅ Benefits : Lifetime Trading Fee Discount -50%
✅ Twitter: twitter.com/crypto_nuclear
✅ Join Bybit : partner.bybit.com/b/nuclearvip
✅ Benefits : Lifetime Trading Fee Discount -50%
Pernyataan Penyangkalan
Informasi dan publikasi ini tidak dimaksudkan, dan bukan merupakan, saran atau rekomendasi keuangan, investasi, trading, atau jenis lainnya yang diberikan atau didukung oleh TradingView. Baca selengkapnya di Ketentuan Penggunaan.
✅ Get Free Signals! Join Our Telegram Channel Here: t.me/TheCryptoNuclear
✅ Twitter: twitter.com/crypto_nuclear
✅ Join Bybit : partner.bybit.com/b/nuclearvip
✅ Benefits : Lifetime Trading Fee Discount -50%
✅ Twitter: twitter.com/crypto_nuclear
✅ Join Bybit : partner.bybit.com/b/nuclearvip
✅ Benefits : Lifetime Trading Fee Discount -50%
Pernyataan Penyangkalan
Informasi dan publikasi ini tidak dimaksudkan, dan bukan merupakan, saran atau rekomendasi keuangan, investasi, trading, atau jenis lainnya yang diberikan atau didukung oleh TradingView. Baca selengkapnya di Ketentuan Penggunaan.