
Disclaimer:
This analysis is for educational purposes only. I am not a SEBI-registered advisor. This is not financial advice.
Symbol: AXISBANK (NSE)
Date Observed: 18 August 2023
Time Frame: 15-Minute Chart
Study Used: Gann Square of 9 (Normal Price Capacity)
This idea shares a historical intraday observation where Axis Bank’s price movement stayed within a normal Square of 9 price range, followed by a visible reaction after price–time alignment.
📊 Market Context & Reference Selection
🔢 Square of 9 Levels Observed
⏱️ Observed Price–Time Behavior
📘 Educational Takeaways
📌 Shared strictly for educational and historical chart-study purposes.
#AxisBank #GannSquareOf9 #WDGann #IntradayAnalysis #MarketEducation #PriceTime #TechnicalAnalysis #RuleBasedStudy
This analysis is for educational purposes only. I am not a SEBI-registered advisor. This is not financial advice.
Symbol: AXISBANK (NSE)
Date Observed: 18 August 2023
Time Frame: 15-Minute Chart
Study Used: Gann Square of 9 (Normal Price Capacity)
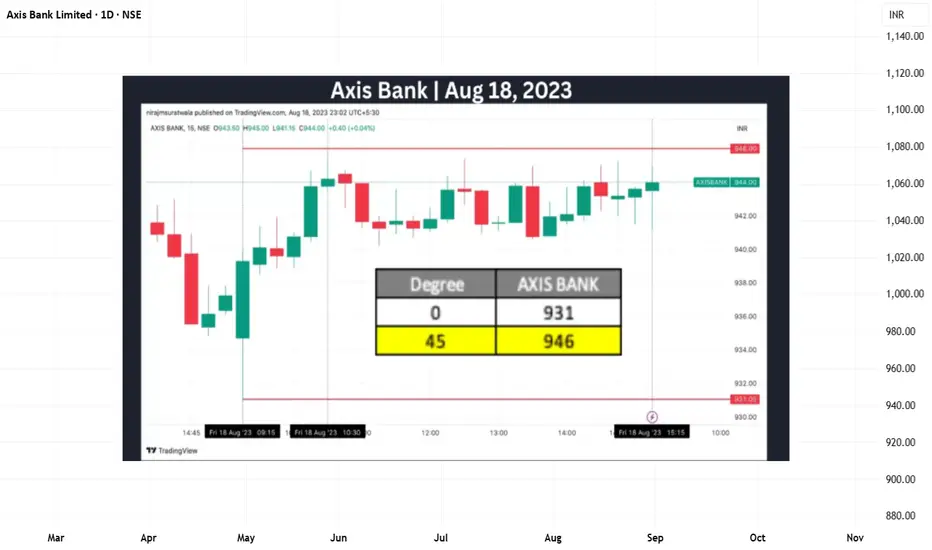
This idea shares a historical intraday observation where Axis Bank’s price movement stayed within a normal Square of 9 price range, followed by a visible reaction after price–time alignment.
📊 Market Context & Reference Selection
- During the session, price showed gradual upward movement starting later in the morning.
- In upward conditions, the low of the reference candle (~931) was treated as the 0-degree level, following commonly used Gann principles.
- From this reference, the Square of 9 was applied to observe expected intraday price expansion.
- This process focuses on structure and measurement, not forecasting.
🔢 Square of 9 Levels Observed
- Based on the selected reference:
- 0 Degree: ~931
- 45 Degree (Observed Normal Upside Capacity): ~946
- The 45-degree level is monitored as a potential reaction zone when reached early in the session.
⏱️ Observed Price–Time Behavior
- Price moved upward from the reference area and interacted with the 45-degree zone around 10:30 AM.
- This interaction occurred well before typical intraday time thresholds.
- After reaching this zone, the market showed temporary selling pressure.
- Similar reactions have been historically observed when normal intraday capacity is completed early.
- The entire session’s range remained within this capacity, reflecting balanced price behavior.
📘 Educational Takeaways
- Importance of selecting a valid 0-degree reference
- Measuring normal intraday price range using Square of 9
- Observing time alignment along with price levels
- Recognizing reaction zones rather than fixed turning points
- Maintaining a disciplined, rule-based analytical approach
- This example illustrates how price-time tools can be used to interpret intraday behavior objectively.
📌 Shared strictly for educational and historical chart-study purposes.
#AxisBank #GannSquareOf9 #WDGann #IntradayAnalysis #MarketEducation #PriceTime #TechnicalAnalysis #RuleBasedStudy

Publikasi terkait
Pernyataan Penyangkalan
Informasi dan publikasi ini tidak dimaksudkan, dan bukan merupakan, saran atau rekomendasi keuangan, investasi, trading, atau jenis lainnya yang diberikan atau didukung oleh TradingView. Baca selengkapnya di Ketentuan Penggunaan.
Publikasi terkait
Pernyataan Penyangkalan
Informasi dan publikasi ini tidak dimaksudkan, dan bukan merupakan, saran atau rekomendasi keuangan, investasi, trading, atau jenis lainnya yang diberikan atau didukung oleh TradingView. Baca selengkapnya di Ketentuan Penggunaan.