
Axie Infinity (AXS) technical analysis:
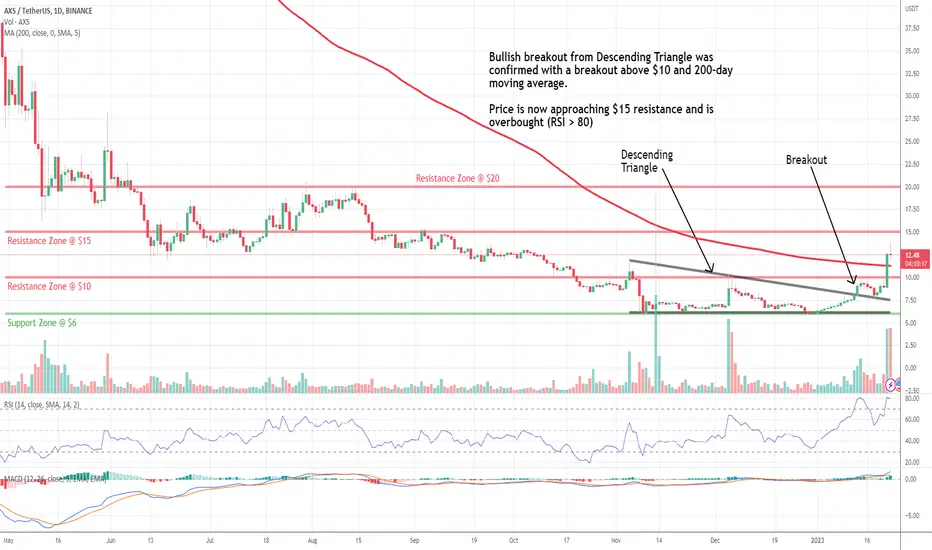
Trade setup: Bullish breakout from Descending Triangle was confirmed with a breakout above $10 and 200-day moving average. Price is now approaching $15 resistance and is overbought (RSI > 80). The recent big move comes ahead of a negative catalyst in form of an upcoming token unlock.
Trend: Uptrend on Short- and Medium-Term basis and Downtrend on Long-Term basis.
Momentum is Bullish but extremely overbought. (MACD Line is above MACD Signal Line). RSI is bullish (> 55) but extremely overbought (> 80) which could imply that price could briefly pause or pull back if it reaches Resistance.
Support and Resistance: Nearest Support Zone is $6. The nearest Resistance Zone is $10, which it broke, then $15, and $20.

Pernyataan Penyangkalan
Informasi dan publikasi ini tidak dimaksudkan, dan bukan merupakan, saran atau rekomendasi keuangan, investasi, trading, atau jenis lainnya yang diberikan atau didukung oleh TradingView. Baca selengkapnya di Ketentuan Penggunaan.
Pernyataan Penyangkalan
Informasi dan publikasi ini tidak dimaksudkan, dan bukan merupakan, saran atau rekomendasi keuangan, investasi, trading, atau jenis lainnya yang diberikan atau didukung oleh TradingView. Baca selengkapnya di Ketentuan Penggunaan.