
What Connects the Nasdaq and Bitcoin? A Practical Macro Explanat
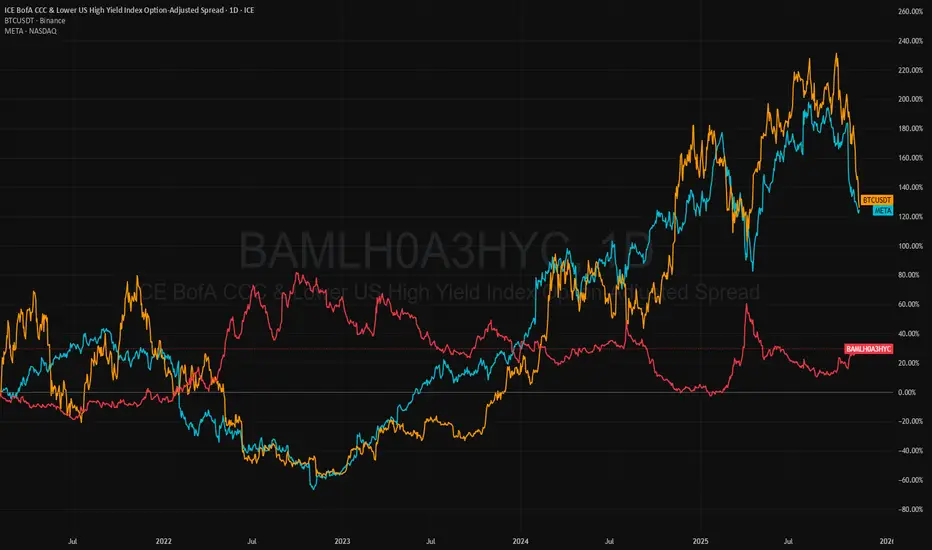
Have you ever overlapped the charts of Bitcoin and tech stocks like Meta (META)? The similarity in their movements is striking. On one side, a decentralized, volatile cryptocurrency; on the other, a giant of the corporate tech world. What makes them move in sync?
The short answer is they are both highly sensitive "risk-on" assets. Their correlation is not a coincidence, but a direct symptom of how cheap money and risk appetite drive the markets.
The Two Pillars Moving Tech Stocks and Bitcoin
1. The Liquidity Tap: Fed Monetary Policy
When the Fed cuts interest rates or injects liquidity, the message is clear: money is cheap and abundant. This is rocket fuel for risk assets.
Tech Stocks (e.g., META): As growth stocks, their value is based on future earnings, which are discounted by interest rates. Lower rates make those future profits more valuable today.
Bitcoin: As a non-yielding, speculative asset, it thrives when investors, hungry for returns, move away from low-yielding bonds and savings.
The same wind that fills the sails of tech stocks also pushes the Bitcoin boat.
2. The Fear Gauge: Credit Spread (The Cost of Money)
A powerful but less-known indicator is the Option-Adjusted Spread (OAS) on high-yield "junk" bonds (e.g., tracked by the BAMLH0A3HYC index). This spread is a market "fear gauge."
Spread Narrowing: Indicates confidence and a green light for "risk-on." Both tech stocks and BTC tend to rise.
Spread Widening: Signals stress and a "flight to safety." This simultaneously punishes both META and BTC.
The Transmission Mechanism: A wider spread increases borrowing costs for companies and dampens growth expectations, hurting profit projections for tech. Simultaneously, stress in the much larger bond market drains systemic liquidity, negatively impacting all speculative assets—a category Bitcoin perfectly fits.
The 4-Year Cycle Coincidence: BTC Halving vs. Economic Cycle
This brings us to the cornerstone Bitcoin narrative: the halving, which occurs every four years and is often credited for bull markets.
But what if we compare it to the cycles of the Nasdaq?
The timing alignment is, at the very least, suspicious. Is Bitcoin's 4-year cycle a unique, independent force? Or has it simply aligned perfectly with the global cycles of liquidity and risk appetite?
The hypothesis is provocative for BTC purists: perhaps the halving is more of a narrative catalyst within a larger economic cycle, not its primary cause. The reduction in new BTC supply finds fertile ground precisely when global liquidity is high and the hunger for risk is strong.
Conclusion: Correlation is Not Causation, But...
The famous phrase holds true, but with a key addition. The correlation between Nasdaq and BTC isn't direct causation—one doesn't make the other rise or fall. However, they are both effects of the same cause: global macroeconomic conditions.
They are two passengers on the same "Risk-On" boat. When the sea is calm and the wind of liquidity blows favorably, they sail to new heights. When the storm of fear and monetary tightening approaches, both are hit by the same waves.
As for the 4-year cycle, the question remains: did Satoshi Nakamoto foresee economic cycles and sync the halving to them? Or did we, seeing a convenient coincidence, build a cause-and-effect narrative where only a perfect correlation exists?
The truth likely lies somewhere in the middle. And understanding these macroeconomic mechanisms is key to not being fooled by a simple line on a chart.
 META
META  BTCUSD
The short answer is they are both highly sensitive "risk-on" assets. Their correlation is not a coincidence, but a direct symptom of how cheap money and risk appetite drive the markets.
The Two Pillars Moving Tech Stocks and Bitcoin
1. The Liquidity Tap: Fed Monetary Policy
When the Fed cuts interest rates or injects liquidity, the message is clear: money is cheap and abundant. This is rocket fuel for risk assets.
Tech Stocks (e.g., META): As growth stocks, their value is based on future earnings, which are discounted by interest rates. Lower rates make those future profits more valuable today.
Bitcoin: As a non-yielding, speculative asset, it thrives when investors, hungry for returns, move away from low-yielding bonds and savings.
The same wind that fills the sails of tech stocks also pushes the Bitcoin boat.
2. The Fear Gauge: Credit Spread (The Cost of Money)
A powerful but less-known indicator is the Option-Adjusted Spread (OAS) on high-yield "junk" bonds (e.g., tracked by the BAMLH0A3HYC index). This spread is a market "fear gauge."
Spread Narrowing: Indicates confidence and a green light for "risk-on." Both tech stocks and BTC tend to rise.
Spread Widening: Signals stress and a "flight to safety." This simultaneously punishes both META and BTC.
The Transmission Mechanism: A wider spread increases borrowing costs for companies and dampens growth expectations, hurting profit projections for tech. Simultaneously, stress in the much larger bond market drains systemic liquidity, negatively impacting all speculative assets—a category Bitcoin perfectly fits.
The 4-Year Cycle Coincidence: BTC Halving vs. Economic Cycle
This brings us to the cornerstone Bitcoin narrative: the halving, which occurs every four years and is often credited for bull markets.
But what if we compare it to the cycles of the Nasdaq?
The timing alignment is, at the very least, suspicious. Is Bitcoin's 4-year cycle a unique, independent force? Or has it simply aligned perfectly with the global cycles of liquidity and risk appetite?
The hypothesis is provocative for BTC purists: perhaps the halving is more of a narrative catalyst within a larger economic cycle, not its primary cause. The reduction in new BTC supply finds fertile ground precisely when global liquidity is high and the hunger for risk is strong.
Conclusion: Correlation is Not Causation, But...
The famous phrase holds true, but with a key addition. The correlation between Nasdaq and BTC isn't direct causation—one doesn't make the other rise or fall. However, they are both effects of the same cause: global macroeconomic conditions.
They are two passengers on the same "Risk-On" boat. When the sea is calm and the wind of liquidity blows favorably, they sail to new heights. When the storm of fear and monetary tightening approaches, both are hit by the same waves.
As for the 4-year cycle, the question remains: did Satoshi Nakamoto foresee economic cycles and sync the halving to them? Or did we, seeing a convenient coincidence, build a cause-and-effect narrative where only a perfect correlation exists?
The truth likely lies somewhere in the middle. And understanding these macroeconomic mechanisms is key to not being fooled by a simple line on a chart.
META BTCUSD 
Pernyataan Penyangkalan
Informasi dan publikasi ini tidak dimaksudkan, dan bukan merupakan, saran atau rekomendasi keuangan, investasi, trading, atau jenis lainnya yang diberikan atau didukung oleh TradingView. Baca selengkapnya di Ketentuan Penggunaan.
Pernyataan Penyangkalan
Informasi dan publikasi ini tidak dimaksudkan, dan bukan merupakan, saran atau rekomendasi keuangan, investasi, trading, atau jenis lainnya yang diberikan atau didukung oleh TradingView. Baca selengkapnya di Ketentuan Penggunaan.