
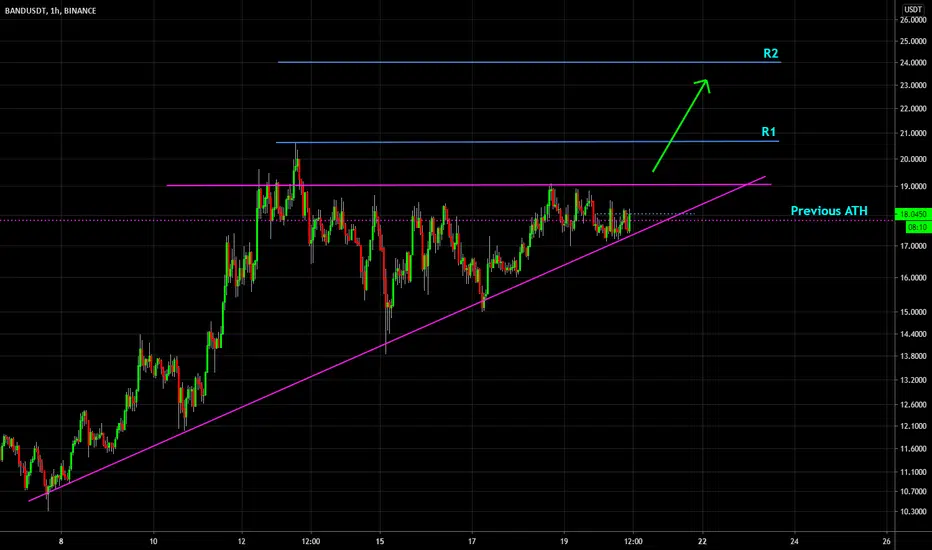
BAND has seen a period of consolidation after (marginally) bettering the previous all time high around $18. Since then, it has seen some bullish price action with higher highs and higher lows. At this point, a bullish triangle is unfolding.
Before entering this trade, wait till the price has closed above the top resistance of the triangle. Higher time frames provide more indicative power.
On the chart I’ve marked two potential areas of resistance, R1 and R2. These areas are based on recent swing highs and round numbers. Do your own due diligence.
Happy trading!
Before entering this trade, wait till the price has closed above the top resistance of the triangle. Higher time frames provide more indicative power.
On the chart I’ve marked two potential areas of resistance, R1 and R2. These areas are based on recent swing highs and round numbers. Do your own due diligence.
Happy trading!

🎯Official Channel: t.me/FieryTradingChannel
📈Try my Premium Signals for FREE - 80% Win-Rate: t.me/FT_Futures_free
✅Monster Signals: t.me/monster_cryptosignals
🔥Premium Signals: fierytrading.com
📈Try my Premium Signals for FREE - 80% Win-Rate: t.me/FT_Futures_free
✅Monster Signals: t.me/monster_cryptosignals
🔥Premium Signals: fierytrading.com
Publikasi terkait
Pernyataan Penyangkalan
Informasi dan publikasi ini tidak dimaksudkan, dan bukan merupakan, saran atau rekomendasi keuangan, investasi, trading, atau jenis lainnya yang diberikan atau didukung oleh TradingView. Baca selengkapnya di Ketentuan Penggunaan.
🎯Official Channel: t.me/FieryTradingChannel
📈Try my Premium Signals for FREE - 80% Win-Rate: t.me/FT_Futures_free
✅Monster Signals: t.me/monster_cryptosignals
🔥Premium Signals: fierytrading.com
📈Try my Premium Signals for FREE - 80% Win-Rate: t.me/FT_Futures_free
✅Monster Signals: t.me/monster_cryptosignals
🔥Premium Signals: fierytrading.com
Publikasi terkait
Pernyataan Penyangkalan
Informasi dan publikasi ini tidak dimaksudkan, dan bukan merupakan, saran atau rekomendasi keuangan, investasi, trading, atau jenis lainnya yang diberikan atau didukung oleh TradingView. Baca selengkapnya di Ketentuan Penggunaan.