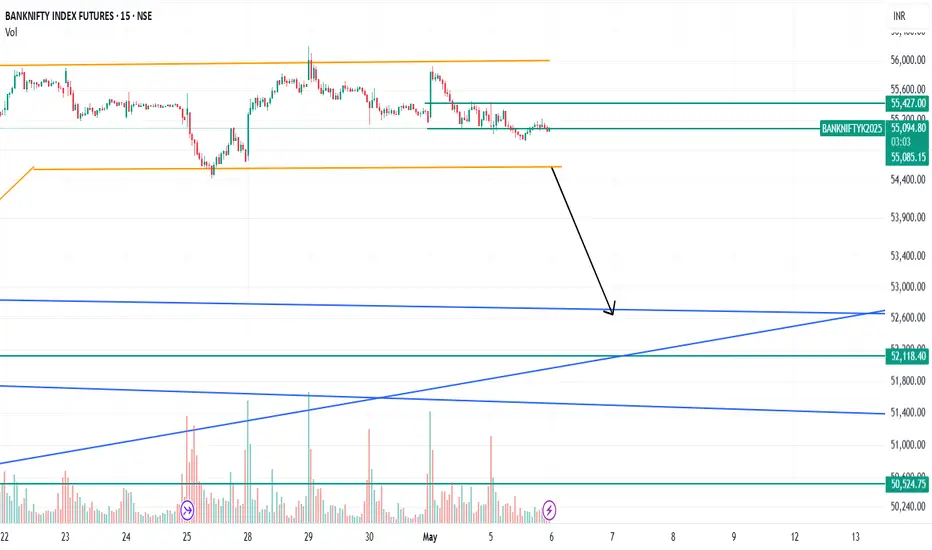
Key Support & Resistance Zones:
Resistance Zone (Top of range): Around 55,400.
Support Zone (Bottom of range): Around 55,000.
Next Major Support below the range:
54,500 ( Immediate Support)
52,700 ( Trenline Support)
52,129 (Horizontal Trenline Support)
Trendlines:
The chart shows a strong ascending trendline from earlier lows.(yellow coloured trendline)
But Looking at Recent Highs bulls are loosing momentum at 55800 to 55900 tried 4 time to break but failed to break range which shows weakness on bull side
What to Look :
If range break from 54900 with high volume and bar candle we can move down towards the immediate support then we can expect a bounce at range support at 54500
Or If Gap up or Gap Down can shift the momentum

Pernyataan Penyangkalan
Informasi dan publikasi ini tidak dimaksudkan, dan bukan merupakan, saran atau rekomendasi keuangan, investasi, trading, atau jenis lainnya yang diberikan atau didukung oleh TradingView. Baca selengkapnya di Ketentuan Penggunaan.
Pernyataan Penyangkalan
Informasi dan publikasi ini tidak dimaksudkan, dan bukan merupakan, saran atau rekomendasi keuangan, investasi, trading, atau jenis lainnya yang diberikan atau didukung oleh TradingView. Baca selengkapnya di Ketentuan Penggunaan.