
$BAT/USDT Analysis - VWAP-Based
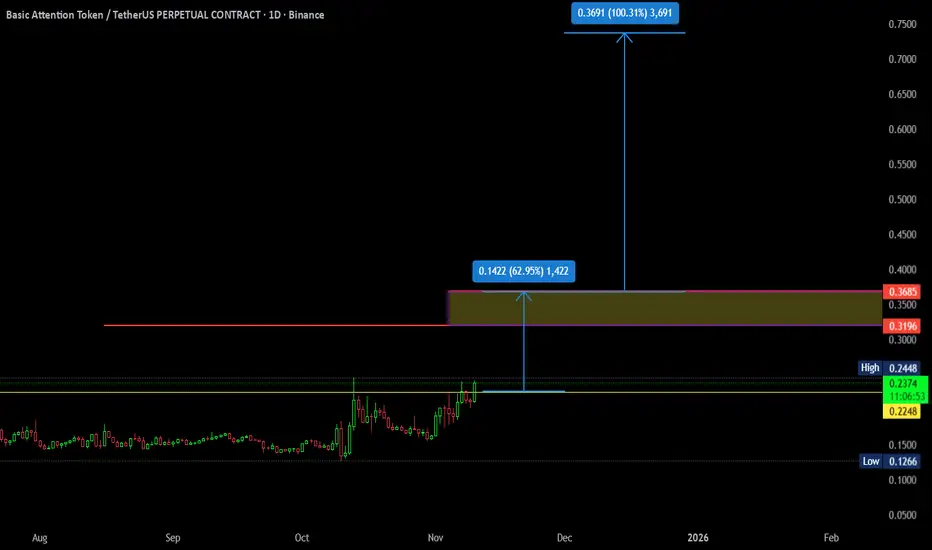
This analysis is based on VWAP (Volume Weighted Average Price) using monthly and daily charts.
Key Points:
- VWAP levels indicate significant support and resistance zones.
- The highlighted box represents the price expected on November 30 (note: November has 30 days, not 31).
- A daily close above $0.24 could signal a 62–100% potential upside.
Using VWAP across multiple timeframes helps identify both short-term and long-term trends.
💡 My strategy combines VWAP with Z-score deviations to pinpoint high-probability moves, this is what sets my approach apart.
Key Points:
- VWAP levels indicate significant support and resistance zones.
- The highlighted box represents the price expected on November 30 (note: November has 30 days, not 31).
- A daily close above $0.24 could signal a 62–100% potential upside.
Using VWAP across multiple timeframes helps identify both short-term and long-term trends.
💡 My strategy combines VWAP with Z-score deviations to pinpoint high-probability moves, this is what sets my approach apart.
Trade aktif
Key Updates:- Price respected the projected November 30 target zone, validating the VWAP structure.
- We have now seen increased stability above the $0.24 level, which on Nov 10 was the key trigger for a potential 62–100% upside move.
What this means now:
- As long as price holds above the daily VWAP and maintains structure above $0.24, the bullish scenario remains intact.
- Any retest of VWAP (daily or weekly) may offer high-probability entries, especially if Z-score returns to neutral (0 to ±0.5).
💡 When the volume is the source, the price is the advertiser, and time is the regulator and right now, all three are aligned. The move isn’t just expected, it’s inevitable.

Pernyataan Penyangkalan
Informasi dan publikasi ini tidak dimaksudkan, dan bukan merupakan, saran atau rekomendasi keuangan, investasi, trading, atau jenis lainnya yang diberikan atau didukung oleh TradingView. Baca selengkapnya di Ketentuan Penggunaan.
Pernyataan Penyangkalan
Informasi dan publikasi ini tidak dimaksudkan, dan bukan merupakan, saran atau rekomendasi keuangan, investasi, trading, atau jenis lainnya yang diberikan atau didukung oleh TradingView. Baca selengkapnya di Ketentuan Penggunaan.