
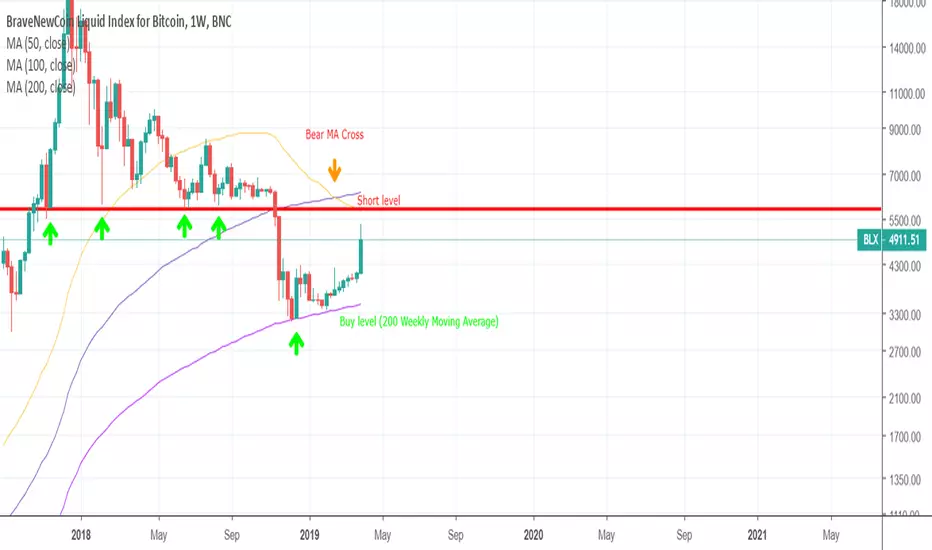
This is the Bitcoin weekly view (BLX chart).
We have seen that the 5800$ level acted as a good support until it was tested for the 5th time in november 2018. Now it is acting as huge resistance and it coincides with the 50 Weekly Moving Average, which also acts a resistance. Furthermore we have seen the bearish MA cross happen already (50 crossed down the 100). The long term support is at the 200 weekly Moving Average.
We have seen that the 5800$ level acted as a good support until it was tested for the 5th time in november 2018. Now it is acting as huge resistance and it coincides with the 50 Weekly Moving Average, which also acts a resistance. Furthermore we have seen the bearish MA cross happen already (50 crossed down the 100). The long term support is at the 200 weekly Moving Average.

Pernyataan Penyangkalan
Informasi dan publikasi ini tidak dimaksudkan, dan bukan merupakan, saran atau rekomendasi keuangan, investasi, trading, atau jenis lainnya yang diberikan atau didukung oleh TradingView. Baca selengkapnya di Ketentuan Penggunaan.
Pernyataan Penyangkalan
Informasi dan publikasi ini tidak dimaksudkan, dan bukan merupakan, saran atau rekomendasi keuangan, investasi, trading, atau jenis lainnya yang diberikan atau didukung oleh TradingView. Baca selengkapnya di Ketentuan Penggunaan.