
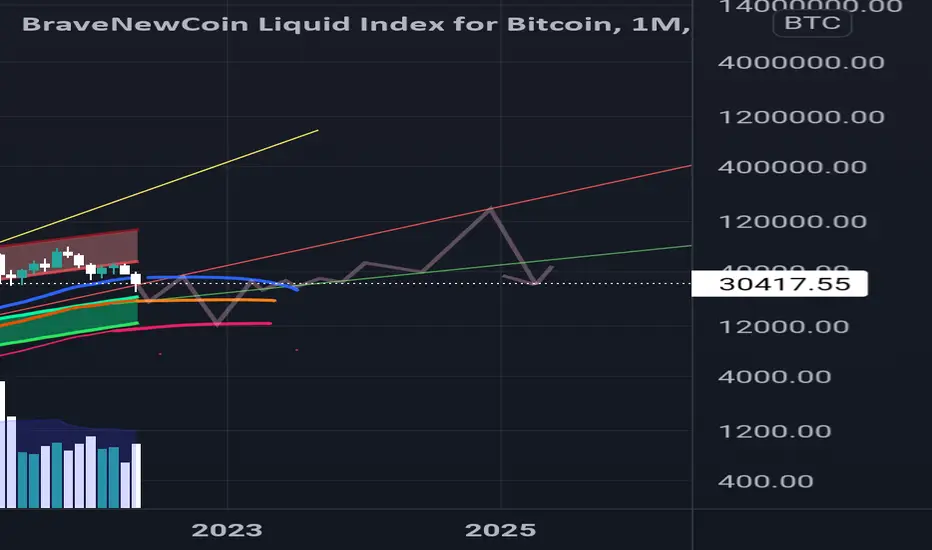
1M 50ma = orange line
1M 25ma = blue line
1M 100ma = red line
Possible long term structure. The faster BTC tops the smaller the price. We will see what happens. Just a guess based on the structure of MA's, and the average correction around 80%. It doesn't seem like the monthly 50ma will hold forever.
1M 25ma = blue line
1M 100ma = red line
Possible long term structure. The faster BTC tops the smaller the price. We will see what happens. Just a guess based on the structure of MA's, and the average correction around 80%. It doesn't seem like the monthly 50ma will hold forever.

Pernyataan Penyangkalan
Informasi dan publikasi ini tidak dimaksudkan, dan bukan merupakan, saran atau rekomendasi keuangan, investasi, trading, atau jenis lainnya yang diberikan atau didukung oleh TradingView. Baca selengkapnya di Ketentuan Penggunaan.
Pernyataan Penyangkalan
Informasi dan publikasi ini tidak dimaksudkan, dan bukan merupakan, saran atau rekomendasi keuangan, investasi, trading, atau jenis lainnya yang diberikan atau didukung oleh TradingView. Baca selengkapnya di Ketentuan Penggunaan.