
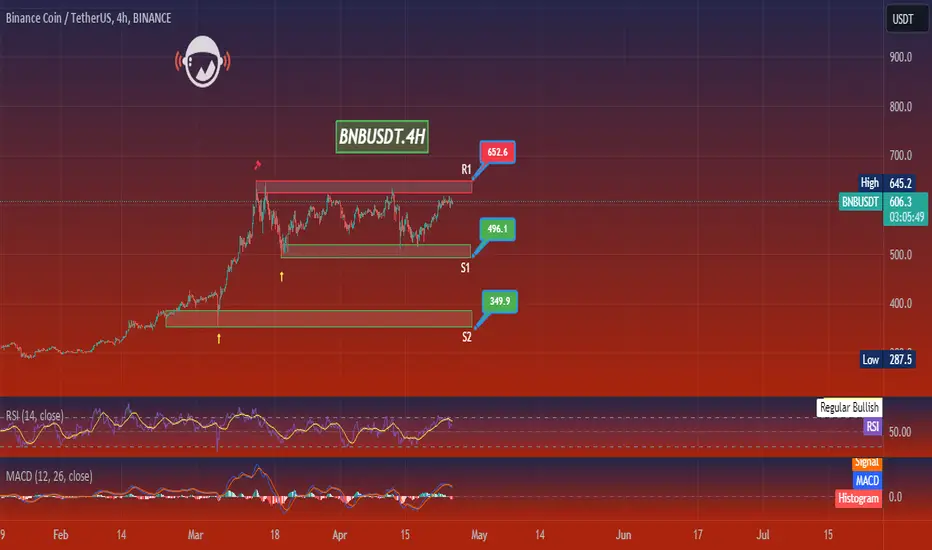
In the 4-hour chart for Binance Coin (BNB/USDT), BNB is trading within a range, with price action fluctuating between support and resistance levels. The resistance (R1) at $652.6 represents the upper boundary of the range, while the support (S1) at $496.1 acts as the lower boundary. There's an additional support level (S2) at $349.9, marked by earlier price interactions.
The current price is at $606.1. The RSI is at a neutral 58.56, suggesting that there's room for movement in either direction without being in the overbought or oversold territory. The MACD is hovering around the signal line, indicating a balance between buyers and sellers with no clear momentum.
For traders, watching for a breakout above R1 could provide a bullish signal, while a break below S1 might suggest bearish momentum. The strategy could involve entering trades following a bounce from S1 or a breakout above R1, with appropriate risk management measures such as stop-loss orders. Confirmation from trading volume would strengthen the signal for entry.

Pernyataan Penyangkalan
Informasi dan publikasi ini tidak dimaksudkan, dan bukan merupakan, saran atau rekomendasi keuangan, investasi, trading, atau jenis lainnya yang diberikan atau didukung oleh TradingView. Baca selengkapnya di Ketentuan Penggunaan.
Pernyataan Penyangkalan
Informasi dan publikasi ini tidak dimaksudkan, dan bukan merupakan, saran atau rekomendasi keuangan, investasi, trading, atau jenis lainnya yang diberikan atau didukung oleh TradingView. Baca selengkapnya di Ketentuan Penggunaan.