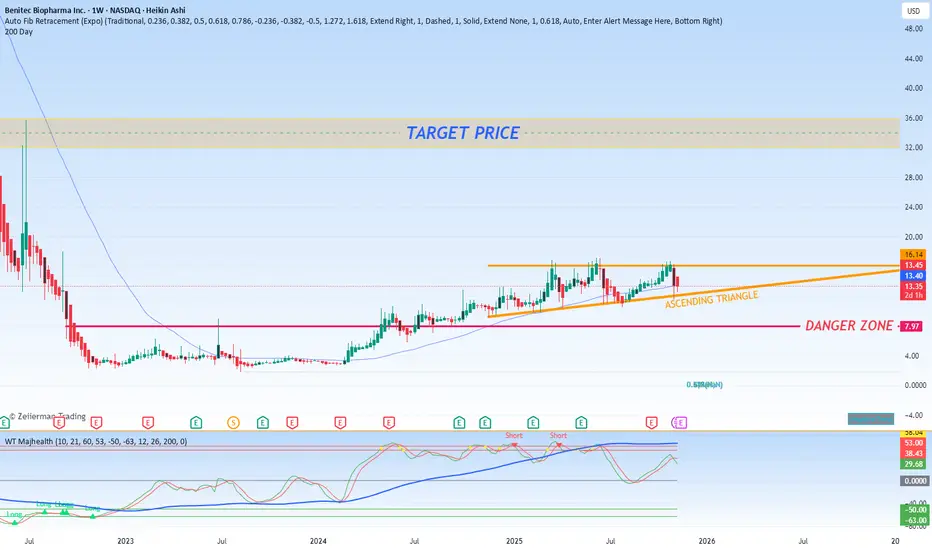
A technical review of  BNTC's price action reveals the formation of a classic and often bullish chart pattern known as an Ascending Triangle. This pattern typically forms during an uptrend and suggests a continuation of the bullish momentum, though it ultimately signals an impending period of significant price volatility.
1. The Bullish Structure: The Ascending Triangle Pattern
The Ascending Triangle is characterized by two key trendlines:
A flat or horizontal resistance line at the top, which price has tested but not decisively broken through. ForBNTC, this key resistance level appears to be in the $26 - $28 range.
An ascending trendline serving as support along the lows, which indicates that buyers are stepping in at progressively higher prices, creating a series of higher lows.
This structure signifies a consolidation phase where selling pressure at a specific price level (the resistance) is being consistently met with increasing buying interest. The pattern reflects a "coiling" of energy, which is typically resolved with a breakout in the direction of the underlying trend—in this case, to the upside.
2. The Breakout Scenarios and Projected Targets
The pattern's primary implication is a buildup of energy that needs to be released. The direction of the breakout will determine the next major move.
Scenario A: The Bullish Breakout (Primary Outlook)
A decisive and high-volume break above the key horizontal resistance (the $26 - $28 zone) is the confirmation of a bullish breakout. This signals that the accumulated buying pressure has finally overwhelmed the sellers and opens the path for a significant upward move.
The measured move target for an ascending triangle is typically calculated by taking the height of the pattern's widest point and projecting it upward from the point of breakout. Based on this standard technical measurement, the projected price targets following a confirmed breakout would be in the $32 to $36 range. This zone would become the primary objective for the ensuing bull run.
Scenario B: The Bearish Breakdown (The Danger Zone)
While the pattern is bullish, it is not a guarantee. A failure to hold support is a critical warning sign. If the price were to reverse and break down below the ascending support trendline, it would invalidate the bullish pattern's structure.
Such a breakdown would indicate that the underlying demand has been exhausted and that sellers have taken control. This would likely trigger a sell-off, pushing the price down to test lower support levels. The initial target on a breakdown would be a retest of the most recent significant swing low, potentially pushing the stock into what can rightly be termed a "danger zone," where a more pronounced downtrend could begin.
Conclusion and Key Levels to Monitor
In summary,BNTC is at a critical technical inflection point, compressed within an Ascending Triangle.
Bullish Confirmation: A sustained break above $28, preferably on above-average volume, is needed to activate the bullish outlook and target the $32 - $36 zone.
Bearish Invalidation: A break below the ascending support trendline would signal pattern failure and suggest a shift in momentum to the downside, warranting a defensive posture.
Neutral Stance: Until a decisive breakout occurs in either direction, the stock is likely to continue oscillating within the triangle's boundaries.
Traders should watch these key levels closely, as the next sustained move will be determined by which side of this technical battle emerges victorious.
BNTC's price action reveals the formation of a classic and often bullish chart pattern known as an Ascending Triangle. This pattern typically forms during an uptrend and suggests a continuation of the bullish momentum, though it ultimately signals an impending period of significant price volatility.1. The Bullish Structure: The Ascending Triangle Pattern
The Ascending Triangle is characterized by two key trendlines:
A flat or horizontal resistance line at the top, which price has tested but not decisively broken through. For
BNTC, this key resistance level appears to be in the $26 - $28 range.An ascending trendline serving as support along the lows, which indicates that buyers are stepping in at progressively higher prices, creating a series of higher lows.
This structure signifies a consolidation phase where selling pressure at a specific price level (the resistance) is being consistently met with increasing buying interest. The pattern reflects a "coiling" of energy, which is typically resolved with a breakout in the direction of the underlying trend—in this case, to the upside.
2. The Breakout Scenarios and Projected Targets
The pattern's primary implication is a buildup of energy that needs to be released. The direction of the breakout will determine the next major move.
Scenario A: The Bullish Breakout (Primary Outlook)
A decisive and high-volume break above the key horizontal resistance (the $26 - $28 zone) is the confirmation of a bullish breakout. This signals that the accumulated buying pressure has finally overwhelmed the sellers and opens the path for a significant upward move.
The measured move target for an ascending triangle is typically calculated by taking the height of the pattern's widest point and projecting it upward from the point of breakout. Based on this standard technical measurement, the projected price targets following a confirmed breakout would be in the $32 to $36 range. This zone would become the primary objective for the ensuing bull run.
Scenario B: The Bearish Breakdown (The Danger Zone)
While the pattern is bullish, it is not a guarantee. A failure to hold support is a critical warning sign. If the price were to reverse and break down below the ascending support trendline, it would invalidate the bullish pattern's structure.
Such a breakdown would indicate that the underlying demand has been exhausted and that sellers have taken control. This would likely trigger a sell-off, pushing the price down to test lower support levels. The initial target on a breakdown would be a retest of the most recent significant swing low, potentially pushing the stock into what can rightly be termed a "danger zone," where a more pronounced downtrend could begin.
Conclusion and Key Levels to Monitor
In summary,
BNTC is at a critical technical inflection point, compressed within an Ascending Triangle.Bullish Confirmation: A sustained break above $28, preferably on above-average volume, is needed to activate the bullish outlook and target the $32 - $36 zone.
Bearish Invalidation: A break below the ascending support trendline would signal pattern failure and suggest a shift in momentum to the downside, warranting a defensive posture.
Neutral Stance: Until a decisive breakout occurs in either direction, the stock is likely to continue oscillating within the triangle's boundaries.
Traders should watch these key levels closely, as the next sustained move will be determined by which side of this technical battle emerges victorious.

Pernyataan Penyangkalan
Informasi dan publikasi ini tidak dimaksudkan, dan bukan merupakan, saran atau rekomendasi keuangan, investasi, trading, atau jenis lainnya yang diberikan atau didukung oleh TradingView. Baca selengkapnya di Ketentuan Penggunaan.
Pernyataan Penyangkalan
Informasi dan publikasi ini tidak dimaksudkan, dan bukan merupakan, saran atau rekomendasi keuangan, investasi, trading, atau jenis lainnya yang diberikan atau didukung oleh TradingView. Baca selengkapnya di Ketentuan Penggunaan.