
1. Big Picture (Market Context)
BPCL was earlier in a downtrend, making lower highs and lower lows.
The price formed a base after heavy selling — this usually signals selling exhaustion.
2. Wyckoff Accumulation Structure
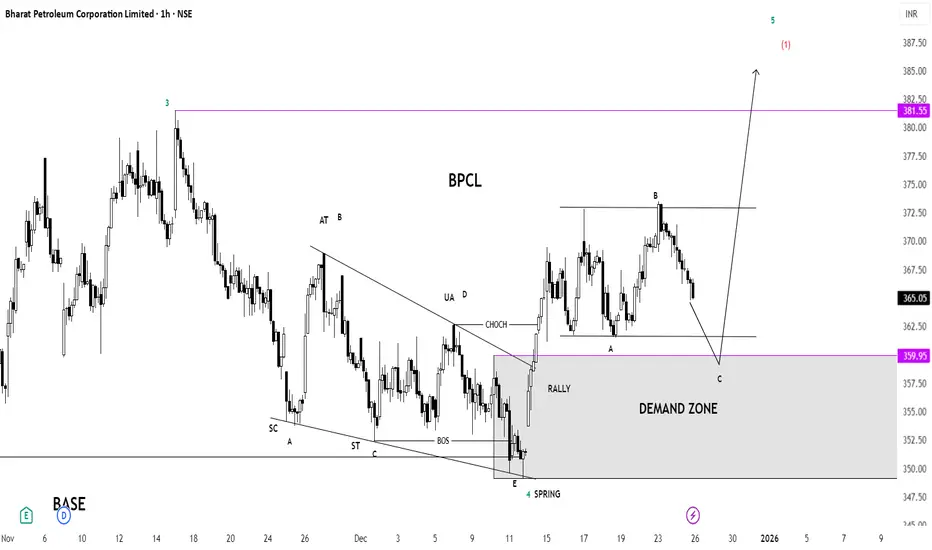
Your chart clearly shows a Wyckoff Accumulation:
SC (Selling Climax): Strong selling pressure near the bottom.
ST (Secondary Test): Price retested the lows with less selling — bearish strength weakening.
Spring (Point E):
Price briefly broke below support.
This is a liquidity grab to trap sellers.
Strong Rally after Spring: Confirms smart money accumulation.
➡️ This structure signals a trend reversal from bearish to bullish.
3. BOS & CHOCH (Smart Money Concepts)
BOS (Break of Structure): Confirms bullish intent.
CHOCH (Change of Character): Market shifts from selling rallies to buying dips.
These two together strongly confirm a bullish reversal.
4. Demand Zone (Key Buy Area)
Grey zone between ₹350–₹360 is the Demand Zone.
Price is currently pulling back toward this zone.
This area is expected to act as support.
👉 If price shows bullish candles here, it becomes a high-probability buy zone.
5. Current Price Action (A-B-C)
A: First support after rally.
B: Lower high / resistance area.
C: Expected final dip into demand zone.
This is a healthy pullback, not weakness.
6. Resistance & Targets
Immediate Resistance:
₹372–₹375 (previous high B)
Major Target:
₹381–₹385 (liquidity & resistance line)
If this breaks, momentum can push price toward ₹387–₹390+
7. Expected Move (Simple Flow)
Small dip into demand zone (₹350–₹360)
Buyers step in
Break above ₹375
Rally toward ₹381–₹385
8. Bullish Confirmation to Watch
Strong bullish candle from demand zone
Volume expansion on breakout
Hourly close above ₹375
Summary (Quick View)
Trend: Turning Bullish
Structure: Wyckoff Accumulation + BOS + CHOCH
Buy Zone: ₹350–₹360 (with confirmation)
Target: ₹381–₹385
Timeframe: Intraday / Short-term Swing
BPCL was earlier in a downtrend, making lower highs and lower lows.
The price formed a base after heavy selling — this usually signals selling exhaustion.
2. Wyckoff Accumulation Structure
Your chart clearly shows a Wyckoff Accumulation:
SC (Selling Climax): Strong selling pressure near the bottom.
ST (Secondary Test): Price retested the lows with less selling — bearish strength weakening.
Spring (Point E):
Price briefly broke below support.
This is a liquidity grab to trap sellers.
Strong Rally after Spring: Confirms smart money accumulation.
➡️ This structure signals a trend reversal from bearish to bullish.
3. BOS & CHOCH (Smart Money Concepts)
BOS (Break of Structure): Confirms bullish intent.
CHOCH (Change of Character): Market shifts from selling rallies to buying dips.
These two together strongly confirm a bullish reversal.
4. Demand Zone (Key Buy Area)
Grey zone between ₹350–₹360 is the Demand Zone.
Price is currently pulling back toward this zone.
This area is expected to act as support.
👉 If price shows bullish candles here, it becomes a high-probability buy zone.
5. Current Price Action (A-B-C)
A: First support after rally.
B: Lower high / resistance area.
C: Expected final dip into demand zone.
This is a healthy pullback, not weakness.
6. Resistance & Targets
Immediate Resistance:
₹372–₹375 (previous high B)
Major Target:
₹381–₹385 (liquidity & resistance line)
If this breaks, momentum can push price toward ₹387–₹390+
7. Expected Move (Simple Flow)
Small dip into demand zone (₹350–₹360)
Buyers step in
Break above ₹375
Rally toward ₹381–₹385
8. Bullish Confirmation to Watch
Strong bullish candle from demand zone
Volume expansion on breakout
Hourly close above ₹375
Summary (Quick View)
Trend: Turning Bullish
Structure: Wyckoff Accumulation + BOS + CHOCH
Buy Zone: ₹350–₹360 (with confirmation)
Target: ₹381–₹385
Timeframe: Intraday / Short-term Swing

Pernyataan Penyangkalan
Informasi dan publikasi ini tidak dimaksudkan, dan bukan merupakan, saran atau rekomendasi keuangan, investasi, trading, atau jenis lainnya yang diberikan atau didukung oleh TradingView. Baca selengkapnya di Ketentuan Penggunaan.
Pernyataan Penyangkalan
Informasi dan publikasi ini tidak dimaksudkan, dan bukan merupakan, saran atau rekomendasi keuangan, investasi, trading, atau jenis lainnya yang diberikan atau didukung oleh TradingView. Baca selengkapnya di Ketentuan Penggunaan.