
Hello
It's a Bitcoin Guide.
My analysis is optimized for TradingView.
If you press the Replay button, you can check real-time movements.

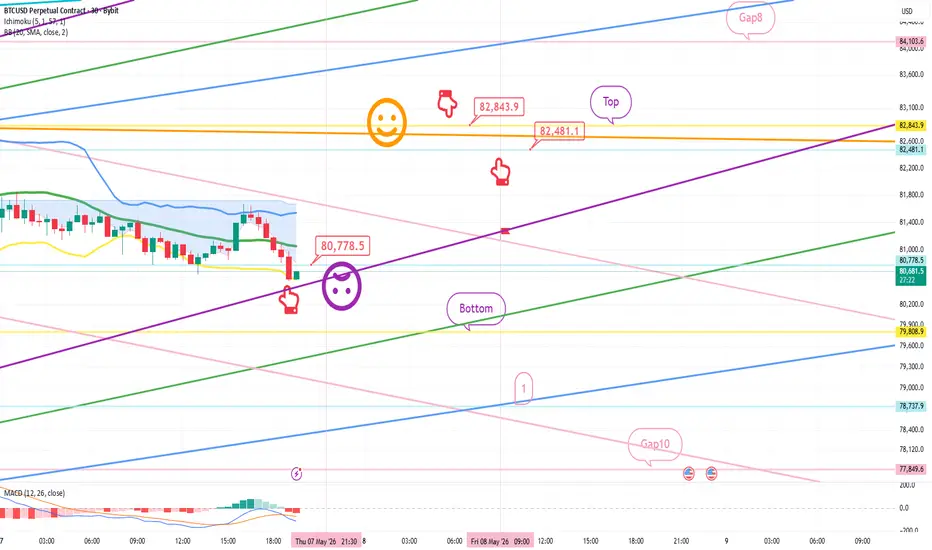
This is the Bitcoin 30-minute chart.
The Nasdaq indicators will be released shortly at 9:30.
A MACD Dead Cross is currently in progress on the 6-hour chart.
Additionally, it appears that today's direction will be determined at the Gap 8 zone formed in January at the top, and the Gap 10 zone formed last week at the bottom.
*Long Position Strategy (Following the red finger movement path)
1) Buy on the 80778.5 dollar mark / Stop loss if the purple support line is broken or the Bottom is touched.
2) 82843.9 dollar Long Position 1st Target -> Gap 8 2nd Target
If the purple support line is broken, the Bottom zone at the bottom opens up to Zone 1.
(Mid-term pattern broken)
If it reaches Zone 1, the probability of a Gap 10 retracement becomes very high.
From the perspective of a long position, it would be best to maintain the purple support line, right?
Please use my analysis merely as a reference and for practical purposes.
I hope you operate safely by adhering to trading principles and strictly using stop-loss orders.
Thank you.
It's a Bitcoin Guide.
My analysis is optimized for TradingView.
If you press the Replay button, you can check real-time movements.
This is the Bitcoin 30-minute chart.
The Nasdaq indicators will be released shortly at 9:30.
A MACD Dead Cross is currently in progress on the 6-hour chart.
Additionally, it appears that today's direction will be determined at the Gap 8 zone formed in January at the top, and the Gap 10 zone formed last week at the bottom.
*Long Position Strategy (Following the red finger movement path)
1) Buy on the 80778.5 dollar mark / Stop loss if the purple support line is broken or the Bottom is touched.
2) 82843.9 dollar Long Position 1st Target -> Gap 8 2nd Target
If the purple support line is broken, the Bottom zone at the bottom opens up to Zone 1.
(Mid-term pattern broken)
If it reaches Zone 1, the probability of a Gap 10 retracement becomes very high.
From the perspective of a long position, it would be best to maintain the purple support line, right?
Please use my analysis merely as a reference and for practical purposes.
I hope you operate safely by adhering to trading principles and strictly using stop-loss orders.
Thank you.
Trading ditutup: stop tercapai
Hello.This is the Bitcoin Guide.
Let's check the movements since the analysis post was written on May 7th.
This is the Bitcoin 30-minute chart.
I have marked the key zones with a black finger.
Regarding the long position strategy indicated by the red finger,
after entering a long position at $80,778.5,
the strategy was executed as a stop loss upon breaking the purple support line.
It touched the bottom zone and continues to undergo corrections.
Please pay attention to Zone 1 at the bottom.
Regarding the Gap 10 zone at the very bottom,
a retracement occurred this past Monday, May 4th, at 10:30 AM with a strong lower wick rebound.
It seems there was a mistake in the check; you may delete this part.
In addition, since the price broke below the purple support line due to yesterday's movement, the mid-term pattern has been broken, and a MACD death cross is currently in progress on the 12-hour and daily charts in real-time.
Because Bitcoin has the fastest turnover rate, it continues to decline compared to the Nasdaq or Gold.
I will proceed with today's strategy right away.
Thank you.

[Bitcoin Guide Affiliate]
*Bybit 20%DC Lifetime + $30,100
partner.bybit.com/b/Bitcoin_Guide
*BingX 50%DC + $14,100
bit.ly/3E8ZkAW
*ZeroMarket ECN 40%DC
bit.ly/3pY0dUv
*Telegram
t.me/bitcoinguide_TM
*Bybit 20%DC Lifetime + $30,100
partner.bybit.com/b/Bitcoin_Guide
*BingX 50%DC + $14,100
bit.ly/3E8ZkAW
*ZeroMarket ECN 40%DC
bit.ly/3pY0dUv
*Telegram
t.me/bitcoinguide_TM
Publikasi terkait
Pernyataan Penyangkalan
Informasi dan publikasi ini tidak dimaksudkan, dan bukan merupakan, saran atau rekomendasi keuangan, investasi, trading, atau jenis lainnya yang diberikan atau didukung oleh TradingView. Baca selengkapnya di Ketentuan Penggunaan.
[Bitcoin Guide Affiliate]
*Bybit 20%DC Lifetime + $30,100
partner.bybit.com/b/Bitcoin_Guide
*BingX 50%DC + $14,100
bit.ly/3E8ZkAW
*ZeroMarket ECN 40%DC
bit.ly/3pY0dUv
*Telegram
t.me/bitcoinguide_TM
*Bybit 20%DC Lifetime + $30,100
partner.bybit.com/b/Bitcoin_Guide
*BingX 50%DC + $14,100
bit.ly/3E8ZkAW
*ZeroMarket ECN 40%DC
bit.ly/3pY0dUv
*Telegram
t.me/bitcoinguide_TM
Publikasi terkait
Pernyataan Penyangkalan
Informasi dan publikasi ini tidak dimaksudkan, dan bukan merupakan, saran atau rekomendasi keuangan, investasi, trading, atau jenis lainnya yang diberikan atau didukung oleh TradingView. Baca selengkapnya di Ketentuan Penggunaan.